THE COST OF URBAN COMMUTE - BALANCING AFFORDABILITY AND SUSTAINABILITY OF PUBLIC TRANSPORT - Centre for Science and ...
←
→
Page content transcription
If your browser does not render page correctly, please read the page content below
THE COST
            OF URBAN
            COMMUTE
      BALANCING AFFORDABILITY AND
SUSTAINABILITY OF PUBLIC TRANSPORT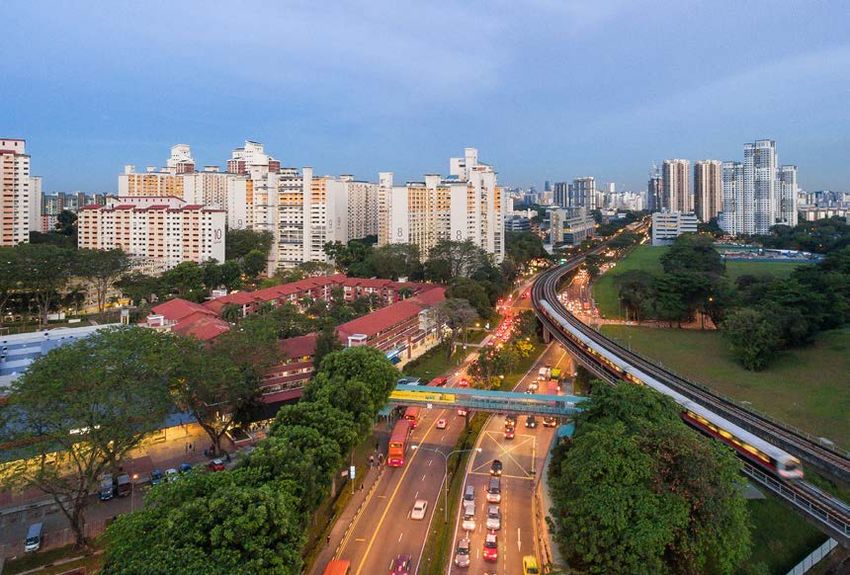
THE COST
     OF URBAN
     COMMUTE
   BALANCING AFFORDABILITY AND
SUSTAINABILITY OF PUBLIC TRANSPORT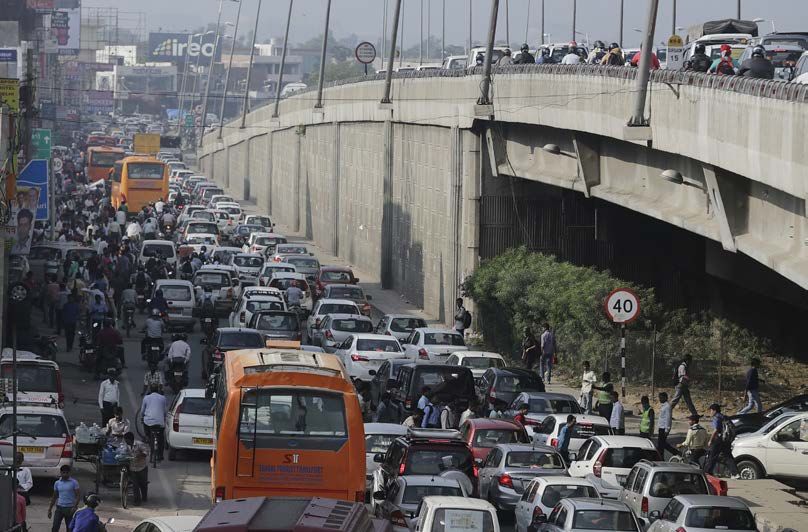
Research director:                    Anumita Roychowdhury
Technical research and content: Gautam Patel (Coordinates Consulting),
                                      Laghu Parashar (technical advisor) and Gaurav Dubey (CSE)
Research support:                     Nirav Joshi (Coordinates Consulting) and Anannya Das (CSE)
Editor:                               Arif Ayaz Parrey
Cover and design:                     Ajit Bajaj
Cover image:                          Vikas Choudhary
Infographics and layout:              Kirpal Singh
Production:                           Rakesh Shrivastava and Gundhar Das

We are grateful to the MacArthur Foundation for institutional support in preparing
this document

© 2019 Centre for Science and Environment

Material from this publication can be used, but with acknowledgement.

Citation: Centre for Science and Environment 2019. The Cost of Urban Commute: Balancing
Affordability and Sustainability, New Delhi

Published by:
Centre for Science and Environment
41, Tughlakabad Institutional Area
New Delhi 110 062
Phone: 91-11-40616000
Fax: 91-11-29955879
E-mail: sales@cseinida.org
Website: www.cseindia.org

Printed at Bravo Printex, New Delhi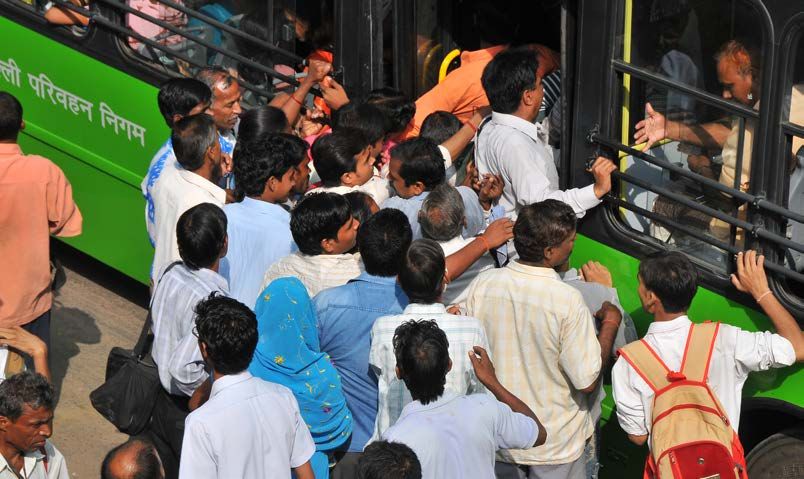
CONTENTS

List of figures                  6

List of graphs                   6

List of tables                   7

Section 1: Why this study?       9

Section 2: The context          17

Section 3: Affordability        21

Section 4: Sustainability       38

Section 5: Current approaches   45

Section 6: Towards a solution   52

References and notes            61
LIST OF FIGURES
    Figure 1: Annual fare revision mechanism suggested by the Fourth
              Fare Fixation Committee                                      29
    Figure 2: Fare revision formula of BMTC                                32
    Figure 3: GST on public transport systems                              43
    Figure 4: Motor vehicle tax in selected cities                         44
    Figure 5: How public transport costs can be apportioned to different
              beneficiaries                                                54

    LIST OF GRAPHS
    Graph 1:    Fare revisions of Delhi Metro                              24
    Graph 2:    Fare revisions for non-AC buses of BMTC                    24
    Graph 3:    Fare revisions of BRTS, Ahmedabad                          24
    Graph 4:    Comparison of fare of members of CoMET and Nova Metro
                system using purchasing power parity                       25
    Graph 5:    Decline in DMRC’s daily ridership in the post-fare hike
                period                                                     30
    Graph 6:    Mode-wise travel cost                                      31
    Graph 7:    Expenditure on operations vs fare revenue of DMRC          32
    Graph 8:    DMRC’s expenditure on operations vs fare revenue with
                and without the fare hike                                  33
    Graph 9:    Impact of network expansion on DMRC’s ridership            33
    Graph 10:   BMTC fare vs cost of travelling by other modes             35
    Graph 11:   Impact of fare revision on ridership of Ahmedabad BRTS     35
    Graph 12:   Financial analysis of BMTC                                 39
    Graph 13:   Financial analysis of Ahmedabad BRTS                       40
    Graph 14:   Total operating expenditure and income from CoMET and
                Nova Metros                                                41
    Graph 15:   Number of buses in India by ownership                      46

6
LIST OF TABLES
Table 1:    Public transport systems selected for the study              19
Table 2:    Item-wise household spending in various countries            22
Table 3:    Percentage of income spent on transport in selected
            Indian cities                                                23
Table 4:    Comparison of affordability of Metro systems in India        26
Table 5:    Parameters of fare revision in public transport
            systems in the three cities                                  27
Table 6:    Affordability ratios for 30 per cent of commuters of DMRC    29
Table 7:    Viability gap between bus systems of different cities        40
Table 8:    Select financial parameters of STUs plying in metropolitan
            cities                                                       41
Table 9:    Issues and mitigation measures for fare revision             42
Table 10:   Taxation and public transport                                42
Table 11:   How India funds public sector Metros                         48
Table 12:   Existing and proposed Metro ridership                        48
Table 13:   How India funds PPP Metros                                   49
Table 14:   Range of farebox recovery ratios across Metro projects       50
Table 15:   Summary of sources and instruments used for financing
            public transit across the world                              51
Table 16:   Apportioning public transport costs to different
            beneficiaries                                                54

                                                                              7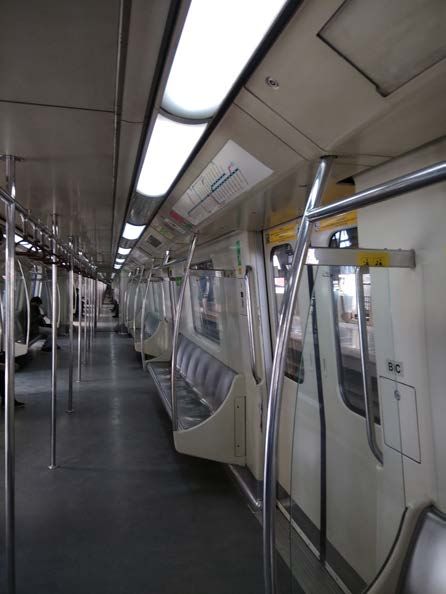
8
1. WHY THIS STUDY?

The scale of transformation needed to augment reliable and efficient public transport
services in Indian cities is massive and will be unprecedented. Cities are experiencing rapid
growth and urban expansion, changing economic and job profiles. Consequently, the demand
for travel is exploding. Cities are under pressure to find sustainable solutions to sustain
staggering number of travel trips daily. The trip numbers can be as high as four crore a day
(in Delhi and Mumbai). If a greater share of these trips moves to personal vehicles, enormous
pollution (and carbon) can get locked in the infrastructure, and that cannot be undone easily.
To avoid this, at least 85–90 per cent of daily travel has to be in the form of public transport.
Several city mobility plans or master plans have (or are in the process of) planning for such a
scale and target. But executing such plans will require transformative changes including well
integrated, efficient and affordable public transport options with a focussed fiscal strategy.

It is ironic that at a time when travel demand is exploding in cities, public transport ridership
is sliding. Service providers are running into losses. Investments are tardy and services are
becoming unaffordable for many. Official forecasts show that the investments needed in
public transport are humongous. The National Transport Development Policy Committee has
estimated that by 2031, Rs 10,900–18,500 billion will be needed for urban transport, out of
which public transport alone will hog 55 per cent.

At the same time, the existing undersupply of public transport is unable to sustain itself
financially. Fiscal strategies will be needed to keep public transport services affordable for
a majority of urban commuters. But massive investment gaps are expected to perpetuate
undersupply of public transport services.

How will Indian cities address the twin challenges of ‘affordability’ and ‘financial sustainability’
of public transport systems? Policies will have to be defined to determine who pays for the
modernization and what fares should be charged. Should only users of the systems pay, even
for fixed costs like depreciation and load repayment, etc.? Or should costs also be recovered
from the society at large benefitting from improved public infrastructure and decreased
pollution?

This challenge of augmenting investments in public transport systems and yet keeping the
overall journey cost for commuters affordable is not well understood. Take the example of
the Delhi Metro Rail Corporation (DMRC). It raised its fares twice in 2017. It is estimated that
the increase in fares varied from 25 per cent to 117 per cent, depending on the length of the
journey. The immediate result was fall in Metro ridership, as is evident from its own data. The
sudden drop in ridership of the Delhi Metro—approximately by 3.9 lakh passengers between
April 2017 and April 2018, is only symptomatic of lack of policy for pricing of all transport
services and lack of strategy for funding and increasing ridership of these systems.

The argument that the Metro is a special service for a specific income class and the income
group for which it became unaffordable may use bus services instead does not hold, as
integrated strategies demand that for public transport to be viable, all modes should be
affordable. To a commuter, what matters is the overall journey cost that is determined by the
cumulative effect of several interchanges between different modes.

                                                                                                       9
It is an accepted fact that periodic fare hikes are needed in all systems to keep them
solvent, to prevent inefficiencies, and to raise money for upgradation and maintenance.
While individual systems will try to balance their fare and non-fare revenues to meet their
operational and fixed costs, especially with rising pressure of modernization, the government
will also have to come up with strategies for urban transport funds, and create a more
enabling policy framework. Linking resource mobilization for investments with revenue
generation and affordability will require substantial policy focus. Fares are adjusted to recover
increase in costs for fuel, maintenance and wages, but there is a limit on how much can be
passed on to the commuters. Some part of operational costs and the larger capital costs
(depending on the type and scale of the system) are also expected to be mobilized through
non-fare means.
If these challenges are not addressed, public transport services will become increasingly
unaffordable, investments wasteful and systems sub-optimal. Also, without a sound financial
sustainability plan, the systems themselves cannot be modernized and expanded to meet
clean and low-carbon mobility targets.
Therefore, in response to the turmoil over Metro fare hike in Delhi, Centre for Science and
Environment (CSE) decided to initiate a diagnostic analysis of what it takes to keep public
transport and overall journey costs affordable for all city dwellers so that new investments in
modern systems—be it the Metro, bus rapid transit system or modern and electric buses—
can ensure an effective shift in ridership from personal vehicles to public transport in Indian
cities.
CSE, in technical collaboration with Ahmedabad-based Coordinates Consulting, initiated this
assessment to examine possible answers to the following (and more such) questions:
• How does one define and account for affordability in public transport while investing to
modernize or expand the systems?
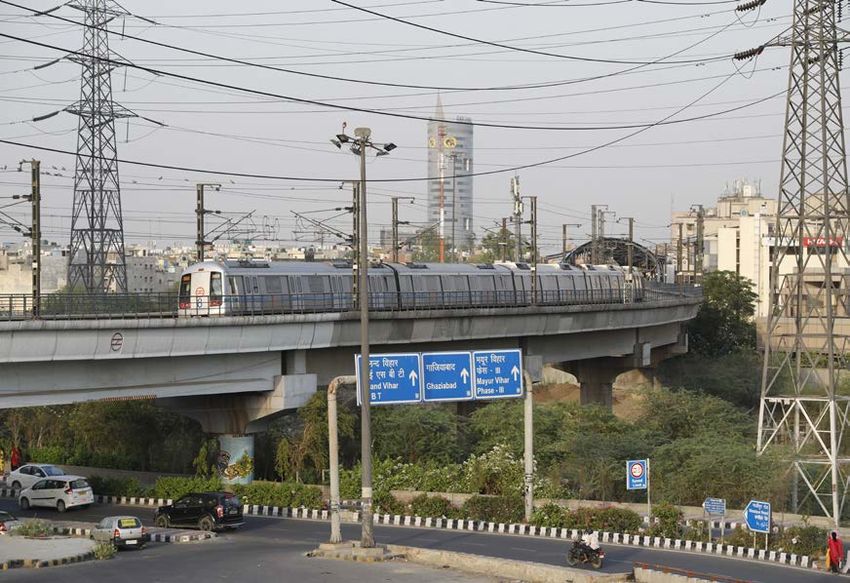
VIKAS CHOUDHARY / CSE
Expansion of public transport is crucial to meet growing travel demand and curb motorization in cities
10THE COST OF URBAN COMMUTE
• What should be the fare setting and revision mechanism?
• How should the integrated journey cost be reflected within public transport fares?
• What are the best practices for recovering costs outside fare revenue?
• Who other than direct users can and should be asked to pay for public transport?
This study has focussed on overall commuting costs of travel by different and combined
modes daily. It has assessed the expenditure an individual makes while using different
systems in Delhi, Bengaluru and Ahmedabad that also includes cost of accessing a system.
This estimate is not about cost of Metro trips per day alone. Journeys for most residents in
Delhi or other cities is not merely about two metro trips a day but interchanges and additional
costs incurred to access public transport systems. Usually, city governments and Metro
service providers do not account for this fact.
This assessment has thrown up several important questions and insights into fiscal planning
for public transport. Some of the key highlights of the assessment are as follows.
Why was fare hiked by the DMRC suddenly? Could it be that the gap between
operating expenditure and fare revenue as well as debt liability had become so wide that
it prompted this sudden and shocking increase after a long time? The study compared the
report of fourth Fare Fixation Committee (FFC) with the annual reports of DMRC to analyze
the rationale for the fare hike. Fare revenues were found to be adequate to meet the operating
expenditure of DMRC upto 2016–17. A fare hike was still recommended by the FFC. CSE
analysis showed that there was an attempt to meet debt servicing expenses plus recover
asset replacement cost through an augmentation in fare revenues. The FFC argued in favour
of the keeping a ratio called ‘cash available for depreciation’ positive and healthy to justify the
fare hike. What this means is a surplus should be maintained after meeting all expenses and
debt liability. This raises larger policy questions for all metros. Can debt liability and asset
replacement cost be recovered through fare income? Should not the larger society, and not
commuters alone, be responsible to meet capacity creation costs?
Why did DMRC’s forecast of operational expenses mutate all of sudden, justifying
the fare hike? Was this sudden mutation of operational expenses the only reason for the fare
hike? Based on data available till 2016–17, fare revenue was adequate to meet operational
expenditure. However, the fourth FFC has made a forecast showing a dramatic increase of
74 per cent in projected operational expenditure from 2017–18 onwards. DMRC has held
that this is due to Phase III (100 km) of the Metro and revisions in the industrial dearness
allowance (DA). The Committee concludes that without a fare hike, there will be a huge
operational loss.
The truth is huge operational surpluses are projected to be generated due to the fare hike.
Why was there a need to hike the fares so that a large operating surplus could be generated?
It appears DMRC hopes to recover almost half of its depreciation costs from this operating
surplus. This could be used to pay off the Japan International Cooperation Agency (JICA)
loan, whose repayment has kicked in recently after the ending of the moratorium period of 10
years for principal repayment.
Moreover, these projections do not account for the loss of ridership due to the fare hike. Might
DMRC have been better off letting natural augmentation of revenue plus the revenue accruing
from Phase III protect it, to a large extent, against higher increase in marginal costs?
Again, it is indeed possible that Phase III would have increased marginal costs at a rate higher
than marginal revenues. In future too, DMRC’s costs may increase with expansion of the Metro
11to lower density areas with sparse
ridership. Will the requirement of an
expanding Metro as a public service
be undermined by considerations of
revenue returns? It is a larger policy
question for all Metro rail as well as
other upgraded systems, including
those that are bus-based.
What is affordable? This is the
critical question. How can modern
public transport services remain
affordable for the majority without
a policy when massive investments
are expected? There is no absolute
threshold to define affordability of
SANDEEP SONI VIA GETTY IMAGES
public transport, but globally it is
accepted that not more than 10–15
per cent of household incomes should
be spent on transport for it to be
termed affordable. Alternatively, a
cap of 10 per cent income spent on
transportation by the poorest 20 per
cent of the population is accepted as a
Public transport systems need to be affordable to ensure benchmark of affordability.
they do not lose ridership
If the criteria of 15 per cent of income
spent on transport is considered as the upper cap of affordability, then almost one-third (34
per cent) of Delhi’s population stands excluded from basic non-air conditioned (AC) bus
services. Now consider the middle income groups—about 30 per cent of the population that
earn between Rs 12,500 and Rs 42,000 a month. After accounting for integrated journey costs,
based on a conservative estimate that a person using a Metro is likely to spend 25 per cent
of the total journey cost to get to the Metro station or to travel from the Metro station to the
destination, these income groups spend between 9 and 14 per cent to use AC bus and Metro
rail services, making them close to unaffordable for them.
Out of the nine metropolitan cities across the world that have an operational public transit
system (bus, tram or Metro) with a per trip cost (for a 10 km trip) of less than half a US
dollar (US $), the Delhi Metro remains the second most unaffordable system in terms of the
percentage of income needed to spend to travel by it.
Such spending comes at a huge social cost. For poor people, higher spending on transport
leads to lower spending on housing, health and education, letting them spiral into greater
poverty. As per CSE’s calculations, unskilled daily wage labourers in Delhi will spend, on an
average, around 8 per cent of their income on travel by a non-AC bus, 14 per cent by an AC
bus and 22 per cent by the Delhi Metro. Comparative figures are even higher for Bengaluru
and Ahmedabad. If one counts the cost of making interchanges (at the 25 per cent rate
derived previously), the total journey cost becomes even more unaffordable.
If the total journey cost were to be around 3–4 per cent, as it is in Singapore, the person
could save upto Rs 50 daily. This could mean around 1.5–2 litre of milk every day for the
12THE COST OF URBAN COMMUTE
family. A month’s worth of such savings could mean life insurance coverage for a year for four
members of the family under the Pradhan Mantri Jeevan Jyoti Bima Yojana (PMJJBY) scheme.
How will India address funding and subsidy for public transport? Currently, the
subsidy cost for each passenger trip by the Metro is enormous. This is particularly true
for Metro systems in smaller cities. The difference between cost on the one hand and fare
revenue on the other hand per passenger trip is Rs 50 for the Jaipur Metro, Rs 78 for the
Lucknow Metro and Rs 28 for the Kochi Metro. Without a fiscal and overall strategy for
improving ridership of integrated systems, how can these systems hope to stay afloat?
Given the price sensitivity of Indian commuters—in both poor and middle income groups—
we will have to devise locally appropriate systems and create institutional and technological
ecosystems to ensure affordable fares and subsidy delivery. How the combination of fiscal
support for operators and users will work needs to be worked out. It is also important to
address the hidden subsidy that personal vehicles like cars and two-wheelers enjoy. In many
ways, two-wheelers are the cheapest mode and travel by cars is also financially competitive
with integrated journey costs by public transport. This rationalization is critical to make public
transport work. Costs of operating improved public transport cannot be met through fare
hikes alone, because that will only catalyze a modal shift to private transport. Subsidies may
be needed to meet the deficit to keep public transport affordable per se and vis-à-vis private
modes. In India, this subsidy is typically provided to the operator, be it the Metro corporation
or State Transport Undertakings (STUs). However, this creates its own challenge, as it does not
incentivize improvement in the efficiency of the Metro or STU system, as they know that they
can fall back on the subsidy to cover their shortfalls.
Realities of public transport operators also need to be factored in—costs are
increasing for operators but there is limit to fare increase; usage is reducing too.
It is important to factor in the realities of the public transport operators too—whether Metro
or bus. Even when some bus operators have access to automatic fare revision systems, they
hesitate to use it, for reasons of affordability. Ahmedabad’s bus rapid transit (BRT) system is
a typical example. Fares have not been increased since 2013 despite legal provisions for an
annual increase. In the absence of any larger fiscal strategy this also creates problems for
the organization. Eventually, without any other strategy in place, they will reach a stage when
shock-increases will become inevitable, as has happened in the case of DMRC.
Bengaluru Metropolitan Transport Corporation (BMTC) uses a slightly different fare revision
mechanism for its buses. A fare revision is triggered when the total value of impact (in
aggregate terms) due to change in fuel prices and DA crosses a threshold of Rs 0.25 per
passenger km. If it is below that, the organization tries to make up for it through productivity
improvement. This is an interesting practice worth replicating, as it ensures that the penalty of
a transport organization not being productive and efficient is not paid for by the passengers
in the form of increased fare. DMRC has decided to include a productivity factor in the
calculation of its next FFC.
New urban transport policies are underfunding sustainable mobility. Even under
the current urban transport programme, the scope of investments is limited and inadequate.
According to the twenty-second report of the Standing Committee on Urban Development
(March 2018), under the Smart Cities Mission the scale of spending is still low. Since 2014–15,
the percentage share of overall annual allocation for the total scheme out of all MoHUA
schemes has varied between as low as 8 per cent in 2015–16 to a maximum of 27 per cent
in 2014–15 to upto the most recent share of 15 per cent in 2018–19. Of the total allocation to
the scheme, the share of urban transport projects is around 21 per cent, which is expected
13to finance smart parking, intelligent traffic management, integrated multimodal transport,
improved walkability, better overall public transport and a whole gamut of other services.
However, according to information available from the Ministry of Housing and Urban Affairs
(MoHUA), road infrastructure (including parking) has the largest share (32 per cent) in this
allocation, followed by transit infrastructure that gets 29 per cent and active transport—
walking and cycling—that gets the lowest 14 per cent. About 22 per cent funds are set aside
for Intelligent Transportation Systems (ITS). As overall spending has remained low, each
element is underfunded.
Similarly, till date, of the projects under Atal Mission for Rejuvenation and Urban
Transformation (AMRUT), only 7.4 per cent are under urban transport and constitute only 1.75
per cent cost of projects. This is a significantly lower amount compared to share of emissions
in cities. The AMRUT scheme has allocated 10 per cent of its annual budget to cities for
‘Incentive for Reforms’ programme that could help promote urban reforms.
Imbalance in funding—bus transport, the prime mover, is neglected. While the
buzz is around attracting investments to the sector—both public and private—there is no
strategy to stop the slide in ridership in diverse public transport systems. The overall share
of public transport fell from 64 per cent in 2001 to 54 per cent in 2010 in Delhi. Within this,
bus services are particularly affected. Since 2013–14, DTC bus ridership is declining at
an average annual rate of 7.75 per cent, leading to a cumulative drop of 31 per cent by
2017–18. Even BMTC, that has witnessed ridership growth in the past decade, is now facing
accumulated losses leading to withdrawal of buses from low-revenue-generating routes,
thus creating service deficit. Daily ridership of Brihanmumbai Electric Supply and Transport
(BEST) buses is reported to have gone down to its lowest ever, a sharp fall of 40 per cent in
the past seven years. Ahmedabad BRT, having expanded its network from a 35 km corridor
to a 125 km corridor, has not seen a corresponding upswing in its passenger traffic. Several
cities are finding it difficult to run their BRT system. Cities like Vijaywada, that made an early
transition to BRT, have stopped operating the system. Clearly, there is dearth of strategies to
make buses work for cities. Poor last minute connectivity for public transport, cheap or free
parking, subsidized road taxes for cars, and lack on integration and operational reforms are
big barriers to the success of buses.
STUs, public bus authorities, carry a vastly higher number of passengers per day compared
to Metro systems. In 2017, in Chennai, STU buses carried 88 times more commuters than
the Metro; in Bengaluru, 12 times; in Jaipur, 11 times; in Lucknow, 2.4 times; and in Delhi, 1.1
times. If one adds the number of passengers being carried by private buses in these cities,
the difference would become even starker.
Yet, funding of the bus system has remained weak. The share of Metro projects in the
budgetary allocation of MoHUA increased from 12 per cent in 2009 to 54 per cent in 2017.
There is no commensurate increase in the funding of buses. Investments in Metro projects
in 2017 were approximately 3.6 times higher than 2010 numbers. A disproportionately high
amount of this money is spent by governments on subsidizing Metro systems in Tier II cities.
State governments are expected to fund buses.
According to the National Transport Development Policy Committee, urban India would require
approximately 196,000 buses with an investment of Rs 1,181 billion by 2031. So far only two
schemes have focused on improving bus transport—the older Jawaharlal Nehru National Urban
Renewal Mission (JnNURM) and the recent Faster Adoption and Manufacturing of (Hybrid and)
Electric Vehicles in India (FAME) policy that has funded electric buses in 10 cities.
14THE COST OF URBAN COMMUTE
LOKMAN ILHAN/ANADOLU AGENCY/GETTY IMAGES
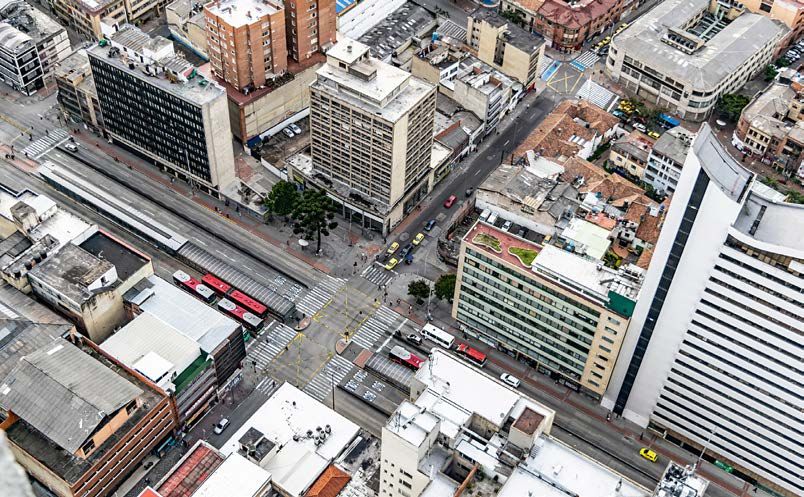
Transit Oriented Development, like the one attempted in the case of Transmilenio, Bogota is an
effective tool to ensure the sustainability of a public transport system
Without a clear strategy to improve ridership, many Metro projects remain
suboptimal. Many Metro projects have remained suboptimal because of ineffective and
inadequate planning and lack of inter-modal integration. The difference between actual
and projected ridership in most Metro projects raises questions about their operational
sustainability. Existing ridership figures of Jaipur, Lucknow and Chennai Metro rail systems,
for instance, show a deficit of greater than 1,000 per cent compared to projected ridership.
Metro rails are long-term capital-intensive projects that require integration of mode and land
use to realize their benefits. Increasingly, programmes are focussed on urban rail that leaves a
majority of cities, especially small- and medium-sized cities, with no transit system. Currently,
there are 425 km of Metro rail systems operational in 10 cities, namely Bengaluru, Chennai,
Delhi, Gurugram, Hyderabad, Kochi, Kolkata, Jaipur, Lucknow and Mumbai. Approximately
700 km of Metro rail is under construction.
Global benchmark for Metro affordability. This study has reviewed the affordability
index for transport systems from the UBS study. UBS is a notable global financial institution
that annually puts out the cost of living in cities around the world. For comparison, this study
has selected cities with systems that have fares less than half a US dollar for a 10 km trip (all
rail-based system in all the nine selected cities). Indian cities have been compared with other
cities in the developing world as they have similar social and economic realities. Developed
countries, with much higher per capita income levels, work in a different affordability
paradigm not comparable to Indian cities.
CSE used the same UBS data to look at the percentage of income spent on rail-based systems
in some of these cities. The percentage of income required to use the Metro stands at 2.9 per
cent in Hong Kong, 4.6 per cent in New York, 5.2 per cent in Seoul, 5.3 per cent in Beijing, 5.7
per cent in Shanghai and 6.6 per cent in Paris. Even London is marginally better than Delhi,
with percentage of income spent on travel by Metro standing at 13.4 per cent, compared to
Delhi’s 14 per cent. Therefore, DMRC’s argument about Delhi Metro being more affordable
than cities with large Metro networks does not hold much ground.
15In fact, in most of these cities, there is no interchange (changing modes during journey)
penalty, with the second trip being free on another mode once the fare has already been
paid to a system, thus bringing down journey costs considerably. Their policy recognizes the
value of considering overall journey cost and does not penalize the passenger for making an
interchange to reach the destination. Can commuters of Indian cities also benefit from such an
integrated system?
There is a need of a fiscal strategy for modernization of integrated public transport
systems and supportive ecosystems for affordable services. Big investments
are possible only with innovative fiscal strategies to mobilize additional resources. Such
investments cannot be sustained only with farebox collections and advertisement. The Metro
Policy 2017, National Transit Oriented development Policy (TOD) 2017, and state-level
TOD policies have provided for non-fare revenue through land value capture, etc. There is
considerable global experience with polluter pay and user pay principles like congestion
and emissions pricing, and road and parking pricing to generate additional revenue from the
direct and indirect beneficiaries of public transport who enjoy attendant benefits. As this is a
very new area of fiscal governance, it will require strong guidance and a legal framework for
it to work correctly, particularly in the case of TOD-based systems. It should not be reduced to
a real estate-led development instead of public transport-led development. The fiscal strategy
will have to be supported by a transit-oriented compact urban form to bring jobs, homes and
recreation together to reduce distances to curtail automobile dependence
STEPS TO BE TAKEN
Urban transport investment plans need to take into account that Indian cities are still far from
reporting stabilization, and effective and substantial shifts towards public transport systems.
There is no clear strategy for such shifts even when master plans and city mobility plans of
several cities have targeted at least 80–90 per cent public transport ridership around 2020
and 2025. Global experience shows that it is very difficult to arrest and reverse slides in
public transport ridership. Yet some rich cities like London, Paris and cities in Scandinavia
have reported improvements in public transport usage, and walking and cycling modal share.
The economics of this transition will have to be addressed along with strategies for urban and
transportation planning.
• Develop an ecosystem of alternate sustainable means of finance for public transport
authorities
• Commit to multi-year subsidy support for public transport linked to productivity
improvements by the authorities
• Adopt scientific fare adjustment mechanisms
• Contain private vehicle proliferation through mode integration
• Use integrated demand aggregation to solve the last mile problem
• Introduce congestion charges along with rationalized parking policy
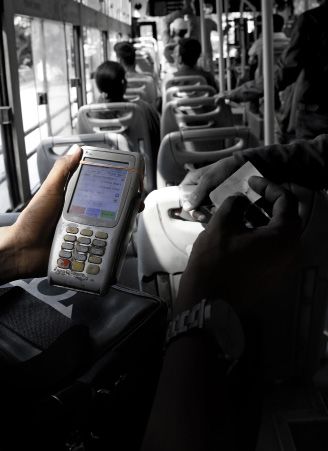
• Use technology to improve fare collection efficiency
• Introduce demand-side disincentives and taxation
• Rationalize taxes to reduce burden on public transport
• Outsource services for which there is a service provider market with strong guarantees
• Link public transport to viable models in order to ease its access to market funding
• Upgrading to clean fuel technology should be accompanied by efforts to help financial
health of public transport authorities
• In the long-run, move towards demand-side subsidies
16THE COST OF URBAN COMMUTE
2. THE CONTEXT
Urban transportation is intimately linked with issues of air quality, public health and climate
change. Positive transformations in the sector will, therefore, result in co-benefits vis-à-vis
these issues. This holds particularly true for public transport.
Action to upgrade and modernize public transport services have started at varying scales
and with differing levels of effectiveness. This translates into the upgradation of bus systems
and adoption of BRT systems. It also translates into wider adoption and penetration of Metro
rail systems. Although a huge deficit in public transport services persists in India, cities are
attempting to tackle these problems with a wide array of innovative solutions. However, these
solutions have had limited success and have created their own set of problems. For example,
Delhi has an extensive Metro rail network that is expanding at a decent pace, but the city is
struggling to create an efficient bus transport system. In other cities, for example Bengaluru,
the trend has been reversed. Buses are leading the way and Metro rail has been relegated to
serve a minute section of the commuter population. Originally, Metro systems were confined
to only megacities but now they have penetrated smaller cities like Jaipur and Kochi. Another
strategy followed by cities like Ahmedabad and Kochi is integrated public transport systems
to provide commuters a range of options.
The success and failure of these initiatives remain contingent on two key parameters:
1. Affordability and inclusiveness of public transport services
2. Financial sustainability of public transport systems
Affordability of public transport services has two components. First, it needs to be seen as
a public service which must be well within the means of the poorer sections of the society.
Second, public transport must be cheap enough for people to prefer it over private modes
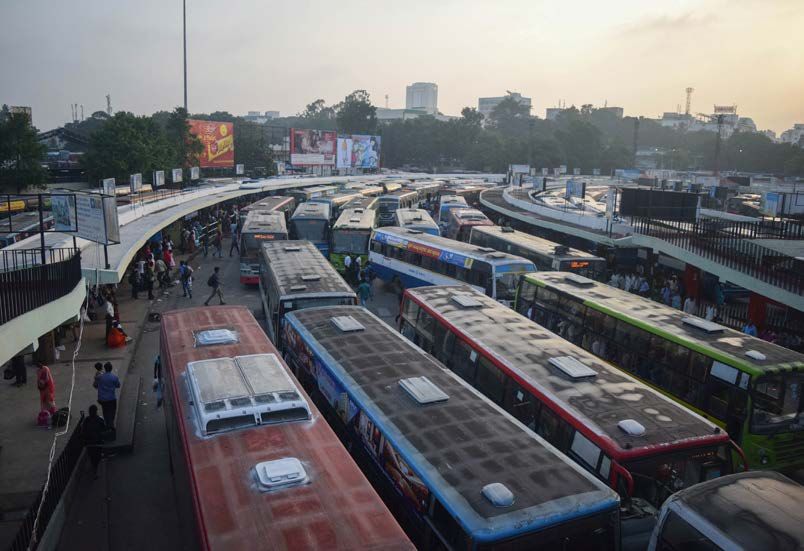
MEETA AHLAWAT / CSE
An affordable public transport system is key to reversing rampant motorization in cities
17of travel. In many Indian cities, using a two-wheeler is substantially cheaper than public
transport. On the other hand, public transport systems need to be financially sustainable, not
only to meet current travel demands but to also have the ability to expand and modernize
with time. These seemingly contrasting aspects together determine to what extent public
transport continues to serve the larger population, thereby preventing it from shifting to
personal modes that also aggravate congestion and increase pollution and heat-trapping
emissions.
The economics of public transport, therefore, becomes a critical aspect of the larger
transition to clean and low carbon mobility. Typically, all public transport systems rely on fares
as well as a range of non-fare revenue streams (advertisement, real estate, consultancy, etc.)
to meet their costs. For different public transport modes, the ratio of fare revenue or non-fare
revenue to operating costs as well as the range of available non-fare revenue sources varies.
While fare revenue is in part dependent on the state’s fare setting and revision policies, non-
fare revenue is partially dependent on the specific agency’s competence to utilize all non-fare
revenue streams. Finally, these operations take place within the larger ecosystem of taxes and
subsidy (to public transport as well as other modes such as cars) that tends to vary across the
geography of India.
As a result of this jigsaw puzzle, different cities and systems have had different experiences
and varying degrees of success in managing their finances. For example, BMTC operates
with relatively high bus fares and couples this revenue with that accrued from other streams.
So it was able to make profits until recently. Some other systems, like West Bengal Transport
Corporation (WBTC) and Delhi Transport Corporation (DTC), have struggled with low fares
and non-frequent fare revision as well as minimal utilization of non-commercial revenue.
Still other systems have experienced flashpoints. For example, Delhi Metro revised fares
twice within a matter of months in 2017 to catch up with increasing operating costs and debt
liability. The revisions snowballed into a major political issue. Given the pace at which cities
are investing in capital-intensive rail-based public transport systems in India, the Delhi Metro
fare revision hubbub could just be a sign of things to come and a warning to address such
issues before they get out of hand.
This context and caveat is the point of intervention of this study. It explores certain key
questions. To understand the entire economics of public transport, to figure out what is
happening with public transport and why, and to gauge where we are likely headed, these
questions are critical:
• How does one define affordability in public transport? Why is it important and how does
one account for it in planning and deploying a public transport system?
• What should be the fare setting and revision mechanism for a public transport system?
How should it take into account various issues concerning organizational productivity,
relative level of service and affordability, apart from the obvious imperative for cost
recovery? What are some of the prevailing practices today in Indian and global urban
centres and where is the room for improvement?
• How does the ecosystem of taxes within which a public transport system operates have a
bearing on fare levels, and how can fares be rationalized?
• How should the integrated journey cost be reflected within public transport fare, and why
is it important to do so?
• What best practices exist across cities and systems for recovering costs outside fare
revenue? Who other than direct users can and should be asked to pay for public
transport? What barriers exist for scaling up these practices? What cost components
should be recovered through fare or other means?
• What should be the mechanism for transmitting the subsidy to public transport? Should
18THE COST OF URBAN COMMUTE
subsidies be paid to operators or directly to users (commuters)?
• Are viability gaps in transport inevitable? If yes, how do we learn to be comfortable, as
a government, and as a society, with them? Who should bear the burden of the viability
gap?
To answer these questions, a carefully designed research approach has been deployed,
with a pragmatic attitude towards lack of available and updated data, not to mention lack of
sufficient cross-case study research on the subject. The study has carefully selected several
public transport systems across India and around the world. These systems meet threshold
criteria of at least 10 years of operation, more than one lakh (0.1 million) daily ridership, and
over 100 km of route length (see Table 1: Public transport systems selected for the study).
Table 1: Public transport systems selected for the study
Country Public transport Years of Approximate Route length Buses Type of
system operation average daily (for Metro under organization
ridership rail) (km) operation
(million)
70 3 - 5,578 STU under Road
and Transport Act,
1950
Delhi City Bus
15 2.8 277 - Public Sector
Company under
Companies Act
Delhi Metro
10 0.15 - 230 100 per cent
subsidiary
company of
Ahmedabad
Ahmedabad BRTS Municipal
Corporation
71 0.7 - 750 Transport
Committee
formed as per
Bombay Provincial
Municipal
Ahmedabad City Bus Corporations Act,
1949
21 5 - 6,400 Fully owned
subsidiary of
KSRTC
Bengaluru City Bus
SBS: 45 3.9 - > 5,000 Limited Companies
(com-
SMRT: 14 bined) Regulated by Land
and Transport
Singapore Bus Authority (LTA)—
Systems Government of
Singapore Agency
31 3.1 200 - LTA
Singapore Metro
19Country Public transport Years of Approximate Route length Buses Type of
system operation average daily (for Metro under organization
ridership rail) (km) operation
(million)
39 4.8 218 - MTR Corporation
Ltd—
Public Limited
Company
Hong Kong Metro
19 6 - 8,500 Transport for
London—
Government
Department
London Bus System
155 5 400 -
London Metro
18 2.2 - 2,000 Office of the
Mayor—
Bogotá
Bogota BRTS
Note: *The Road Transport Corporation Act, 1950
Source: Websites of respective public transport systems and other web-based sources
The selected systems were studied for their fare revision and affordability practices besides
their financial state, source of funding and methods of apportionment of their capital and
operating costs. Data was mainly sourced from fare revision reports, financial statements,
funding agreements, research and studies on public transport systems, and some articles
and news items. Summarized data was also used for other bus systems in India registered
with Association of State Road Transport Undertakings (ASRTU). Studies based on global
Metro member associations such as CoMET and Nova were also used. No primary surveys of
passengers were conducted but interviews were conducted for some systems. Besides these,
a large number of research studies on the subject were consulted for understanding the
theoretical underpinnings of the debate. While more research could reveal more evidence,
we believe that it will only strengthen the conclusions drawn here.
20THE COST OF URBAN COMMUTE
3. AFFORDABILITY
In basic terms, ‘affordability’ refers to an individual’s ability to purchase goods and services.
The affordability of transportation can be defined as the extent to which an individual
or household can financially afford to travel when and where they want.1 Transportation
affordability can be measured by evaluating people’s financial ability to travel using public
transport systems.
Generally speaking, researchers have focussed on defining affordability of transportation
in terms of the percentage of income people spend on it. However, researchers and
policy makers disagree over the exact proportion. Typically, the proportion of household
expenditures devoted to transport by 20 per cent lowest-income households can be
considered a measure of affordability of public transport systems.2 One group of researchers
consider that there is an affordability problem with public transport when more than 10 per
cent households spend more than 15 per cent of their income on work-related trips.3 The
South African government established 10 per cent income as a policy benchmark in its 1996
White Paper on Transport Policy.4&5
However, if we go only by the actual percentage of income spent on transportation, it may
not always present a clear picture. For example, while studies have shown that it is not clear
that households spending less than 10 per cent of income (or expenditure) on transport are
necessarily better off than people that spend more,6 it may be because the high cost of public
transport is forcing poorer sections of the society to walk or cancel trips altogether. If this is
true, it will also skew the data by showing that a smaller percentage of population spends
above the threshold of affordability on transportation. A study carried out by Carruthers,
Dick and Saurkar in 2005 uses a fixed basket of trips to estimate an affordability index.7
They define affordability as ‘the ability to make necessary journeys to work, school, health
and other social services, and make visits to other family members or other urgent journeys
without having to curtail other essential activities.’ Operationally, they use the percentage
of monthly per capita income (or the per capita income of the lowest quintile of the income
distribution) required to make sixty trips per month in each city.
Various studies have, thus, adopted the threshold of 10–15 per cent income spend on
transportation as the upper cap for a system to be called affordable. Further discussions with
academics and experts can help refine this definition.
AFFORDABILITY IN THE INDIAN CONTEXT
Based on these widely accepted definitions, an assessment in the Indian context reveals that,
on an average, almost 15 per cent household income in India is spent on transportation. This
is the upper cap of most definitions of affordability and exceeds some other affordability caps
(see Table 2: Item-wise household spending in various countries).
Indian households spend the highest percentage of income on food, and the second highest
on transportation. Higher spending on transportation leads to lower spending on housing, and
health and education services. This hampers the inclusive growth of the society.
21Table 2: Item-wise household spending in various countries*
Within category Highest spend Above average Below average Lowest spend
Saudi South United
Australia Canada EU-28 India Japan Mexico Russia Arabia Korea States
Housing, fuel
and utilities
10.5 25.3 10.3
Food 30.5 30.7 6.8
Transport 15 19 9.1
Recreation 10
1.5
Health 20.9
1.7
Restaurants
8.2
and hotels
2.6
Clothing and
9.2
footwear
Furnishings 7.3
3.3
Communications 6.3
1.1
Alcohol and
tobacco
8.3
0.5
Education 6.7
1.1
Note: * 2013 figures
Source: Eurostat, Director General of European Commission
This point becomes clearer on a closer examination of public transport systems of three
selected cities, i.e., Ahmedabad, Bengaluru and Delhi. An unskilled daily wage labourer
in Delhi has to spend around 8 per cent income on transportation if they travel by a non-
air conditioned (AC) bus, 14 per cent by an AC bus, and 22 per cent by the Delhi Metro.
The corresponding figures for Ahmedabad (19 per cent if travelling by the premium BRTS
services) and Bengaluru (19 per cent if travelling by an AC bus, and 13 per cent by a non-AC
bus) are equally unflattering (see Table 3: Percentage of income spent on transport in selected
Indian cities).
22THE COST OF URBAN COMMUTE
Table 3: Percentage of income spent on transport in selected Indian cities
Name of Minimum wages Monthly income Average Fare Monthly Percentage of transportation
the city (Rs per day)* (Rs)** trip length Expendi- expenses over total income
(km)*** ture on PT
Skilled Unskilled Skilled Unskilled Mode of Fare Skilled Unskilled
(Rs) *****
public (Rs per
transport trip)
****
Non-AC bus 15 1,170 7 8
Delhi 648 534 16,848 13,884 12.9 AC bus 25 1,950 12 14
Metro 40 3,120 19 22
Non-AC Bus 20 1,560 11 13
AC bus 30 2,340 16 19
Bengaluru 565.54 471.95 14,704 12,271 11.9
(Suvarna)
AC bus (Vajra) 60 4,680 32 38
BRTS 20 1,560 18 19
Ahmedabad 329.2 312 8,559 8,112 9.71
City bus 12 936 11 12
Sources: * Minimum wage Notification of Delhi, Karnataka and Gujarat as in April 2018
** Estimated considering 26 working days in a month
*** Census 2011
**** Prevailing Fare of 2018
***** Considering three trips per day by accounting two working trips and one non working trip by dependent
Except in case of non-AC bus services in Delhi, the lower income group needs to spend
more than 10 per cent monthly income on premium transportation services in all three cities.
If the costs of integrated journeys (including interchanges at a conservative estimate of 25
per cent of the system cost) are considered, the proportion of income spent on transportation
rises further. Additional trips required to access schools and health facilities increase these
costs significantly. This indicates that premium public transport services are beyond the reach
of lower-income groups—a sizeable majority in any city.
It is pertinent to note here that journey fares beyond the level of affordability promotes a
modal shift to private vehicles, particularly two-wheelers or, even worse, create a large pool
of population that cannot afford any kind of motorized transport. Fares for passenger services
in the Delhi Metro can be revised according to the recommendations by the FFC constituted
by the Central Government. This process is guided by the Delhi Metro Railway Act, 2002.
Four such FFCs have been constituted since the inception of DMRC. All of these committees
have been chaired by retired High Court judges with one member representing the Central
Ministry of Housing and Urban Affairs (MoHUA) and another member representing the
government of National Capital Territory (NCT) of Delhi. Fare revisions for Ahmedabad
BRTS and BMTC, Bengaluru are governed by the fare revision formula fixed and notified by
the respective state governments (see Graph 1: Fare revisions of Delhi Metro; Graph 2: Fare
revisions for non-AC buses of BMTC and Graph 3: Fare revisions of BRTS, Ahmedabad).
23Graph 1: Fare revisions of Delhi Metro
Slab-wise fare revision
80
2017
60
Fare (Rs)
40
2009
2005
20
2004
2002
0
0–2
2–4
4–6
6–9
9–12
12–15
15–18
18–21
21–24
24–27
27-30
30-33
33–36
36–39
39–44
> 44
km
2002 2004 2005 2009 2017
Source: Fourth Fare Fixation Committee Report
Graph 2: Fare revisions for non-AC buses of BMTC
30
2015
25
2013
20
Fare (Rs)
15
10
5
0
2 4 6 8 10 12 14 16 18 20 22 24 26 28 30 32 34 36 38 40
km
Source: BMTC
Graph 3: Fare revisions of BRTS, Ahmedabad
30
28 2012
2013
26
24
22
2009
20
Fare (Rs)
18
16
14
12
10
8
6
4
2
0
0 1 2 3 4 5 6 7 8 9 10 11 12 13 14 15 16 17 18 19 20 21 22 23 24 25 26 27 28 29 30 31 32 33 34 35
km
Source: CEPT University and Ahmedabad Janmarg Limited
24THE COST OF URBAN COMMUTE
A comparison between different members of the CoMET and Nova Metro Systems is quite
insightful. (Comet and Nova are Metro membership organizations comprising 37 members.)
Metro fares for a 10 km trip for commuters travelling by CoMET and Nova Metro systems
have been compared using purchasing power parity. Of the 37 members of CoMET and Nova
Metro systems operational in different cities across the world, Delhi Metro’s fare is higher
than 20 (see Graph 4: Comparison of fare of members of CoMET and Nova Metro system using
purchasing power parity).
Graph 4: Comparison of fare of members of CoMET and Nova
Metro system using purchasing power parity*
Berlin 3.003
Washington, DC 3.000
London DLR 2.833
London Underground 2.833
Bangkok 2.516
Sydney 2.458
Rio de Jeneiro 2.097
Sao Paulo 1.853
Kuala Lumpur 1.846
Santiago 1.774
Istanbul 1.671
Taipei 1.616
Singapore 1.593
Barcelona 1.564
New York 1.551
Toronto 1.548
Delhi 1.497
Seoul 1.461
Hong Kong 1.445
Dubai 1.420
Moscow 1.362
Montreal 1.276
Paris Metro / RER 1.210
Sanfrancisco 1.205
Shenzhen 1.083
Madrid 1.074
Oslo 1.073
Shanghai 1.026
Vancouver 1.006
Lisbon 0.769
Brussels 0.762
Buenos Aries 0.756
New Castle 0.699
Guangzhou 0.684
Mexico City 0.560
Nanjing 0.541
Beijing 0.219
* In US $
Source: CSE analysis8
25Table 4: Comparison of affordability of Metro systems in India
City Minimum wages (Rs Monthly income (Rs) Average Metro Monthly Percentage of
per day) trip fare expenditure transportation
length (Rs per on public expenses over total
(km) trip transport income
Skilled Unskilled Skilled Unskilled (Rs) Skilled Unskilled
Delhi 648 534 16,848 13,884 12.9 40 3,120 19 22
Bengaluru 565.54 471.95 14,704 12,271 11.9 35 2,730 19 22
Mumbai 541.38 495.23 14,076 12,876 12.27 40 3,120 22 24
Hyderabad 461.63 318.62 12,003 8,284 9.0 35 2,730 23 33
Chennai NA 8.41 40 NA
Source: Minimum wage notifications of Delhi and Karnataka as in April 2018, websites of paycheck and labour news providing labour-related legal
information. Average trip length has been taken from Census 20119
Delhi Metro’s fare is higher than the prominent Metro systems of Asian cities such as Beijing,
Dubai, Guangzhou, Hong Kong, Seoul, Shanghai, and Shenzen. It is even higher than fares
of Metro systems in cities in developed countries, like Brussels, Madrid, Oslo, Paris and
San Francisco. Having analyzed the members of CoMET and Nova, it is relevant to assess
affordability of Metro systems operational in Indian cities (see Table 4: Comparison of
affordability of Metro systems in India).
Metro systems in Indian cities charge Rs 35 or Rs 40 per trip. Unskilled and skilled daily wage
labourers have to spend around 20 per cent of their income on transport, if integrated journey
cost is considered. This is higher than the global benchmark of 10–15 per cent, making travel
in Indian Metro systems unaffordable for lower income groups.
AFFORDABILITY IN THE CONTEXT OF FARE
ADJUSTMENT POLICIES
Given the adverse findings on affordability, it becomes necessary to assess how public
transport systems across India look at affordability, and to what extent they account for it in
their fare policies. A review of the public transport system of the selected three cities reveals
there is barely any accounting for affordability (see Table 5: Parameters of fare revision in
public transport systems in the three cities). We have reviewed data to understand how the
three systems—Metro, bus and BRT—take affordability into account. It turns out that increase
in dearness allowance (DA) and inflation as measured by the wholesale price index (WPI)
and consumer price index (CPI), etc. are used to justify increase in fares. Affordability in
terms of share of income (as per global benchmarks) used up in commuting, or willingness-
to-pay surveys are not given due importance.
26THE COST OF URBAN COMMUTE
Table 5: Parameters of fare revision in public transport systems
in the three cities
Public Time interval Legal basis Parameters of fare
How affordability is taken
City transport at which fare is revision
into account
system revised
Delhi Metro No fixed interval. Provision of • Costs (energy, • Comparison of fare increase
Revised as per the constitution of staff, maintenance with per cent increase in DA
recommendations FFC as per Delhi and others) and minimum wages
of FFC constituted Metro Railway • Affordability • Commuter surveys (only
by the Central (Operation and Fourth FFC undertook such
Government Maintenance) a survey in the form of
Act, 2002 advertisement at stations.
Sample size was 498 vs a daily
ridership of 28 lakh)
Bengaluru Bus As and when the As per a state Fuel costs and DA • Increase in DA is considered
services combined effect of government’s to represent increase in wages
changes in diesel order of 30 • Setting low fare for non-
prices and DA September 2000 premium services
exceeds Rs 0.25 • Affordability Index,
per passenger km willingness-to-pay surveys,
etc. are not considered
Ahmedabad BRTS Annual A Gujarat Fuel cost and WPI • Fare revision is linked with WPI
government • AJL has been able to revise
notification of 2 fare only twice since it
January 2012 commenced operations ten
years ago
Source: CSE analysis based on fare revision mechanism of the three systems
27DELHI—COUNTING CHICKEN BEFORE
THEY HATCH
VIKAS CHOUDHARY / CSE
Will the expansion of Delhi Metro come at the cost of excluding the poorer sections of society?
DMRC’s fare policy (as per the Fourth Fare Fixation Committee’s Report) justifies increase
in fare due to increase in DA, inflation as measured by consumer price index (CPI), etc., and
increase in minimum wages (to justify affordability). Increase in DA is a valid parameter for an
operator to justify increase in costs. Generally, it cannot be extrapolated to justify affordability
as it ignores the realities of affordability for people employed in the informal economy. Robust
willingness-to-pay surveys and estimation of income profiles of users are not conducted to
adequately inform the fare revision process and the likely consequences. Only the fourth FFC
undertook a willingness-to-pay survey by putting advertisement at stations, but a sample size of
498 vs a daily ridership of 28 lakh cannot be said to have provide adequate data. Often, official
increase in minimum wages is not observed on the ground.
Fare Fixation Committees that revise Delhi Metro’s fares are ad hoc, as per the provisions of the
Metro Act. An independent and permanent committee that continuously reviews all parameters
using passenger surveys, data from the transit authorities and other sources is needed.
Otherwise, the ad hoc committees will continue to indulge in fire-fighting rather than taking
the long view. Case in point is the fourth FFC using CPI and capping fare increase at 7 per cent
per annum. Instead of introducing a ‘productivity factor’ into the calculations now, it has left the
matter for the next FFC to decide. A productivity factor would shift some of the onus of reaching
28THE COST OF URBAN COMMUTE
Figure 1: Annual fare revision mechanism suggested by the Fourth
Fare Fixation Committee
Proportion of energy, manpower and maintenance costs and other costs as per last audited result
Changes in per km maintenance
Changes in unit Changes in CPI
cost and other costs* (excluding
cost of energy from from the last
energy and staff costs from the last
last fare revision fare revision
fare revision)
*Other costs are defined as costs excluding staff,
energy and maintenance cost. This may include
interest and depreciation.
Source: Fourth Fare Fixation Committee report
financial maturity to Metro authorities, goading them towards the use of new and innovative
methods to make money, while unburdening commuters of a portion of the fare hike, making
the Metro a viable and attractive option to them (see Figure 1: Annual fare revision mechanism
suggested by the Fourth fare Fixation Committee).
If the 7 per cent cap on annual fare hike, as suggested by the fourth FFC, is taken into account,
per trip (considering an average trip length of 12.9 km) cost in DMRC would be Rs 31 in 2017
(as it was Rs 18 in 2009). This is lower than the Rs 40 actually recommended by the Committee
after the second fare hike in October 2017.
Again, if DMRC’s own contention of 30 per cent of its commuters being in the Rs 20,000 per
month income bracket is used, then affordability ratios are not convincing (see Table 6:
Affordability ratios for 30 per cent commuters of DMRC).10
If the integrated journey costs, including last mile costs, are considered, then commuters in the
bracket of Rs 20,000 monthly income have to spend 19.5 per cent of their monthly income on
transport, making it unaffordable. However, the percentage increase in fare has been justified
by the fourth FFC by linking the fare increase to increase in DA (see Box: Affordability according
to fourth Fare Fixation Committee report).
Table 6: Affordability ratios for 30 per cent of commuters of DMRC
Particular Details
Monthly income of 30 per cent commuters of DMRC as per Rs 20,000
the Fourth Fare Fixation report
Average trip length as per Census 2011 12.9 km
Fare for average trip length Rs 40
Affordability Index Rs 40 (per trip) x three trips per day x 26 days =
15.6 per cent of Rs 20,000
Integrated Affordability Index (taking into account last mile Rs 50 (per trip) x three trips per day x 26 days =
costs as 25 per cent of the main trip cost) 19.5 per cent of Rs 20,000
Source: CSE analysis
29Affordability according to the fourth Fare Fixation
Committee report
6.4.2: Affordability of fare: The ridership of the Metro and any other public transport system
is extremely sensitive to the fare. An affordable fare is critical for attracting ridership which, in
turn, in key to the business viability and also to serve the commuters' need. In any public utility
transport project, it is very difficult to satisfy every section of the society and there will always
be certain amount of hue and cry from various sections. However, considering long-term
sustainability of providing Metro rail service to the public, it is necessary to have a fine balance
between affordability and financial sustainability.
7.10: 1: The average increase in the fare structure recommended by the Committee staggered
in two Phases is about 51 and 27 per cent respectively. The Committee noted that since the last
fare revision in 2009, the Industrial DA has increased by 95.5 per cent (112.4 per cent in March
2016 vs 16.90 per cent in 2009), and the Central DA has increased by 103 per cent (125 per cent
in March 2016 vs 22 per cent in 2009). The Committee further noted that the minimum wages
applicable for unskilled, semi-skilled and skilled workers have increased by 143.21 per cent,
158.1 per cent and 166.68 per cent respectively during the same period. In addition to this, the
government of National Capital Territory of Delhi (GNCTD) recently proposed an increase in the
minimum wages applicable for different category of workers by 50 per cent and government of
India has also hiked the minimum wages for unskilled non-agricultural workers by 43 per cent.
Therefore, the proposed fare revision is affordable.
Source: Fourth Fare Fixation Committee of Delhi report. Edited for style and consistency
As a result of not accounting for affordability of an entire journey, including last mile
connectivity costs, DMRC risks losing patronage. This was observed in the post fare hike period
(see Graph 5: Decline in DMRC’s daily ridership in the post-fare hike period).
Graph 5: Decline in DMRC’s daily ridership in the post-fare hike period
Fare for trip length of 12.9 km = Rs 18 Fare for trip length of Fare for trip length of 12.9 km = Rs 40
12.9 km = Rs 30
29.7
29.1
29.0
28.1
28.1
27.8
27.9
28.1
28.1
27.8
27.7
27.8
27.8
27.5
27.1
27.2
26.8
26.7
26.2
26.0
26.3
24.9
25.1
25.0
24.7
24.2
24.1
23.5
23.5
23.3
First fare
hike after Second fare
Daily ridership (in lakh)
2009 (67%) hike after
2009 (122%)
January 2016
February 2016
March 2016
April 2016
May 2016
June 2016
July 2016
August 2016
September 2016
October 2016
November 2016
December 2016
January 2017
February 2017
March 2017
April 2017
May 2017
June 2017
July 2017
August 2017
September 2017
October 2017
November 2017
December 2017
January 2018
February 2018
March 2018
April 2018
May 2018
June 2018
Source: DMRC’s replies to RTI queries dated 9 August 2018 and 28 September 2018
30You can also read