Plantation forestry statistics - Contribution of forestry to New Zealand - the Forest Owners Association
←
→
Page content transcription
If your browser does not render page correctly, please read the page content below
Plantation forestry statistics
Contribution of forestry to New Zealand

NZIER report to New Zealand Forest Owners Association and New Zealand Farm
Forestry Association funded by the Forest Growers Levy Trust Inc
March 2017
About NZIER
NZIER is a specialist consulting firm that uses applied economic research and analysis
to provide a wide range of strategic advice to clients in the public and private sectors,
throughout New Zealand and Australia, and further afield.
NZIER is also known for its long-established Quarterly Survey of Business Opinion and
Quarterly Predictions.
Our aim is to be the premier centre of applied economic research in New Zealand. We
pride ourselves on our reputation for independence and delivering quality analysis in
the right form, and at the right time, for our clients. We ensure quality through
teamwork on individual projects, critical review at internal seminars, and by peer
review at various stages through a project by a senior staff member otherwise not
involved in the project.
Each year NZIER devotes resources to undertake and make freely available economic
research and thinking aimed at promoting a better understanding of New Zealand’s
important economic challenges.
NZIER was established in 1958.

Authorship
This paper was prepared at NZIER by Chris Nixon, Dion Gamperle, Daniel Pambudi, and
Peter Clough.
It was quality approved by Mike Henson.
The assistance of Sarah Spring and Deborah O’Connor is gratefully acknowledged.

L13 Grant Thornton House, 215 Lambton Quay | PO Box 3479, Wellington 6140
Tel +64 4 472 1880 | econ@nzier.org.nz
© NZ Institute of Economic Research (Inc) 2012. Cover image © Dreamstime.com
NZIER’s standard terms of engagement for contract research can be found at www.nzier.org.nz.
While NZIER will use all reasonable endeavours in undertaking contract research and producing reports to ensure the
information is as accurate as practicable, the Institute, its contributors, employees, and Board shall not be liable (whether in
contract, tort (including negligence), equity or on any other basis) for any loss or damage sustained by any person relying on
such work whatever the cause of such loss or damage.
Key points
Plantation forestry and logging make a strong direct contribution to the
New Zealand economy
The plantation forestry and logging sector 1 directly accounts for 0.6% of GDP or $1,389
million.
This contribution is:
       •        Greater than the GDP contribution of the sheepmeat and wool sector by
                over 20%
       •        About 45% larger than beef sector in GDP terms
       •        At a similar level of contribution with horticulture
       •        0.9% of the total goods producing industries
       •        Approximately 2.9% of merchandised exports.
On the back of planting in the late 1980s and early 1990s, forestry production has risen
from 10 million cubic metres in 1989 to 28.7 million cubic metres in 2016.
Forestry and logging are extremely important to regional New Zealand:
       •        To the Waikato and Bay of Plenty economies, forestry contributes nearly
                $280 million and $184 million respectively (just over 1% of regional GDP for
                both regions)
       •        The contribution to Gisborne and the surrounding area amounts to $96
                million, nearly 5.5% of that region’s GDP.
Plantation forestry is hugely important to New Zealand’s environment (see Summary
Table). Not the least of which is the importance of carbon capture. The wider
contribution to the environment – worth at least $2 billion per annum – is made
through:
       •        The extraction of materials from forests to provide food, fibre, energy and
                chemicals for pharmaceutical and other uses
       •        Contributions to the stabilisation of soils and reductions in erosion and
                sedimentation, moderation of water flows and microclimates, retention of
                carbon and nutrients from being discharged into the atmosphere and water
       •        Contributions to providing space for recreation and tourism, natural and
                historic heritage, general amenity and protection of biodiversity and
                spiritual associations of iconic locations
       •        Basic physical and chemical functions of nutrient and water recycling.

And contribute to the health of the New Zealand economy…
       •        The plantation forestry industry’s influence extends well beyond its direct
                impacts. Forestry and logging are closely intertwined with the rest of the
                economy and society. This includes jobs, and the incomes it provides, its

   1
           The plantation forestry sector consists of growing the plantation forests and the logging sector is the process of harvesting
           trees.

NZIER report – Plantation forestry statistics                                                                                              i
links to other industries (e.g. transport), the impact it has on rural and
urban centres and the environment
• $3.8 billion 2 in plantation forestry production value was produced by
growing and logging trees nationally in 2015:
− $301 million went on wages and salaries
− $1,100 million went on capital and land
− $2,400 million was spent on inputs (mainly contractor services)
− $171 million was spent on freight to get products to market (not
included but dependent on forestry)
• The harvesting of logs is the first part of the marketing chain. It provides the
wood flow to transport (domestic and export operations), domestic
processing, exports, and domestic consumption all of which provide further
contributions to GDP.
The sector generates jobs
• The plantation forestry sector is estimated to employ around 9,500 people
(see Appendix D). The sector will support many more jobs in industries that
supply forestry, and that experience benefits many regions e.g. it provides
the transport industry with approximately 2,000 jobs and approximately
900 port service workers
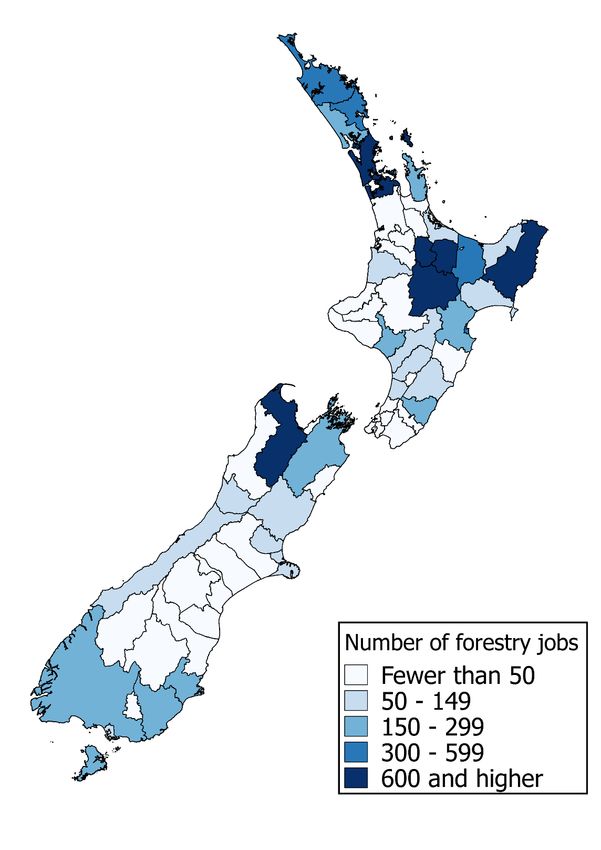
• The plantation forestry sector accounts for 3.2 percent of all employment in
Gisborne and 1.5 percent in Northland
• An increase in returns to the sector both upstream and downstream
benefits workers in many different industries.
And creates exports that improves our standard of living
• Plantation forestry exports were nearly $5 billion in 2015 accounting for
around 2.9% of New Zealand’s total goods exports
• This is larger than sheepmeat (mutton and lamb) and wool exports
• This is larger than beef and veal exports
• Forestry makes a positive contribution to narrowing our current account
deficit
• The forecast for forestry exports is extremely bright rising by 25% by 2020
(6,300 million).3
It drives many rural economies
• Forestry production is hugely important for many regional economies. It
injects $262 million into the Gisborne regional economy and $377 million
into the Northland economy
2
Note that the contribution to GDP is included in the production calculation. The contribution to GDP includes wages
($301m) and capital and land (1,100m). This is slightly more that the contribution to GDP figure which takes off
depreciation.
3
Ministry for Primary Industries (2016) Situation and Outlook for Primary Industries. www.mpi.govt.nz
NZIER report – Plantation forestry statistics ii• Nationally, forestry and logging’s contribution to GDP ($1,389 million)
compares favourably with sheepmeat and wool production ($1,115 million).
• Its GDP contribution is significantly more in the north of the North Island
(such as Northland) and also Tasman/Nelson, relative to sheepmeat and
wool
• Compared to beef production ($953 million), forestry also compares
favourably ($1,389 million). Forestry is more important, relative to beef
and veal production in Bay of Plenty, Tasman/Nelson and Otago.
Forestry faces constraints
• No one ministry or department is responsible for forestry. As forestry
becomes more important with its dual roles as an export earner and its
contribution to the environment (particularly carbon capture) policy
coordination becomes more crucial
• Its environmental contribution is not factored into its economic value. The
impact on soil conservation, nutrient run-off, water quantity and flow
moderation, water quality and biodiversity are significant
• Its impacts on tourism and recreation are also important both for domestic
and foreign tourists.
Recognition of forestry through a satellite account is needed to reflect
its growing importance …
• A satellite account rearranges existing information/data (economic data
such as exports) from industries in the national accounting structure to
highlight aspects of a specific industry with re-defined boundaries. It can be
extended with the introduction of new information/data (such as social and
environmental values) to properly reflect the industry’s importance
• As plantation forestry becomes more important (increased removals and
the necessity for carbon capture) a satellite account either connected to the
tourism satellite account or as a stand-alone satellite account would assist
in better reflecting forestry’s wider benefit to New Zealand
• For the latest tourism satellite account (2016) go to:
http://www.stats.govt.nz/browse_for_stats/industry_sectors/tourism/touri
sm-satellite-account-2016.aspx.
Approach taken to showing forestry’s value
Below we have set out the approach to the project. We:
• Developed a framework for forestry which sets out how forestry is
regulated, its economic contribution, and its contribution to the
environment
• Used various economic and data tools to inform the importance of the
industry e.g. consistent economy wide models at the national and regional
level, the LEED database that uses tax data to better inform employment
numbers, and literature that further helped us understand environmental
values
NZIER report – Plantation forestry statistics iii• Engaged with the industry, government and other stakeholders to further
understand industry detail and economic behaviour.
Plantation forestry connections
Source: NZIER
NZIER report – Plantation forestry statistics ivSummary of the economic, social and environmental impacts of
plantation forestry
2015
Per year ($ millions)
Forestry and logging contribution to GDP 1,389 m
Forestry and logging: Selected GDP contribution of regions
Northland 138 m
Waikato 280 m
Bay of Plenty 184 m
Gisborne district 96 m
Hawkes’ Bay 100 m
Tasman / Nelson 114 m
Otago / Southland 120 m
Numbers directly involved in forestry and logging 9,500
Transport 2,000
Port service workers 900+
Seasonal workers Small
Environmental and recreational values1
Ohiwa3 est. Conservative
extended over estimate
NZ
Overall eco-system services estimate2 9,600 m 1,900 m
Nutrient value (Taupo study) 5,800 m
Energy saved by recycling resins and waste (value added) 789 m
Value of carbon capture (conservative) 300 m
Reduced soil erosion benefit 208 m
Water quantity/ flow net benefit4 14 m
Water quality benefit 420 m
Biodiversity benefit Only localised studies, no
national figures
Recreation (only localised studies but visitor numbers suggest at least 1 $40 m
million visitors per year)
Relative externality value comparison5 Dairy Forestry
-18 m 31 m
Note (1) See environmental sections (Appendix J and K) for explanation of estimates. (2) The overall national
figures for eco-system services are based site specific examples. (3) Yao RT & Velarde SJ (2014) Ecosystem
services in the Ohiwa catchment; Report to Bay of Plenty Regional Council, Scion. (4) See section J.3.2: Water
quantity and flow moderation for explanation of net benefits. (5) Monge et al 2015, Scion. A relative
externality value shows the impact of different industry’s activity on society measured in comparable terms.
Monge et al (2015) is a study of 26,000 hectares of dairy land and the equivalent amount of forestry land in
the central North Island
Source: NZIER
NZIER report – Plantation forestry statistics vContents
1. Forestry industry summary .................................................................................... 1
2. The brief ................................................................................................................. 3
3. Forestry is different from other land-based industries ......................................... 4
3.1. Non-market valuation .................................................................................. 6
4. Project organisation ............................................................................................... 8
5. Conclusion ............................................................................................................ 10
Appendices
Appendix A Government policy ................................................................................... 11
Appendix B Market values ........................................................................................... 14
Appendix C Number of forest owners ......................................................................... 31
Appendix D Employment ............................................................................................. 32
Appendix E Temporary overseas workers ................................................................... 35
Appendix F Portable sawmills ...................................................................................... 36
Appendix G Forestry rotations..................................................................................... 37
Appendix H Components of the value chain ............................................................... 39
Appendix I Contribution to GDP .................................................................................. 49
Appendix J Environmental values ................................................................................ 56
Appendix K Environmental studies .............................................................................. 71
Appendix L The aim: A Forestry Satellite Account ....................................................... 72
Figures
Figure 1 Summary ........................................................................................................................ 1
Figure 2 Exports of selected forestry products............................................................................ 5
Figure 3 New forest plantings 1920-2016 ................................................................................... 5
Figure 4 Adjusted forest owners by size class, 2015 ................................................................... 6
Figure 5 Framework for collecting forestry statistics .................................................................. 8
Figure 6 Land use ....................................................................................................................... 14
Figure 7 Connections between industries in the forestry sector .............................................. 15
Figure 8 Export-domestic split ................................................................................................... 17
Figure 9 The rise in forestry exports .......................................................................................... 18
Figure 10 Exports of wood products by destination.................................................................. 19
Figure 11 Domestic production and consumption of sawn timber ........................................... 21
Figure 12 Value of building consents ......................................................................................... 21
Figure 13 Newsprint, writing paper, and other paper & paperboard ....................................... 23
Figure 14 Total pulp production, New Zealand consumpution, exports, and Imports.............. 24
Figure 15 Veneer, plywood, veneer lumber, particleboard, and fibreboard ............................ 28
Figure 16 Installed Capacity of Heat Plant by Fuel Type............................................................ 30
NZIER report – Plantation forestry statistics viFigure 16 Numbers employed in the plantation/forestry industry ........................................... 33 Figure 17 Location of forestry jobs ............................................................................................ 34 Figure 18 Movements in the costs of harvesting equipment .................................................... 39 Figure 19 Labour costs ............................................................................................................... 40 Figure 20 Real transport costs ................................................................................................... 41 Figure 21 Real Log price trends ................................................................................................. 43 Figure 22 Stumpage values adjusted for transport and site costs (from port or mill) .............. 45 Figure 23 Silviculture and planting labour costs ........................................................................ 46 Figure 24 Equipment required for planting and maintenance .................................................. 47 Figure 25 Establishment equipment .......................................................................................... 48 Figure 26 Pruning equipment .................................................................................................... 48 Figure 27 Contribution of forestry to GDP ................................................................................ 50 Figure 28 GDP comparison ........................................................................................................ 50 Figure 29 Contribution of forestry to regional GDP .................................................................. 51 Figure 30 Share of forestry in GDP ............................................................................................ 52 Figure 31 Comparison of foresty and logging to other land users’ GDP................................... 54 Figure 32 Regional comparison between beef and forestry ..................................................... 54 Figure 33 Regional comparison between sheepmeat and forestry ........................................... 55 Figure 34 Definition of ecosystem services ............................................................................... 56 Tables Table 1 Value of ecosystem services from the Ohiwa catchment ............................................... 7 Table 2 Ranking of selected economically valuable plants........................................................ 17 Table 3 Volume of sawn timber and logs exported by port ...................................................... 19 Table 4 Types, quality, and costs of different types of firewood .............................................. 28 Table 5 Summary of production ................................................................................................ 29 Table 6 Breakdown of forest owners......................................................................................... 31 Table 7 Triangulation of employment data ............................................................................... 33 Table 8 National rotation profile ............................................................................................... 38 Table 9 Current harvesting equipment costs ............................................................................ 40 Table 10 Labour costs ................................................................................................................ 41 Table 11 Indication of roading costs .......................................................................................... 42 Table 12 Current labour costs ................................................................................................... 46 Table 13 Contribution of forestry to regional GDP .................................................................... 53 Table 14 Relative externality value of forest and dairying ........................................................ 59 Table 15 Selection of estimates of forest recreation values ..................................................... 66 Table 16 Forestry benefits ......................................................................................................... 68 NZIER report – Plantation forestry statistics vii
1. Forestry industry summary
Figure 1 Summary

   National economic contribution
   National GDP                   Exports                       Domestic sales               Employment
   Forestry & logging             Forestry products
   contribute                     exports total                                                 9,500
   $1.39b                           $4.8b                                                       FTEs
   to national GDP.               Forestry products are         Logs and sawn timber         are employed in the
                                  the second largest            are the main forestry        forestry sector.
       Plus a further             commodity export after        products domestically.                             Truck
                                  dairy products.               Domestic sales are           + 2,000               drivers
       $2.16m
                                  Australia and China are       mainly tied to local
       in downstream                                                                                            Port services
       activity.
                                  the main destinations.        construction activity.         + 900              workers

   Regional economic contribution
   Regional GDP                           Regional importance                   Regional
                                          of forestry                           employment
   Four regions (Waikato,
   Bay of Plenty, Northland               Based on its share of
   and Nelson/Tasman)                     regional GDP, forestry has
   contribute over 50% of                 the greatest significance
   national forestry GDP.                 to these regions:
                                          Region            Share of region’s
                          Waikato
                                                                  GDP

                                          Gisborne          > 5%
   (Rest of                               Tasman/Nelson
      NZ)
                                    BoP
                                          Northland
                                          Marlborough
                                                            > 1-4%
                                          West Coast
                              Northland
              Nelson/Tasman
                                                                                Source: Statistics NZ & NZIER

   Central and local government
                                                                                          LGNZ              FENZ
   No single entity has control over all of forestry policy
                                                                                 Scion            Heritage NZ
                                                                         MPI              NES               NZTA
                                                                     MfE             MBIE               PGP
                                                                         DoC         WorkSafe               ETS

   Central government and local government                           Responsibility for government policy in forestry is
   develop the institutional setting (the                            spread over a number of government departments
   regulatory environment).                                          with no all-embracing national forestry policy.

Source: NZIER, icons8.com

NZIER report – Plantation forestry statistics                                                                                   1
Industry characteristics
Role of forestry Number of Seasonal workers
managers forest owners
H&S There are approximately
The majority of forest managers
have robust health and safety
standards because of the
15,000 Finding workers for
silviculture & planting is
accountability of managers to forest owners in New increasingly difficult. The
owners, increased mechanisation, Zealand with forests of 5 ha outlook for seasonal workers
training, and operational or greater may become increasingly
transparency. important to the industry.
Forestry Employment Stumpage
rotations numbers values
ls
ova
Rem
Employment
New Zealand forests have not
declined in yield past the 2nd Removals are increasing and Stumpage values remain
rotation; they have gained in employment is static. flat.
productivity through better genetic
selection and better management.
Environmental values are important
Waste Carbon capture Land stabilisation
and water quality
Sawdust is used to fuel sawmills. Sequestering carbon through forestry
is one way to assist in meeting our
climate change agreement targets.
Recreation & tourism Habitat
Forests in general can
also create value or
save costs by providing
soil stability, reducing
erosion and run-off
into streams.
Recreational uses of plantation Plantation forestry blocks provide
forestry blocks includes users habitat for native species and
walking, mountain biking, horse support local biodiversity.
riding, trail biking, hunting and
fishing.
Source: NZIER, icons8.com
NZIER report – Plantation forestry statistics 22. The brief
This report has been commissioned by the New Zealand Forest Owners Association
and New Zealand Farm Forestry Association funded by the Forestry Growers Levy Trust
Inc. These entities are looking to facilitate a better understanding of the role of forestry
in the New Zealand economy, environment, and society.
Our main focus is on the planting, silviculture, and harvesting that occurs on site.
However, we do examine some of the ancillary services such as logging trucks, port
service workers, and refer to processing, exporting, the domestic market and its
economic contribution.
This report sets out the data available and approaches that can be potentially taken to
systematically collect data and to illustrate forestry’s economic potential and facilitate
further understanding (e.g. environmental statistics).
Where statistics are not well described (e.g. forestry employment), we have focused
on examining different approaches that can be used to obtain estimates (using the
principle of triangulation). By triangulation we mean using two or more methods to
estimate data points in a particular area.
Our examination has been to:
• Briefly survey the existing situation
• Set out the framework for identifying the areas where data should be collected
• Describe our approach to collecting data and estimating contribution to the
economy
• Conclude with some final remarks.
The study consolidates the information gathered into a useable format: we have
included forestry’s direct contribution as well as the indirect effects. The latter would
involve looking at the forest sector’s contribution to the demand for goods and
services of other industries such as transport, and the flow on effects to other sectors
such as wood processing, retail and newsprint.
The direct and indirect contributions are measured and highlighted as summary
indicators such as output, value added, employment, wages, payments to capital and
land, and taxes. There are also a number of important functions forestry performs that
may or may not go through markets (the non-market valuations).
NZIER report – Plantation forestry statistics 33. Forestry is different from
other land-based industries
The forestry (growing the trees) and logging (harvesting the trees) sector is an integral
part of New Zealand’s economy, environment, and society. Therefore, it is important
for the industry to properly reflect the industry’s social and economic value through
up-to-date and transparent data and context.
As a completely different industry from any other land-based industry it is also
important to reflect its complete contribution to the New Zealand economy and
society, particularly given its positive environmental impact.
Forestry statistics represent a challenge given the biological processes are quite
different from other land-based industries e.g.:
• It takes between 25 and 35 years before harvesting occurs requiring long
term planning (longer for Douglass-Fir, Cypresses etc.)
• Harvesting presents challenges and costs that other industries do not face
(e.g. first rotation forests on hill country might require large road networks
to be built)
• There are positive environmental benefits such as carbon capture,
biodiversity gains, high water quality, land stability and recreational options
from commercial forests.
The Ministry for Primary Industries (MPI) sets out the parameters for forestry in the
“National Exotic Forest Description”. Key facts (p2) from that publication include:
• New Zealand’s net stocked planted production forests covered an
estimated 1.70 million hectares as at 1 April 2016
• The total planted forest standing volume is estimated to be 503 million
cubic metres with an average forest stand age (area weighted) of 17.1 years
• As at 1 April 2016, New Zealand’s net stocked forest area has decreased by
13,000 hectares from 1 April 2015
• Harvested areas awaiting either replanting or a land use decision decreased
by 3,000 hectares in the year to 1 April 2016.
The forestry industry’s importance to economic activity is highlighted in Figure 2 of
selected forestry exports.
NZIER report – Plantation forestry statistics 4Figure 2 Exports of selected forestry products
Value, NZ$ 000s
6 000 000
Total
5 000 000
Logs
4 000 000 Sawn timber
3 000 000
2 000 000
1 000 000
1981
1983
1985
1987
1989
1991
1993
1995
1997
1999
2001
2003
2005
2007
2009
2011
2013
2015
Source: Ministry for Primary Industries and Statistics New Zealand
Figure 3 shows new planting in New Zealand has declined from a peak in the mid-1990s
to 3,000 hectares in 2015. Further plantings are dependent on:
• The profitability of selling logs
• Confidence in markets for all forestry products
• Confidence in future policy settings
• Further changes to the ETS scheme that favour New Zealand grown credits.4
Figure 3 New forest plantings 1920-2016
Source: National Exotic Forest Description, 2016 p5
Plantation forest sizes vary significantly. Further, we do not have a good statistical
handle on the ownership profile. Ministry for Primary Industries (MPI) statistics
4
There is some cause for optimism that as carbon credits rise in value the forestry planting supply response will also increase.
However, there is a large debate about how emissions are accounted for after the wood is harvested. Some in the forestry
industry would contend that the Government needs to give effect to the Harvested Wood Products emissions accounting to
replace the current assumption of instant oxidisation at harvest in the liability rules.
NZIER report – Plantation forestry statistics 5suggest that the majority of plantation forests are established on land holdings greater
than 500 hectares (approximately 72%, National Exotic Forestry Description 2015,
p25). The reverse is the case in relation to the numbers of owners. Approximately 89%
of forest owners in New Zealand own less than 500 hectares (see National Exotic Forest
Description 2015 p24).
However, these figures only represent larger known owners and are therefore biased
towards those who report their situation. The number of forest owners reported in
National Exotic Forest Description is 1,852 but the NEFD only surveys owners who hold
more than 50 hectares. Thus the NEFD has an inherent bias as it does not survey the
majority of the 15,000 forest owners estimated in Appendix C. Adding these numbers
into the equation results in the number of forest owners by class size changing
dramatically.
The number of forest owners with forests under 500 hectares rises to 98% when all
forest owners are taken into account.
Figure 4 Adjusted forest owners by size class, 2015
Assumes that all the unidentified forest owners have forests under 40 hectares
14000 13148
12000
10000
8000
6000
4000
2000 944
711 79 88 30
0Table 1 Value of ecosystem services from the Ohiwa catchment
Dollars per hectare
$ per hectare
Carbon sequestration/emission and greenhouse gas regulation using $4 per $48 5
New Zealand Unit
Avoided erosion and flood/disturbance regulation $121
Regulating nutrient supply by avoiding leaching $2,800
Pollination $206
Water regulation $6
Waste treatment $244
Pest and disease regulation/biological control $11
Water supply $8
Recreation $900
Species conservation $257
Nutrient cycling $994
Soil formation $14
Net ecosystem services value in dollars per hectare each year $5,609
Source: Source: Yao & Velarde, Scion (2014) 6
Such values, if applied to 1.72 million hectares of planted exotic forest in 2015, would
imply the generation of $9.6 billion per year in non-market benefits from forests in
addition to the marketed output of wood and pulp products and recovered energy.
However, a conservative approach should be taken in interpretation of these statistics.
The ecosystem services approach is still at the experimental stage, uses mixed
methods and is site specific and not able to be extrapolated or replicated across the
country as yet. But even if the national average were only 1/5th that of the Ohiwa
catchment in the Bay of Plenty ($1122 /ha/year), this would still amount to $1.9 billion
of non-market value annually.
However, some forestry participants are frustrated that the current reported statistics
do not fully reflect the importance of the industry in both economic and non-economic
terms, particularly around:
• Estimates of employment in the industry
• The importance of the non-economic benefits of forests to New Zealanders.
Forestry’s value is therefore understated. One of the reasons for this is that those
trying to gauge the importance of the industry can only see part of the value that
forestry is contributing.
5
Since mid-2016 the value of New Zealand Emission Units has been $15/tonne or more, which would make the value per
hectare $180 or greater.
6
Yao RT & Velarde SJ (2014) Ecosystem services in the Ohiwa catchment; Report to Bay of Plenty Regional Council, Scion
NZIER report – Plantation forestry statistics 74. Project organisation
NZIER have constructed a simple model to demonstrate the relationships between
forestry and the government, economy, society, and environment.
The model portrays a system of relationships which, although abstract, seeks to
capture the salient elements of the real world. Any real world problem will have a large
number of variables, often with complex, relationships between them. We wish to
draw out the main points without the complications of all the issues. In this way we
can focus on the issues that matter to the industry.
For example, one key advantage that the framework has is that it shows the positive
contribution that forestry makes to both market and non-market values in New
Zealand. Of particular importance, is the positive contribution forestry makes to the
environment. This is portrayed in the following framework for the industry where we
show the:
• Impact of central and local government control
• Domestic consumption and exports, employment, and economic activity
generated by forestry through planting, silviculture and harvesting
• Environmental and amenity benefits delivered by forestry.
Figure 5 Framework for collecting plantation forestry statistics
Local and central government
(controlling different aspects of forestry development)
Exports Economy
Domestic consumption (GDP)
Production Households
Owner wages
investment consumption
Waste
Energy Natural environment Amenity
Materials
Including
recovered
materials
Resources Ecology
Source: NZIER
NZIER report – Plantation forestry statistics 8Applying this approach, helps us to:
• Identify the important areas where we need to gather statistics
• Ensure that we cover the important activities of the forestry industry
• Demonstrate the interrelationships between economic and non-economic
activity.
The design of the approach has been deliberately kept simple. We have abstracted
from the detail of the physical and financial flows between the forestry industry and
the economic, social and environmental forces that it interacts with. This approach
allows us to capture and illustrate where available statistics “fit” within forestry activity
and how to think about the use of those statistics e.g. do they contribute towards GDP
calculations or other measures of value? And are they important? 7
The approach focuses on the interactions between the government, economy, and the
physical environment. Central and local government develop the institutional setting
(the regulatory environment). Investment, domestic processing, export supply etc. are
determined by firms through their interaction with households (e.g. through the
supply of labour and demand for outputs). From both the production process and
households, waste is generated with some of it recoverable (particularly in the
processing industry).
Also important is the interaction between the market activity and the physical
environment (e.g. households and the amenity, industry and the resource base, the
interaction between resources and ecology etc.).
In this project, we have captured and reported on the work that identifies the various
areas (amenity values and mountain biking, the role of forests in protecting flora and
fauna), and other interacts that are important.
7
It also allows us to understand where the gaps are in forestry statistics.
NZIER report – Plantation forestry statistics 95. Conclusion
To inform the statistical approach we ensured that:
• Where practicable the principle of data triangulation was used where there
is some question about its validity
• We engaged with policymakers prior to putting statistics together. In
particular, with Ministry for Primary Industries and Statistics New Zealand.
• We spoke to industry participants to further understand the issues around
forestry statistics.
We have set out to collect a comprehensive data set for forestry.
• Government policy (Appendix A)
• Market values: export and domestic (Appendix B)
• Number of forest owners (Appendix C)
• Employment (Appendix D)
• Seasonal overseas workers (Appendix E)
• Portable sawmills (Appendix F)
• Forestry rotations (Appendix G)
• Components of the value chain (Appendix H)
• Contribution to GDP: national and regional (Appendix I)
• Environmental values and studies (Appendices J and K)
• Potential satellite account (Appendix L).
The summary statistics are set out in the key facts section and the pictorial summary
statistics at the beginning of the document. All other statistics are in the appendices.
NZIER report – Plantation forestry statistics 10Appendix A Government policy
A.1 Most change has occurred to plantation forestry
management
New Zealand has large tracts of indigenous and plantation forests. Over time these
forests have provided many benefits for society, the environment and the economy.
Most of the indigenous forests are owned by government. The Crown owns 5.187
million hectares of indigenous forest or nearly 83% of the total indigenous forests in
New Zealand. The Department of Conservation manages this on behalf of the Crown.
Other indigenous forests are in private ownership or owned and controlled by Māori
entities.
Most of the changes in government forestry policy since the 1980s have related to
plantation forestry. At one time the government owned at least 50% of the plantation
forestry and large processing facilities. It has divested itself of its ownership of forests
to facilitate Treaty Settlements with iwi with wood processing now solely owned by
private sector companies. The current government has signalled to the sector that it
will attempt to sell down its remaining forests overtime, though climate change policy
imperatives could see that position change. 8
A.2 There is no one government entity responsible for
forestry
Responsibility for government policy in forestry is spread over a number of
government ministries and departments with no all-embracing national forestry
policy:
• This means needs of research, training, biosecurity, and policy advice are
being delivered by different parts of government
• There is a longstanding lack of recognition of the long term (positive)
consequences of forestry and the positive externalities generated by a long
term sustainable crop, especially compared to Switzerland, Germany and
elsewhere in Western Europe i.e. the prices received for forestry products
do not reflect its positive contribution it makes to society, particularly the
positive environmental impact.
The Ministry for Primary Industries (MPI) and its predecessor MAF, have over the past
decade, largely focused on the role of planted forests in relation to climate change,
and to a lesser extent the institutional relationships creating blockages to innovation
within the sector. MPI initiatives include a limited afforestation grant scheme, Primary
Growth Partnership projects for steepland harvesting and Methyl Bromide control and
recapture at ports for export logs, a proposed National Environmental Standard for
Plantation forestry (RMA), erosion control funds, biosecurity control, wilding pines etc.
8
Conversation with Forestry Owners Association (FOA).
NZIER report – Plantation forestry statistics 11A.2.1 Carbon capture is likely to become more significant
The Ministry for the Environment’s primary focus on plantation forests relates to
carbon sequestration and emissions the NZ ETS. Currently, the ETS covers land use
change (deforestation in pre-1990 forests, driven largely by dairy conversions),
afforestation, transport and energy (42% of total 2012 emissions), industry (7% of total
2012 emissions) and waste (5% of total 2012 emissions) but not agriculture (46% of
2012 total emissions, and rising).
In October 2016, the government ratified the Paris Agreement that aims to limit global
warming “well below” 2 degrees Celsius, and possibly below 1.5 degrees Celsius, by
2100, as part of an ultimate global commitment to go to Net Zero emissions.
New Zealand will now have to develop a plan that reduces emissions to 30 percent
below 2005 levels by 2030. Sequestering carbon through forestry is likely to be part of
this strategy. A possible increase in the carbon price could help this process (i.e. MfE’s
lead policy official Kay Harrison has signalled price projections of NZ$50 to $300/t). 9
Forestry has a positive role to play in New Zealand’s approach to a carbon policy. How
to date, the government has been slow to partner with the industry to ensure the best
outcomes for New Zealand.
A.2.2 The challenges of biosecurity and GMOs
Biosecurity is an issue for some forestry stakeholders because of the risks of a
biosecurity breach allowing in pine pitch canker or other defoliation disease that
impacts Pinus radiata.
One possible solution to this issue is the use of gene editing (CRISPR technology) or
other genetic modification technique. Innovation in Biotechnology could see:
• Improved uniformity and wood properties
• Potentially shorter rotations
• Increased genetic resistance to pests and pathogens 10
• Prevention of wilding spread from any new stands (through deployment of
sterile clones).
However, there is considerable resistance within New Zealand to growing GMO crops.
It will require significant consultation with the public to arrive at a situation that is
supported by the majority of New Zealanders.
A.2.3 Science and innovation will be crucial
The Ministry for Business, Innovation and Employment’s (MBIE) involvement in the
forestry sector is primarily concerned with funding research. A recent project made $5
million available for research into developing a broader range of high value wood
products from different species of trees.
The CRI Scion and its connections with the forest producing sector has is important in
highlighting the value of forestry in the primary sector landscape & economy. Scion
9
www.radionz.co.nz/news/national/316003/nz's-greenhouse-gas-bill-could-top-$70-billion
www.carbonnews.co.nz/tag.asp?tag=Carbon+prices
10
See http://woodco.org.nz/images/Woodco_BiotechnologyPositionStatement_101116_public.pdf
NZIER report – Plantation forestry statistics 12are funded mainly by government to underpin, protect, and future-proof the forestry
industry in New Zealand. Its research spans forestry management and tree
improvement, biosecurity and risk management, wood processing, and forest-based
ecosystem services.
A.2.4 Health and safety focus
A big recent challenges which will escalate over the next ten to twenty years is to
improve health and safety standards, especially amongst some of the smaller players
who will make up an increasing large part of the harvesting industry.
This is compounded by the potential for general rural earthwortks contractors to enter
the forest industry as the demand for harvesting contractors ramps up. The ease of
entry means that extra effort will be required to ensure that good health and safety
levels are met and maintained.
The forestry industry is heavily involved in safety initiatives. The Forestry Industry
Safety Council (FISC) is responsible for the Independent Forestry Safety Review (IFSR).
The role of FISC is to document, evaluate and share forestry safety initiatives across
the sector. By engaging with the industry in this way they can constructively assist
government as a health and safety partner.
Most contractors and corporate forest owners have robust health and safety standards
because of the accountability of managers as PCBUs under NZ’s 2015 H&S at Work Act,
increased mechanisation, training, and operational transparency.
Worksafe NZ provides educational material, 11 codes of practice, assessments,
monitoring and enforcement. It also provides regulation and investigations of health
and safety system failures. Worksafe has a focus on forestry because of the historical
high rates of serious injuries and fatalities, the physical nature of the work, steep
terrain, and the use of specialist heavy machinery including cable log extraction
(hauling) systems.
11
This includes educating duty holders about their work health and safety responsibilities (e.g. through guidance)
http://www.worksafe.govt.nz/worksafe/about
NZIER report – Plantation forestry statistics 13Appendix B Market values
Forestry is a substantial part of the New Zealand economy and in recent years the
second largest commodity export after dairy. 12 Most commercial forestry use exotic
tree species which are relatively fast growing in the New Zealand environment and
yielding a range of wood qualities for use in sawn timber production, reconstituted
panel products, pulp and paper manufacture.
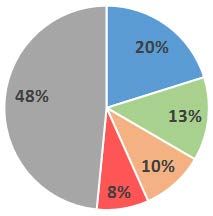
Figure 6 below sets out New Zealand land use. Plantation forests use 1.8 million
hectares of land (7%).
Figure 6 Land use
2016
7%
29%
40%
24%
Plantation forest Pasture & arable Other non forested land Natural forest
Source: Forestry Facts and Figures (2015/16), New Zealand Forest Owners Association
Pinus radiata is the predominant species grown in plantation forestry in New Zealand,
currently accounting for about 90% of planted area, 93% of harvested volume and 94%
of exports by value.
Douglas-fir is the second most important species with about 6% of planted area and
4% of annual harvested volume.
The remainder of exotic forests comprise California Redwoods, Eucalyptus, Cupressus
and other “minor” or special purpose species. A part from Douglas fir, minor species
face quite different marketing chain challenges in both growth and use, as described
below.
12
That is, if you split beef and veal and sheepmeat and wool into separate categories.
NZIER report – Plantation forestry statistics 14B.1 Economic connections of forestry
Forestry in the national accounts comprise forestry and logging, wood products and
pulp and paper manufacture. The connections between these and other parts of the
value chain are outlined in Figure 7 below.
Figure 7 Connections between industries in the forestry sector
Resource base Forest planting Standing forest Carbon Forestry
& management value sequestration tourism
FORESTRY &
LOGGING Export
Harvesting markets
Logs
Residues
1st stage Export
processing Sawmilling markets
Export
WOOD Panel
markets
PRODUCTS production
MANUFACTURE Energy
Pulping
recovery Export
markets
Paper
manufacture Export
markets
2nd stage Exterior/int. Furniture
PULP & PAPER processing building prods makers Printers &
MANUFACTURE
publishers
Distribution Export
Wholesalers markets
Retailers
End users
Builders, DIYers,
contractors ... customers
Source: NZIER
Forestry and logging covers the management of the resource base – the planting and
management of plantation forests – and harvesting.
First stage processing includes the New Zealand wood processing and manufacturing
industry, which produces sawn timber, veneers, plywood and reconstituted panels
such as fibreboards, and the pulp and paper manufacturing industry.
Second stage processing involves industries whose products have more specific wood
components, including hygiene products and composite building materials for the
construction industries. Furniture making, printing and publishing (other than online
and electronic media publishers) are very minor end uses for New Zealand grown wood
fibre.
The term ‘forestry’ is commonly applied only to forestry, logging and first stage
processing, in which forest products (wood-fibre) comprises 25% or more of the value
of inputs (according to Statistics New Zealand’s Input-Output tables). In second stage
NZIER report – Plantation forestry statistics 15processing, non-wood inputs comprise more than 80% of total input value, and more
substitutes exist for wood-fibre (e.g. steel framing in building, metal or plastic
furniture, or cement and wood pulp composite wall cladding or cardboard wrapped
plaster board interior wall linings) so the share of economic value added attributable
to wood or tree species is lower than in first stage processing.
Figure 7 above also shows that the wholesale and retail trade and transport operators
are involved in the distribution of forest products to domestic and export markets. If
these services are specialised to distributing forest products, they would face a short
term loss of revenue in the event of disruption of the wood harvest. But such services
as building supplies wholesaling and retailing often trade in more than just forest
products, and in the longer term, resources in these distribution services would be
redeployed to other things, so they are less directly part of the value at risk from
threats to forestry activity.
Other features to note from Figure 7 are:
• While the main material flow between forestry-related parts of the value
chain is of logs from harvest to wood processing and pulping, there are also
large flows of residues from both harvesting and sawmilling activities that
are collected and provide inputs to reconstituted wood products (e.g. MDF
panels and chip board flooring) and wood pulp manufacture
• Residues are also used to provide heat and power to parts of the
manufacturing process, particularly in pulp making and timber drying,
providing value savings in the cost of energy. In the South Island, wood fibre
is also used as a feedstock for bioenergy production i.e. wood pellets for
domestic home heating and wood chips for commercial and industrial
heating 13
• There is limited commercial value in standing forests in their role as the
setting for forest-based recreation and tourism
• There is a role for plantation forests to foster biodiversity as a home for
kiwi, falcon, karearea, kokako and other native birds, skinks, frogs, native
fish bats, plants, and invertebrates
• There is potential value to be gained by storage of carbon under New
Zealand’s greenhouse gas accounting system (but also matching emissions
liability under the NZ ETS).
The harvesting of trees seldom impacts domestic recreation and tourism since in
forests such as Woodhill, Bottle Lake and Naseby the clubs or concessionaires are
generally able to move their operations. However, it does have an impact on carbon
storage and biodiversity, at least in the short term until forest growth recovers.
In economic terms an estimate of the contribution that forestry makes is set out in
Table 2.
These figures are based on preliminary estimates (for biosecurity purposes) of
economically valuable plants. 14 While the NZIER estimates are only approximate, 15 and
13
The wood processing industry has long utilised bio-energy for a good portion of its energy needs.
14
This is an initial examination of the impact of selected economically valuable plants. At this stage it does not include native
plants.
15
Relatively simple approaches to estimates for GDP contribution were produced because of costs (therefore estimates are
only approximate).
NZIER report – Plantation forestry statistics 16have been devised for ranking purposes only, they do point to the importance of
plantation forestry products.
Table 2 Ranking of selected economically valuable plants
2012 base year, $ M
Ranking Plant Estimate (including
dependent industry)
1 Rye grass 14,000 – 15,000 million
2 Pinus radiata 3,500 – 4,500 million
12 Douglas-fir 150 – 200 million
23 Eucalyptus 30 – 50 million
31 Cypress 15 – 25 million
Source: NZIER (2016) How valuable is that plant? Working paper for the Ministry for Primary
Industries
Further the split between domestic and export forestry products is set out in Figure 8.
The domestic wood products market is a significant part of New Zealand’s economic
activity, even without taking into account domestic and overseas tourism, recreational
activities, and the contribution of eco system services.
Figure 8 Export-domestic split
June year 2016
Logs (000m3)
Wood chips (000 BDU)
Sawn timber (000m3)
Chemical pulp (tonnes)
Mechanical pulp (tonnes)
Other paper & paperboard (tonnes)
Fibreboard (m3)
Plywood (m3)
Veneer (m3)
0% 20% 40% 60% 80% 100%
Export Domestic
Note that wood chips do not include MDF, wood chips used in energy production or wood chips used in
sheds, particularly for over-wintering dairy cattle. Further it does not include woodchips generated in
sawmills that are mainly used domestically in pulp and fibreboard production.
Source: Forestry Facts and Figures (2015/16), New Zealand Forest Owners Association
NZIER report – Plantation forestry statistics 17B.1.1 Non-market considerations
Plantation forests can also create value or save costs by providing soil stability,
reducing erosion and run-off into streams, and moderating water flows, but these
effects are often experienced as externalities that do not provide commercial return
to those who own the forests.
B.2 Exports
The data comes from Statistics New Zealand (SNZ). We have good data on all products 16
that cross the New Zealand border. Forestry exports have risen from below $2 billion
in 1990 (inflation adjusted) to nearly $5 billion in 2015 (see Figure 9). The rise in value
has been production-led driven by plantings in the early to late 1980s. MPI expect that
forestry value will reach $6,000 million by 2020.
Figure 9 The rise in forestry exports
6
5
4
$ Billions
3
2
1
0
1989
1991
1993
1995
1997
1999
2001
2003
2005
2007
2009
2011
2013
2015
Source: Statistics New Zealand
B.2.1 Export destinations
The plantings of the late 1980s and early 1990s coincided with the integration of China
on to world markets. A sustained infrastructure boom in China has created a maturing
demand for logs. Demand from other markets has remained steady.
The importance of China is set out in Figure 10. Roughly 80% of the exports are logs.
Australia and Japan take a wider range of wood products (logs, lumber, wood pulp,
paper & paperboard, and panel products). The Republic of Korea has a similar, but
much smaller, importing profile to China.
16
The information on services is less clear.
NZIER report – Plantation forestry statistics 18Figure 10 Exports of wood products by destination
December years, NZ$
2,500,000
2,000,000
1,500,000
1,000,000
500,000
-
2013 2014 2015
Source: Forestry Facts and Figures (2015/16), New Zealand Forest Owners Association
Most of the forestry exports are channelled through ports on the east coast of the
North Island. Three ports (Whangarei, Tauranga, and Gisborne) export 63% of all sawn
timber and log exports. Without forestry exports the Gisborne port would not be
viable.
Table 3 Volume of sawn timber and logs exported by port
Quantity m3
Sawn timber Logs Share of sawn timber
& log exports
Whangarei 10,182 2,613,742 15%
Auckland 198,896 122,602 2%
Tauranga 837,189 5,158,739 35%
Gisborne 279 2,167,697 13%
New Plymouth - 280,692 2%
Napier 322,048 1,012,167 8%
Wellington 2,173 930,446 5%
Nelson 114,284 559,081 4%
Picton 1,561 665,150 4%
Christchurch 132,805 421,320 3%
Timaru 537 258,958 2%
Dunedin 73,328 773,555 5%
Invercargill 93,721 431,486 3%
Source: Forestry Facts and Figures (2015/16), New Zealand Forest Owners Association
NZIER report – Plantation forestry statistics 19B.2.2 Domestic consumption of forestry products
Understanding the markets associated with domestic activity is much more difficult.
Products that do not cross a border are typically not as well tracked.
The fiercely competitive nature of the domestic market also means that information is
tightly held by companies involved in the trade e.g. BRANZ does a quarterly survey that
indicates approximately the breakdown between steel framing (6%) and wood framing
(94%) for houses. 17 However, apartment buildings are more likely to favour concrete
or steel framing.18
We expect further pressure in this market as smaller incumbents feel increased
economic pressure because of their lack of scale.
Sawn timber
The past few years have seen an increase in domestic consumption of sawn timber.
Per capita consumption of wood has remained flat, although New Zealand experienced
40% population growth since 1990.
Further, the total production of sawn timber has also remained flat since 2011, despite
a decline in exports. Domestic production of sawn timber has increased at the expense
of export sawn timber.
The sharp dip in sawn timber production in 2009/10 followed the GFC and coincided
with a reduction in demand for sawn timber from New Zealand and abroad, but an
increase in export log prices.
Total sawn timber production is approximately 4.0 million cubic metres with 2.3 million
cubic metres domestically consumed. This is a dramatic increase from 2011 where
approximately 1.7 million cubic metres was consumed domestically. The main reason
for this has been the huge growth in demand from:
• Christchurch because of the post-earthquake construction boom
• Housing demand, mainly in Auckland due to increased population
pressures.
17
Pers. Comm. Ian Page, BRANZ. 16th February 2017.
18
The article referenced in this footnote sets out what we know about the battle between wood and steel framing.
http://www.stuff.co.nz/dominion-post/business/residential-property/9435020/The-battle-between-steel-and-wood
NZIER report – Plantation forestry statistics 20You can also read