The impact of policies, regulation, and institutions on ICT sector performance - ITUPublications
←
→
Page content transcription
If your browser does not render page correctly, please read the page content below
ITUPublications      International Telecommunication Union

    The impact of policies,
    regulation, and institutions
    on ICT sector performance
The impact of policies,
regulation, and institutions
on ICT sector performance
This report has been prepared for the International Telecommunication Union (ITU) led by the ITU Telecommunication Development Bureau (BDT) Regulatory and Market Environment Division (RME) and the ITU Regional Office for Asia and the Pacific. Raúl Katz - PhD Management Science and Political Science, and MS Communications Technology and Policy - Massachusetts Institute of Technology, Maîtrise and Licence - Communications Sciences, University of Paris, Maîtrise, Political Science - University of Paris-Sorbonne. Dr. Katz is currently Director of Business Strategy Research at the Columbia Institute for Tele-Information, Visiting Professor at the Universidad de San Andrés (Argentina) and President of Telecom Advisory Services, LLC (URL: www.teleadvs.com). Before founding Telecom Advisory Services, he worked for twenty years at Booz Allen Hamilton, where he was the Head of the Telecommunications Practice in North and Latin America and a member of the firm’s Leadership Team. Juan Jung – PhD and MA Economics - University of Barcelona, and BA in Economics - Universidad de la República (Uruguay). Dr. Jung specializes in econometrics and statistical analysis of telecommunications. In addition to Senior Economist at Telecom Advisory Services LLC, he is professor of microeconomics at the Universidad Complutense de Madrid. Before joining the firm, Dr. Jung was Director of Public Policy in the Interamerican Association of Telecommunications Companies and Director of the Center for Latin American Telecommunications Studies. DISCLAIMER: The designations employed and the presentation of the material in this publication do not imply the expression of any opinion whatsoever on the part of ITU and of the Secretariat of the ITU concerning the legal status of any country, territory, city or area or of its authorities, or concerning the delimitation of its frontiers or boundaries. The mention of specific companies or of certain manufacturers’ products does not imply that they are endorsed or recommended by ITU in preference to others of a similar nature that are not mentioned. Errors and omissions excepted, the names of proprietary products are distinguished by initial capital letters. All reasonable precautions have been taken by ITU to verify the information contained in this publication. However, the published material is being distributed without warranty of any kind, either expressed or implied. The responsibility for the interpretation and use of the material lies with the reader. The opinions, findings and conclusions expressed in this publication do not necessarily reflect the views of ITU or its membership.
ISBN:

978-92-61-33031-6 (Paper version)
978-92-61-33041-5 (Electronic version)
978-92-61-33051-4 (EPUB version)
978-92-61-33061-3 (Mobi version)

                     Please consider the environment before printing this report.

                                                  © ITU 2021

Some rights reserved. This work is licensed to the public through a Creative Commons Attribution-Non-
Commercial-Share Alike 3.0 IGO license (CC BY-NC-SA 3.0 IGO).

Under the terms of this licence, you may copy, redistribute and adapt the work for non-commercial purposes,
provided the work is appropriately cited. In any use of this work, there should be no suggestion that ITU
endorse any specific organization, products or services. The unauthorized use of the ITU names or logos is
not permitted. If you adapt the work, then you must license your work under the same or equivalent Creative
Commons licence. If you create a translation of this work, you should add the following disclaimer along
with the suggested citation: “This translation was not created by the International Telecommunication Union
(ITU). ITU is not responsible for the content or accuracy of this translation. The original English edition shall
be the binding and authentic edition”. For more information, please visit https://creativecommons.org/
licenses/by-nc-sa/3.0/igo/
Table of Contents
List of tables, figures and boxes��������������������������������������������������������������������������������������������������������v
Executive summary���������������������������������������������������������������������������������������������������������������������������vii
1. Introduction�������������������������������������������������������������������������������������������������������������������������������� 1
2. Model to assess the impact of the policy context on market outcomes��������������������������� 2
2.1. Research review�������������������������������������������������������������������������������������������������������������� 2
2.2. A causal model to frame the impact of policy and institutional factors
on ICT sector performance ����������������������������������������������������������������������������������������������������� 3
3. Key drivers of fixed and mobile telecommunication investment �������������������������������������� 5
4. Drivers of performance and impact of mobile telecommunications�������������������������������� 9
5. Conclusions������������������������������������������������������������������������������������������������������������������������������16
Appendices���������������������������������������������������������������������������������������������������������������������������������������18
A. Research literature review������������������������������������������������������������������������������������������������������18
A.1 A causal framework������������������������������������������������������������������������������������������������������18
A.2 System dynamics influencing the causal framework�����������������������������������������������42
A.3 Transborder effects������������������������������������������������������������������������������������������������������44
A.4 Difference between advanced economies and developing countries����������������45
B. Countries included in the empirical analysis�����������������������������������������������������������������������46
C. Variables for the empirical analysis���������������������������������������������������������������������������������������47
D. Empirical methodology����������������������������������������������������������������������������������������������������������50
D.1 Model specification������������������������������������������������������������������������������������������������������50
D.2 Empirical strategy ��������������������������������������������������������������������������������������������������������52
E. Detailed estimation results����������������������������������������������������������������������������������������������������53
E.1 Estimation of investment equation for the combined fixed and mobile
sectors���������������������������������������������������������������������������������������������������������������������������������������53
E.2 Estimation of the complete structural model for the mobile segment����������������59
Bibliography��������������������������������������������������������������������������������������������������������������������������������������74
ivList of tables, figures and boxes
Tables
Table A: At a glance headlines from the report���������������������������������������������������������������������ix
Table 1: Econometric model equations���������������������������������������������������������������������������������� 4
Table C.1: Pillars of the ITU ICT Regulatory Tracker������������������������������������������������������������ 47
Table C.2: Other variables for the empirical analysis����������������������������������������������������������� 48
Table E.1: Overall sector: two-step GMM estimation results ��������������������������������������������� 54
Table E.2: Overall sector: two-step GMM estimation results ��������������������������������������������� 57
Table E.3: Overall sector: two-step GMM estimation results ��������������������������������������������� 58
Table E.4: Mobile sector: two-step GMM estimation results���������������������������������������������� 61
Table E.5: Mobile sector: IV-LIML estimation results ���������������������������������������������������������� 63
Table E.6: Mobile sector: IV-LIML estimation results ���������������������������������������������������������� 64
Table E.7: Mobile sector: IV-LIML estimation results ���������������������������������������������������������� 65
Table E.8: Mobile broadband impact on GDP per capita�������������������������������������������������� 67
Table E.9: Policy simulation effects: National broadband plan����������������������������������������� 68
Table E.10: Policy simulation effects: implementing convergent licences����������������������� 69
Table E.11: Policy simulation effects: spectrum sharing allowed�������������������������������������� 70
Table E.12: Policy simulation effects: mobile portability����������������������������������������������������� 71
Table E.13: Policy simulation effects: openness to foreign operators������������������������������ 72
Table E.14: Policy simulation effects: National competition authority������������������������������ 73
Figures
Figure A: Dynamic economic gains after a policy reform in period t��������������������������������viii
Figure 1: Overall model by considering causality flows�������������������������������������������������������� 3
Figure 2: Model equations in the context of the overall causality flows����������������������������� 5
Figure 3: Impact on telecommunication capital investment after an increase of
10% in the respective sub-index (contemporaneous effect)������������������������������������������������ 6
Figure 4: Impact on telecommunication capital investment after an increase of
10% in complementary drivers (contemporaneous effect)��������������������������������������������������� 7
Figure 5: Simulations of variables impact on telecommunication capital
investment (contemporaneous effect)������������������������������������������������������������������������������������� 8
Figure 6: Mobile CAPEX improvement after a simulated policy reform
(contemporaneous effect)�������������������������������������������������������������������������������������������������������� 10
Figure 7: Mobile CAPEX and the optimal concentration level������������������������������������������� 12
Figure 8: Mobile network coverage increase after simulated policy reforms������������������ 13
Figure 9: Price reduction after simulated policy reforms���������������������������������������������������� 14
Figure 10: Increase in mobile penetration after simulated policy reforms���������������������� 15
Figure 11: Dynamic economic gains after a policy reform implemented in period t����� 15
Figure 12: Cumulative GDP per capita evolution after simulated policy
reforms (base period t=100)��������������������������������������������������������������������������������������������������� 16
vFigure A.1: ICT policies and sector market outcomes��������������������������������������������������������� 19
Figure A.2: ICT policies and sectoral outcomes – causality links��������������������������������������� 19
Figure A.3: United States of America: Relation between the Herfindahl-
Hirschman Index and the Price of a mobile minute (2000-2015)�������������������������������������� 23
Figure A.4: HHI and 4G coverage correlation in Latin America (2018)���������������������������� 26
Figure A.5: Mobile CAPEX and ARPU������������������������������������������������������������������������������������ 27
Figure A.6: Virtuous circle of tax reduction on broadband devices, equipment
and services�������������������������������������������������������������������������������������������������������������������������������� 29
Figure A.7: Impact of taxes on broadband network investment���������������������������������������� 30
Figure A.8: ICT regulatory / institutional framework and sectoral outcomes������������������ 34
Figure A.9: Macro and contextual factors impact on ICT framework and outcomes����� 35
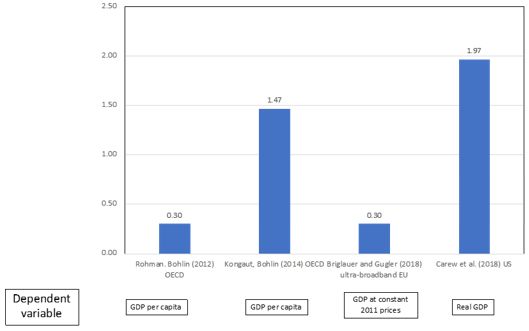
Figure A.10: Studies measuring the GDP impact on broadband speeds
(impact of 100% increase in speed on GDP) (%)������������������������������������������������������������������ 40
Figure A.11: Overall model by considering causality flows������������������������������������������������ 42
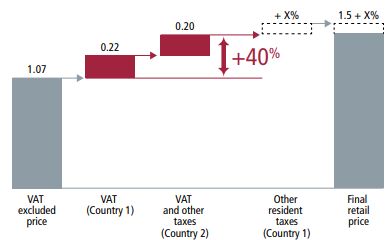
Figure A.12: Double taxation effect on roaming prices������������������������������������������������������ 44
Figure A.13: CAPEX per capita in telecommunications������������������������������������������������������ 45
Boxes
The Inverted ‘U’ theory explaining innovation and capital investment����������������������������� 12
viExecutive summary
This study uses econometric modelling to examine the impact of the regulatory and institutional
frameworks on the performance of the ICT (Information Communication Technologies) sector
and its contribution to the national economy as a whole. Its purpose is to provide policy-makers
and regulators with the empirical evidence required to further regulatory reform in the ICT sector
and address the challenges and gaps in current regulatory frameworks for digital services and
applications. The study scope explores a set of critical questions:
• What is the impact of government policies and regulation on the performance of the ICT
sector, as measured by capital investment, network deployment, service pricing, consumer
demand, and ultimately impact on the economy?
• Is competition enough of an incentive to drive an improvement of sector performance?
• How long does it take for changes in regulation and policies to affect sector performance?
The modelling is built on data from 145 countries between 2008 and 2019 – an up-to-date
global data set, comprising 50 initiatives of policy reforms and institutional characteristics as
well as 13 indicators of ICT sector performance.
Upgrading regulatory frameworks – what matters?
The evidence provided by the study points to major findings that are of great importance in
informing governments, policy-makers, regulators and operators as they formulate general
infrastructure and telecommunication investment decisions in the years ahead:
• The regulatory institutional framework, which is composed of regulatory authority,
regulatory mandate, regulatory regime, and competition model, is linked to a positive
and significant increase in telecommunication investment. This entails having a separate,
independent and autonomous ICT regulator with a wide scope in its attributes, adopting
the best regulatory practices (encompassing the licence regime, service quality monitoring,
spectrum sharing, etc.), and promoting a competitive environment.
• A reduction in taxation is associated with a significant boost in capital investment, as it
increases available financial resources for network deployment.
• A reduction of government bureaucratic processes is linked to a significant increase
of capital investment, confirming the relevance of public efficiency. This highlights the
importance of reducing the required time for obtaining permits related to network
deployment (for instance, through the adoption of “silence procedures1”), addressing
municipal network construction requirements (by promoting a centralized norm of national
scope), and reducing other red-tape costs.
• Being affiliated to international organizations that promote sound regulations and good
practices to enhance a business-prone environment through a binding commitment for
reforms (namely, Organisation for Economic Co-operation and Development (OECD) or
World Trade Organization (WTO)) is linked to higher telecommunication investment.
1
Similar to the international law concept, this would allow an operator requesting an infrastructure deployment
permit to tacitly receive approval if no response occurs from the local authorities within a certain time.
viiRegulatory power boost for mobile
Specifically, for the mobile sector, the following policies were found to have a positive and
significant impact on investment, yielding in turn service coverage gains, price reductions,
higher adoption levels and consequently, a macroeconomic impact in terms of GDP per capita:
• The introduction of a national broadband plan (combined with a strong implementation
framework and leadership), suggesting that the formulation of a digital agenda is crucial
to accelerate innovation and boost investment.
• A convergent licensing framework, as it provides a flexible approach to ICT policies, more
adapted to technological advances, maximizes the return of infrastructure investment.
• Allowing voluntary spectrum sharing agreements, thereby helping operators to maximize the
opportunities to make investments profitable, represents an incentive for network deployment.
• The introduction of mobile number portability, that removes barriers and renders the
market more dynamic, stimulates competition and innovation.
• Openness to foreign operators, increases access to capital for network development and
modernization, and allows for the transfer of technology and know-how.
• The existence of a national competition authority contributes to monitoring multiple market
segments in order to avoid anticompetitive actions.
On the other hand, other policy variables did not show a significant impact on investment.
That is the case, for instance, of infrastructure sharing obligations, spectrum band migration
allowance, or permission for spectrum secondary trading.
All in all, these findings suggest that positive market signals and flexible approaches are
necessary conditions for telecommunication operators to thrive and maximize network
deployment, benefitting consumers and the society as a whole. Given the dynamic nature of
the empirical model, the positive impact from policy and institutional reforms will translate into
further gains beyond a single time period, as capital spending in future years will continue to
grow as a result of the increase in its own past values. This economic flow of performance gains
can be summarized as follows (Figure A).
Figure A: Dynamic economic gains after a policy reform in period t
Source: ITU
Accordingly, the positive impact in terms of GDP per capita will take place two years after the
initiative is enacted and continue to yield a contribution through several time periods.
The empirical evidence generated in this study is expected to provide useful inputs to
policy-makers in terms of a deeper understanding of the linkages between the regulatory
and institutional context and ICT market outcomes, and on the characteristics that effective
public policies should have. However, some caveats need to be made regarding the study
viiiresults. Some of the indicators are limited in terms of their full predictability. For example, the
binary nature of some of the initiatives (i.e., existence of a broadband plan yes/no) does not
provide an indication of their intrinsic quality. On another note, the pandemic of COVID-19 is
expected to have an incidence in the presented results. On the one hand, the GDP contraction
experienced worldwide is affecting telecommunication revenues, negatively impacting capital
spending levels. On the other hand, the lockdown period is resulting in an enhanced use of
digital technologies, thus representing an unobservable shock increasing adoption levels. These
effects will be econometrically measurable when 2020 data becomes available.
With these caveats, the results are powerful in terms of informing policy decisions. Regulators
and policy-makers alike should assess the quality of the institutional framework guiding industry
operations and examine whether some of the policies found to be critical in promoting an
improvement of performance are in place. Even if they have been adopted, it is important to examine
the policies in detail to determine how much they meet some of the international best practices.
Table A: At a glance headlines from the report
ITU ICT Regulatory Tracker An increase of 10% in the Tracker score is associated with
comprised of all four scores an increase of fixed and mobile investment of over 7%.
Regulatory authority An increase of 10% in the score is associated with an
(independence, accountability, increase of close to 8% in fixed and mobile investment.
and enforcement power) score
Regulatory mandate An increase of 10% in the score is associated with an
(responsible for QoS, licensing, increase of close to 11% in fixed and mobile investment.
interconnection rates, spectrum,
universal service, broadcasting,
Internet, IT and consumer
issues) score
Regulatory regime (good An increase of 10% in the score is associated with an increase
practices in terms of licensing, of approximately 4% in fixed and mobile investment.
interconnection, QoS,
infrastructure sharing, access
regulation, and number
portability, among others) score
Competition framework An increase of 10% in the score is associated with an
(competitive intensity in fixed, increase of close to 7% in fixed and mobile investment.
mobile, and broadband
services, among others) score
Profit tax (non-sector specific) A 50% reduction in profit tax affecting the business
sector is associated with an increase of fixed and mobile
investment of nearly 14%.
Bureaucratic burden A 50% reduction in administrative time required for doing
business is linked to an increase in fixed and mobile
investment of 17%.
OECD membership OECD membership is associated with an increase in 36% in
fixed and mobile investment.
Five-year WTO membership Countries with a five-year membership of WTO are
associated with a 17.5% more fixed and mobile investment
with respect to non-members.
ixTable A: At a glance headlines from the report (continued)
Development of a national The development of a national broadband plan increases
broadband plan mobile investment by 15%, network coverage by 14%, price
reduction by 8%, and mobile penetration by close to 3%
after two years.
Convergent ‘technology Moving from service and network specific to convergent
neutral’ licences licensing is associated with an increase of mobile
investment of 10%, network coverage by over 9%,
price reduction by over 5%, and mobile penetration by
approximately 2% after two years.
Spectrum sharing agreements The possibility of performing voluntary spectrum
sharing agreements is associated with a 18% increase in
mobile investment, network coverage by over 17%, price
reduction by close to 10%, and mobile penetration by over
3% after two years.
Mobile number portability The introduction of mobile portability has a positive effect
of increasing mobile investment by close to 11%, network
coverage by 11%, price reduction by approximately 6%, and
mobile penetration by 2% after two years.
ICT sector opened to foreign When the market is opened to foreign players, capital
investment investment is stimulated, increasing by 14%, network
coverage by over 13%, price reduction by close to 8%, and
mobile penetration by close to 3% after two years.
National competition authority The existence of a competition authority (non-sector
(non-sector specific) specific) is related to an increase in almost 10% in mobile
investments, network coverage by close to 9%, price
reduction by over 5%, and mobile penetration by close to
2% after two years.
Optimal industry concentration Optimal mobile industry concentration level (that is to say,
level the one that maximizes capital investment) was found to be
close to HHI=4113.
xThe impact of policies, regulation, and institutions on ICT sector performance
1. Introduction
The impact of regulation, public policy, and institutions on the performance of the
telecommunication/ICT sector has been a key topic concerning operators, policy-makers and
academia. While the economic impact of ICT has been studied for over many decades yielding
a solid understanding of the sector externalities1, the effect of ICT policies and regulation on
sector performance has been less conclusive. Yet, this issue remains front and centre of the
concerns of all sector stakeholders. Along these lines, many questions have not been fully
addressed so far. For example:
• What are the sector and non-sector specific policies that have an impact on service
affordability and coverage?
• Which sector and non-sector specific policies maximize capital expenditures (CAPEX) and
therefore, sector innovation?
• What is the contribution of institutional factors, such as regulatory quality or membership
of international organizations, to policy success?
• How much time does it take for a particular policy to yield an impact on the sector performance?
While research has focused on addressing some of these questions in the past, studies have
typically focused on a particular causal link or have narrowed down the question to explore
causality under a number of constraints. In fact, the review of research conducted as a starting
point of this study indicates that the questions above have not been tackled in a holistic manner.
Part of the reason has been the lack of data on the measurement of policy and institutional
variables. Fortunately, work conducted by the International Telecommunication Union (ITU) in
the past years has generated an extensive data set measuring sector policy features covering
not only developed but also developing countries.2
To fill this gap in the evidence, the purpose of this study is to develop a set of quantitative analyses
measuring the impact of the regulatory and institutional frameworks on the performance of the
telecommunication/ICT sector and on the national economy as a whole. The study provides
empirical evidence of the causal relationships between policy and sector outcomes. In particular,
it focused on understanding how government policies and regulations affect market outcomes,
such as prices, innovation and access to digital services. In addition, the study assesses the
subsequent effect of telecommunication sector performance on the economy, recognizing that
the impact of service adoption on the economy has been extensively covered in a prior study
(Katz and Callorda, 2020).
The study’s ultimate purpose is to provide ICT policy-makers and regulators with the empirical
evidence required to promote further regulatory reforms in the ICT sector and address the
challenges and gaps in current regulatory frameworks for digital services. These issues have
become extremely critical under the current circumstances. A recent report of an economic
expert roundtable organized by ITU concluded that, considering the effect of COVID-19, policy
and regulatory frameworks may need to be adjusted to stimulate investment whilst maintaining
a ‘sensible’ level of competition shifting from a ‘purist’ to a ‘pragmatic’ viewpoint on State aid
1
See literature and evidence reviewed in Katz, R. and Callorda, F. (2020). How broadband, digitization and
ICT regulation impact the global economy. Geneva: International Telecommunication Union retrieved at:
http://handle.itu.int/11.1002/pub/816ff1af-en.
2
See ITU ICT Regulatory Tracker, retrieved at: https://www.itu.int/go/tracker.
1The impact of policies, regulation, and institutions on ICT sector performance
regulations3. All in all, the roundtable concluded that ICT regulation post COVID-19 cannot rely
only on the lessons from the past and needs to re-examine some of its fundamental premises.
2. Model to assess the impact of the policy context on market
outcomes
2.1. Research review4
The research exploring the causal framework of telecommunication/ICT sector regulation and
policies has largely focused on the impact of competition, performing analyses from different
perspectives, such as its incidence on service adoption, pricing and innovation:
• Competition and service adoption. Research assessing the impact of competition on service
adoption focused initially on the effects of privatization on sector performance. Once the
wave of privatizations was largely completed, the main focus shifted towards industry
liberalization and service adoption. Finally, the third body of research focuses implicitly
on the transitive relationship between specific policies, such as network unbundling, and
service adoption.
• Competition and pricing. Another body of research focused on the relationship between
competition and service prices. Similarly, some have analysed the impact of wireless
mergers on prices.
• Competition and innovation. The most important body of research on the relationship
between competition and innovation focuses on the impact on capital investment, which
leads in turn to network deployment and, consequently, innovation. An important area
of research has indicated that the effect of competition and innovation may not be linear
but shaped by an ‘inverted-U’.
Another relevant research topic has been the impact of taxation. Taxation has also been found
to have an impact on service adoption and on innovation:
• Sector specific taxation and service adoption. Studies in the field have intended to provide
answers to some relevant questions, such as: What is the appropriate level of taxation? And,
which services should be taxed? A reduction of taxes on telecommunication services and
devices may have a positive impact on service adoption as a result of demand elasticities.
• Sector specific taxation and innovation. Taxation on telecommunication operators can have
an important impact on investment. A decrease in taxation affecting equipment purchases
increases investment, generating in turn positive effects in terms of GDP growth.
Another body of the research literature has focused on the key role that effective spectrum
management plays in the delivery of quality and affordable services to the consumers:
• Spectrum management and service adoption. Effective spectrum management can
have an important impact on market outcome, and as a result, on adoption levels and
consumer surplus. Spectrum management is central to the quality and affordability of
mobile broadband services.
• Spectrum management and innovation. To encourage substantial investment and
innovation in mobile services, it is important to have a transparent, long-term plan including
a strategy for making sufficient amounts of spectrum available. Spectrum management,
3
International Telecommunication Union (2020). The economic impact of COVID-19 on digital infrastructure.
Geneva: ITU, retrieved at: https://www.itu.int/pub/D-PREF-EF.COV_ECO_IMPACT.
4
A detailed literature review covering all the above-mentioned areas is presented in Appendix A.
2The impact of policies, regulation, and institutions on ICT sector performance
its pricing, and the imposition of associated obligations can have a significant impact on
investment and innovation.
Beyond specific policies, sector outcome is expected to be influenced by the ICT institutional
framework, as well as other macro policies and contextual factors:
• Through its monitoring and enforcement capability, the ICT regulatory institutional
framework intermediates the causality between policies and market outcomes. The
research literature has provided vast evidence regarding the impact of the institutional
framework on adoption and sector performance.
• In addition, some of the regulations reviewed above are not necessarily specific to the
ICT sector but are influenced by macro policies. A typical example is that of competition,
which in the telecommunication sector should be understood within the context of general
competition law.
• Finally, sectoral policies and the design of its institutional framework are not formulated
in a vacuum. They are influenced by a number of contextual factors, such as international
organization affiliations, executive leadership, or institutional efficiency.
While research has focused on addressing some of these questions related to the impact of
regulation and policy on sector performance, most studies tend to focus on a particular causal
link or narrow down the question to explore causality under a number of constraints. Along
those lines, the purpose of this study is to attempt to integrate many of the variables studied
before within a comprehensive causal framework.
2.2. A causal model to frame the impact of policy and institutional
factors on ICT sector performance
As suggested in the literature, a range of causal links take place between the policy and regulatory
context and market outcomes in the telecommunication/ICT sector. The combination of all the
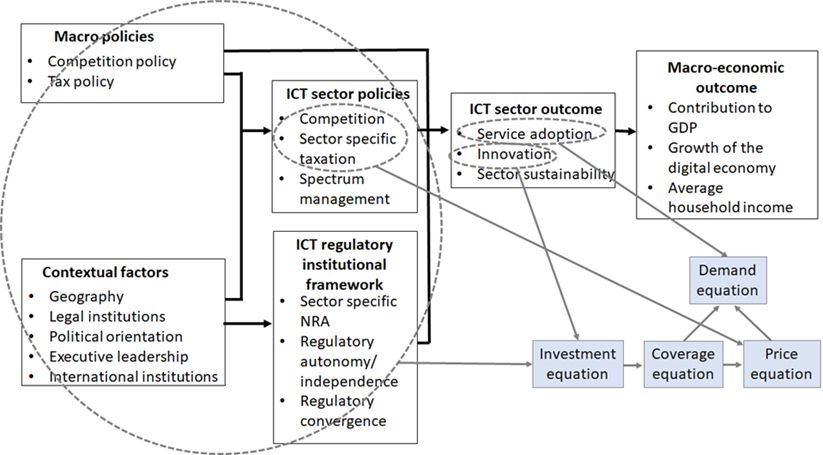
elements within a single causality framework is presented in the flow diagram in Figure 1.
Figure 1: Overall model by considering causality flows
Macro policies
• Competition policy
Macro-economic
• Tax policy
ICT sector policies outcome
ICT sector outcome • Contribution to
• Competition
• Service adoption GDP
• Sector specific
• Innovation • Growth of the
taxation
• Sustainability digital economy
• Spectrum
• Average
management
household income
ICT regulatory
Contextual factors institutional
framework
• Geography • Sector specific
• Legal institutions NRA
• Political orientation • Regulatory
• Executive leadership autonomy/
• International institutions independence
• Regulatory
convergence
Source: ITU
3The impact of policies, regulation, and institutions on ICT sector performance
The economic model for this study explores the interplay between multiple variables:
• The principal causal relationship between ICT sector policies and market outcomes is
predicated on multiple links whereby each of the three independent variables (competition
model, sector specific taxation, spectrum management) affect each of the three dependent
variables (service adoption, innovation, and sector sustainability).
• In turn, the impact of ICT sector policies on market outcomes is mediated by the ICT
regulatory institutional framework, which conditions policy effectiveness.
• Furthermore, the development of ICT sector policies is influenced by non-sector specific
macro policies (such as national competition policy models and tax policy) and contextual
factors (such as the country’s position in the policy diffusion process, legal institutions, and
the role of influencing parties).
• Downstream, the ICT market outcome has an impact on the macro-economic outcome in
terms of growth of the GDP, growth of the digital economy and other economic variables
such as average household income.
This causal model is not static. As some of the research indicates, independent variables may
interact among themselves to drive different effects (such is the case of the competition model
and spectrum management practices). In addition, some of the outcome variables might also
condition each other creating ‘second order’ effects. For example, the rate of innovation impacts
service adoption.
In order test this set of causal links, a structural model was developed consisting in four main
empirical equations, described as follows:
Table 1: Econometric model equations
Investment equation5
log ( CAPEX t ) = α + β log ( CAPEX t −1 ) + γ log ( REVENUEt −1 ) + δ ( X t ) + ε1
Coverage equation
i =3
log ( COVERAGE )t = ϒ + Φlog (CAPEX t −i ) + ∑ν i log ( COVERAGEt −i ) + λ log(URBAN )t + ε 2
i =1
Price equation
log ( PRICES )t = Λ + π (TAX t ) +ψ log (COVERAGEt ) + Γ(COMPETITION t ) + ε 3
Demand equation
log ( DEMAND )t = Θ + η log ( PRICEt ) + τ log(COVERAGEt ) + ς log ( GDPpct −1 ) + σ ( AGEt ) + ε 4
The term X in the investment equation denotes a vector of variables linked to the policy context.
Accordingly, policy context variables are expected to directly impact investment, and indirectly
(with a time-lag) contribute to service coverage, prices and demand. Figure 2 places the
equations reported in Table 1 in the context of the overall causality model presented above:
5
The CAPEX variable is considered in the aggregate rather than normalizing it on a per capita basis;
however, since it is also included as a lagged independent variable and the consideration of aggregate
revenues controls for any scale effect.
4The impact of policies, regulation, and institutions on ICT sector performance
Figure 2: Model equations in the context of the overall causality flows
Source: ITU
In order to test the model a data set was built from the available information sources and an
empirical strategy was specified following the specialized econometric literature:
• The database is composed by 145 countries during the period 2008-2019 (country list
presented in the Appendix B and the complete details of the variables in Appendix C).
• The investment equation of the model was estimated first for the combined fixed and
mobile telecommunication sector, and, following that, for the mobile segment (voice and
broadband) specifically. The remaining equations were estimated only for mobile, due to
limited fixed broadband data availability.
• The econometric specification was designed intending to maximize its robustness by
controlling for all possible sources of endogeneity. The complete methodology utilized
is described in detail in Appendix D.
3. Key drivers of fixed and mobile telecommunication investment
The first analysis was focused on testing the impact of key regulatory and policy variables on
investment (defined as the aggregate capital spending of fixed and mobile operators in a given
year). This was done by introducing as contextual variables the respective ICT regulatory pillars
indices and the overall score of the ITU ICT Regulatory Tracker6 (see Figure 3).
6
See Table C.1 in Appendix C for the complete description of the ITU ICT Regulatory Tracker variables.
5The impact of policies, regulation, and institutions on ICT sector performance
Figure 3: Impact on telecommunication capital investment after an increase
of 10% in the respective sub-index (contemporaneous effect)
12.00% 11.26%
10.00%
7.73%
8.00% 7.37%
6.72%
6.00%
3.94%
4.00%
2.00%
0.00%
Regulatory Authority Regulatory Mandate Regulatory Regime Competition ICT Regulatory Tracker
Framework (overall)
Source: ITU
Notes: The impact measures an increase of 10% (over the mean) in the respective indices
Simulations performed with the coefficients reported in Table E.1 in Appendix E.
The econometric estimate of the investment equation for the overall telecommunication sector
confirms the relevance of the policy and institutional context for network deployment7
• A 10 per cent increase in the regulatory authority pillar score is associated with an increase
in investment of almost 8 per cent. This means that having a separate ICT regulatory
agency, with the desired characteristics (in terms of independence, accountability, and
enforcement power), contributes to creating a suitable framework that spurs investment.8
A review of pillar scores indicates that most countries have made important advances in
this field. In 2019, 85 per cent of all covered countries achieved a score above the mean
(10), while 42 per cent achieved a score of at least 18 (of a total of 20).
• A 10 per cent increase in the regulatory mandate pillar score is linked to an increase
in investment of 11 per cent. This suggests the relevance of the scope of attributions
attributed to the regulatory agency (in terms of being in charge of Quality of Service (QoS),
licensing, interconnection rates and price regulation, radio spectrum, universal service,
broadcasting, Internet, IT and consumer issues). Having a separate ICT regulator rather
than a government ministry in charge of a wide array of regulatory topics contributes to
improving the environment required to spur investments. Most countries have experienced
important advances in this area, with 91 per cent exhibiting a value above the mean (11)
in 2019, and 50 per cent reaching a value of 18 or higher (of a total of 22).
• A 10 per cent increase in the regulatory regime pillar score is associated with almost 4 per
cent increase in investment. This pillar refers to the adoption of good practices related
to specific regulations in terms of licensing9, interconnection, QoS infrastructure sharing,
access regulation, and number portability, among others. This points out at the relevance
7
The complete econometric results are presented in Table E.1 in Appendix E. In addition, no major differences
were found for these estimated results between developing and developed countries (see detailed results
in Table E.2 in Appendix E).
8
This is consistent with the findings of the surveyed literature such as Wallsten (2001), Gutierrez (2003),
Maiorano et al. (2007), Waverman et al. (2007), among others.
9
The indicators in this pillar consider if only service-specific, multi-service individual, unified/global licences,
general authorizations or simple notification are provided, or if there is a licence exemption.
6The impact of policies, regulation, and institutions on ICT sector performance
of adopting best regulatory practices to accelerate investment. Almost 75 per cent of the
surveyed countries reached in 2019 a score above the mean of 15, and 50 per cent reached
a score of 20 or higher (of a total of 30).
• A 10 per cent increase in the competition framework pillar score, is linked to an increase
of almost 7 per cent in investment.10 This score measures competitive intensity in local and
long distance, mobile, and broadband services, among others, the criteria for determining
dominance or significant market power (SMP), plus the allowance of foreign presence in
the ICT sector. 50 per cent of the surveyed countries reached in 2019 a score above 23,
while 30 per cent reached a score above 26 (of a total of 28).
The regulatory characteristics measured through the ICT Regulatory Tracker pillars are very
much complementary among themselves. The results in Figure 4 indicate the cumulative impact
of regulatory authority and regulatory mandate pillars according to two specific sub-samples,
depending on the values taken by the regulatory regime pillar score (above or below the
overall sample median). As can be observed, the measured impact of regulatory authority is
reduced by 50 per cent for countries that lack a propitious regulatory regime, while on the
other hand, regulatory mandate is no longer significant for this country group. In other words:
the relevance of the regulatory authority and regulatory mandate to explain investment levels
is largely diminished when not accompanied by sound policies.
Figure 4: Impact on telecommunication capital investment after an increase
of 10% in complementary drivers (contemporaneous effect)
10.00%
9.09% 9.26%
9.00%
8.00%
7.00%
6.00%
4.93%
5.00%
4.00%
3.00%
2.00%
1.00%
0.00%
0.00%
Regulatory Authority & Reg. Regulatory Authority & Reg. Regulatory Mandate & Reg. Regulatory Mandate & Reg.
Regime > median Regime < median Regime > median Regime < median
Source: ITU
Note: The impact measures an increase of 10% (over the mean) in the respective indices.
Simulations performed with the coefficients reported in Table E.1 in Appendix E.
Overall, these results are consistent with Katz (2020), who analysed the impact of ICT Regulatory
Tracker indices on the Digitization Index, finding that regulatory and institutional maturity in the
ICT arena make indeed a significant difference in driving the growth of digitization11.
10
This result supports previous findings in the literature regarding the relevance of a suitable competition
environment to enhance telecommunication development (Wallsten, 2001; Li et al, 2004; Grzybowski, 2008).
11
ITU Report How broadband, digitization and ICT regulation impact the global economy, available at
www.itu.int/en/ITU-D/Regulatory-Market/Pages/Economic-Contribution.aspx
7The impact of policies, regulation, and institutions on ICT sector performance
Another analysis addresses the impact of the complete ITU ICT Regulatory Tracker score, which
is composed by all four previous pillars. An increase of 10 per cent in the Tracker score is
associated with an increase of investment of over 7 per cent, thereby indicating the significant
importance of regulation in driving performance of the ICT sector. The advance made by most
countries is reflected by the fact that 50 per cent of the sample has achieved a score of at least
75 (of a total of 100) in 2019. However, there are important differences according to the level
of development: while the sample of developing countries reach an average score of 67, the
mean for developed economies is 87. Considering that developing countries lag the level
of telecommunication investment, the results indicate that if an average developing country
increases the Tracker score by 20 (that is to say, reaches a score similar to that of a developed
nation), that would yield a 24 per cent increase in investment.
Beyond the ICT Regulatory Tracker variables, other drivers of investment as considered in the
causality model presented in Figure 1, were tested (see Figure 5).12
Figure 5: Simulations of variables impact on telecommunication capital
investment (contemporaneous effect)
40.00%
36.13%
35.00%
30.00%
25.00%
20.00% 17.05% 17.50%
15.00% 13.75%
10.00%
5.00%
0.00%
50% reduction in 50% reduction in OECD membership WTO 5-year
Profit tax bureaucratic burden membership
Source: ITU
Note: Simulations performed with the coefficients reported in Table E.3 in Appendix E.
• A 50 per cent reduction in profit tax affecting the business sector is associated with an
increase of ICT investment of nearly 14 per cent. This means that, as expected, the larger
the taxation pressure imposed on the operators, the lower the available financial resources
for network deployment.13
• A 50 per cent reduction in administrative time required for doing business is linked to
an increase in ICT investment of 17 per cent. This suggests the relevance of government
and institutional efficiency, in terms of reducing the required time for permits and other
red-tape costs constraining network construction. The bureaucratic burdens related to
institutional deficiencies can increase adjustment costs to investors, and as a result, to
discourage investment decisions.
• OECD membership is associated with an increase in 36 per cent in investment, a result
that supports the relevance for countries to become part of international organizations that
promote sound regulations and good practices to enhance a business-prone environment.
However, this result must be taken with caution as it may be affected by some upward bias.
Countries belonging to the OECD are richer and more developed than those that are not
12
The complete econometric results are presented in Table E.3 in Appendix E.
13
This result is consistent with previous findings in the literature (Katz et al., 2012; Katz and Callorda, 2019).
8The impact of policies, regulation, and institutions on ICT sector performance
part of this organization. Even if the estimation performed controls for past investment
and revenues, it is natural to expect more advanced economies to experience larger
investments. On the other hand, the OECD membership is expected to be correlated with
other variables proxying good regulatory frameworks and institutions; thus, the coefficient
may be capturing some of those effects as well.
• Similarly, countries with a 5-year membership of the WTO are linked to a 17.5 per cent
more investment than non-members, again pointing out at the relevance of being part of
international organizations that promote good policy frameworks. Specifically, the WTO
promotes principles14 of non-discrimination (in terms of national and foreign products and
services), openness (by lowering trade barriers), predictability and transparency (avoiding
arbitrary decisions) and competitiveness (by discouraging ‘unfair’ practices). All these
principles are essential for creating a business-prone environment.
To sum up, in terms of the specific variables being tested, if a country is aiming at increasing
the investment in fixed and mobile telecommunications, the following changes should be
implemented: tax reductions for the sector, as well as reduction of bureaucratic burdens that
inhibit investment decisions. In addition, countries should evaluate the possibility of joining
international organizations that promote good regulatory frameworks, or at least to incorporate
their policy recommendations.
4. Drivers of performance and impact of mobile telecommunications
The availability of a full data set for the mobile sector15 allows estimating the complete structural
model as detailed in Table 1. The model starts with the econometric regression of the investment
equation by introducing specific policy and regulatory reforms as explanatory variables. The
focus will be on the assessment of the following regulatory reforms:
• the development of a national broadband plan;
• the assignment of converged licences;
• the possibility for mobile operators to voluntarily conduct spectrum sharing agreements;
• the introduction of the requirement of mobile number portability;
• the openness of the market to foreign operators for spectrum-based services; and
• the creation of a competition authority.
These variables are usually identified as part of regulatory best practices in the ITU ICT Regulatory
Tracker. They represent three different public policy types:
• Market-signalling policies: this concept entails initiatives that, while they carry limited
enforcement power, they embody a government belief or a strategic aspiration (such as
development of the digital economy), which sends a ‘signal’ to the private sector to respond
accordingly. A national broadband plan or a digital agenda are examples of this policy.
• Conditional policies: these policies formulate rules and ‘conditions’ under which the
sector operates that act as enablers for ICT operators to maximize their business-case
14
https://www.wto.org/english/thewto_e/whatis_e/what_stand_for_e.htm.
15
The lack of reliable series of investment for fixed broadband technologies prevented running a complete
structural model for fixed telecommunications. In addition, as the dependent variables of the remaining
equations of the structural model are technology-specific (coverage levels, prices, penetration), it precluded
running a complete structural model for the overall telecommunication sector (fixed and mobile).
9The impact of policies, regulation, and institutions on ICT sector performance
and make more profitable their investments. Spectrum sharing permits or the assignment
of converged licences are some of these policies.
• Specific regulatory obligations: these policies are imposed as they expect to improve
market dynamics. Such is the case of the requirement of mobile number portability.
All identified reforms boost mobile telecommunication CAPEX
The impact of each variable on capital expenditures were assessed first. In addition, the
possibility of all policies being implemented simultaneously16 was considered. The impact of
each reform type and the cumulative set of all policies on mobile CAPEX is shown in Figure 6.17
Figure 6: Mobile CAPEX improvement after a simulated policy reform
(contemporaneous effect)
35.00%
30.00%
25.00%
20.00%
15.00%
10.00%
5.00%
0.00%
National Convergent Spectrum Mobile Openness to Competition All six policies
Broadband licenses sharing portability foreign Authority
Plan allowed operators
Source: ITU
Note: Simulations reported in Tables E.9 to E.14 in Appendix E.
Model results highlight the different impact of specific policies in addition to the cumulative
effect of all of them. While the effect of each regulatory initiative is significant, countries that
implement all policies simultaneously drive an increase in investment levels over 30 per cent
larger than those countries that do not implement any of them. This suggests the positive effects
of carrying out all the simulated policy reforms simultaneously.
When considering the impact of each policy, the following results point to their independent
contribution:
• The development of a national broadband plan (a market signalling initiative with
limited enforcement power) has a positive impact, increasing mobile investment by 15
per cent. At a higher level, so-called ‘signalling’ policies that do not convey changes in
16
For that purpose, a regulatory scale was built taking values from zero to six depending on the number of
regulatory initiatives each country implements. In other words, a country that does not implement any policy
is assigned a value of zero in the scale, while a country that puts in practice all of them will receive a value
of six. Countries that implemented some of the policies (but not all), receive values between 1 and 5. We
relied on this scale to compare the two extreme scenarios: countries promoting all six policies compared
to those that do not implement any of them.
17
The complete econometric results are presented in Table E.4 in Appendix E.
10The impact of policies, regulation, and institutions on ICT sector performance
the environment or regulatory obligations, can exercise a positive impact in fostering
investment and innovation. This suggests that political leadership in terms of implementing
a digital agenda is crucial, reinforcing the necessity of a consensus and coordination for
both infrastructure deployment and the regulation of the services to be provided, which
in turn, accelerate innovation and boost investment. By 2019, of the surveyed countries,
89 per cent had already developed a broadband plan18.
• Converged ‘technology neutral’ licences have a positive and significant impact on
investment. Moving from service and network specific to converged licensing is associated
with an increase of mobile investment of 10 per cent. Converged licensing constitutes a
flexible approach, more adapted to technological advances, and contributes to maximize
the financial returns of investments. On the contrary, rigid and technology-specific licences
are not expected to keep up with the innovations and developments of the ICT sector. This
finding could be extended to interpret it as the value of flexible regulatory frameworks.
• The possibility of signing up voluntary infrastructure and spectrum sharing agreements is
associated with a 18 per cent increase in mobile investment. This practice allows to maximize
the opportunities for operators to make investment profitable, creating incentives for network
deployment. Network-sharing agreements can optimise the use of infrastructure, generally
reducing costs, thus being beneficial for both service providers and consumers. Again,
this variable can also be assumed to be a proxy for flexible a spectrum approach, usually
considered as a necessary condition to maximize the development of mobile services.
• The introduction of mobile number portability has a positive effect of increasing mobile
investment by close to 11 per cent. This is related to the fact that the policy renders the
market more dynamic and competitive. Number portability lowers barriers for consumers
to change mobile providers. As a result, operators have to strive and provide the best
quality and services to retain their current subscribers.
• When the market is opened to foreign players, capital investment is stimulated, increasing
by 14 per cent. Foreign investment facilitates the growth and development of the ICT
sector, facilitating access to capital for network development and modernization, and
allowing for the transfer of technology and know-how, leading to increased productivity,
innovation and competitiveness.
• The existence of a national cross-sector competition authority is related to an increase
in almost 10 per cent in mobile investment. The existence of a competition authority
contributes to monitor multiple digital markets in order to avoid anticompetitive actions
taken by operators with significant market power, potentially harming other market players,
possible new entrants as well as consumers. However, it must be said that the link between
competitive intensity and investment was found to be non-linear19, as suggested by the
‘inverted-U’ theory developed by Aghion et al. (2005)20. Simulations performed with the
coefficients from the estimated regressions provide evidence on the existence of an
optimal market concentration level. Figure 7, in the sample considered, shows the optimal
concentration level (that is to say, the one that maximizes capital investment) was found to
be close to a Herfindahl Hirschman Index (equal to ) equal to 4113.
18
This indicator does not provide a sense of the quality of the plan; in other words, the publication of a
national broadband plan is not the only determinant of investment impact. Its quality, process for building
collaboration between the public and private sector and executive leadership are critical implementation
components.
19
The procedure to measure the non-linearity was based in the introduction of the logarithm of the HHI index
both in levels and in squares as a regressor in the investment equation. As observed in Table E.4 in Appendix
E, both associated coefficients were statistically significant, with the level variable reaching a positive value
and the squared exhibiting a negative sign. This is what explains the ‘inverted-U” in terms of concentration
and investment.
20
See extensive analysis of the research on this topic in Appendix A.1.1.2.
11You can also read