FINAL YEAR PROJECT - CLAIM project
←
→
Page content transcription
If your browser does not render page correctly, please read the page content below
FINAL YEAR PROJECT
                         To obtain the title of:
                 Chemical and Petrochemical Engineer

                              Prepared by:
                             YOUNES Afaf
             ________________________________________________

  Microplastics in the marine environment, presence in water and
                 interaction with marine organisms
                    Under the supervision of:
Dr. GARAVENTA Francesca                               Dr. HOBEIKA Nelly
                    The jury is composed of:
            Dr. AZZI Marwan                         President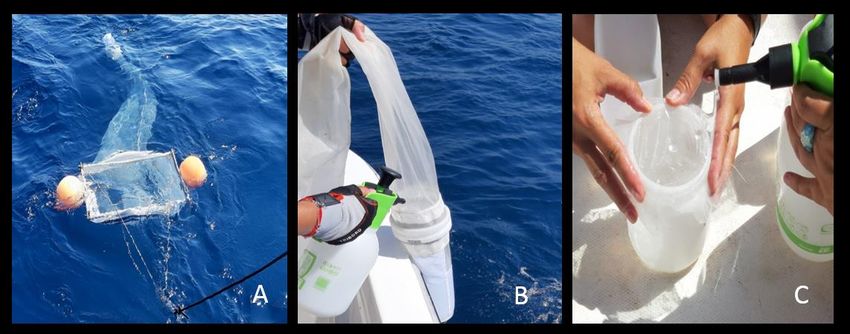
I dedicate this project to my family and my supervisors in Lebanon and Italy who
supported me during the course of this project. I greatly appreciate what you did.

                                        1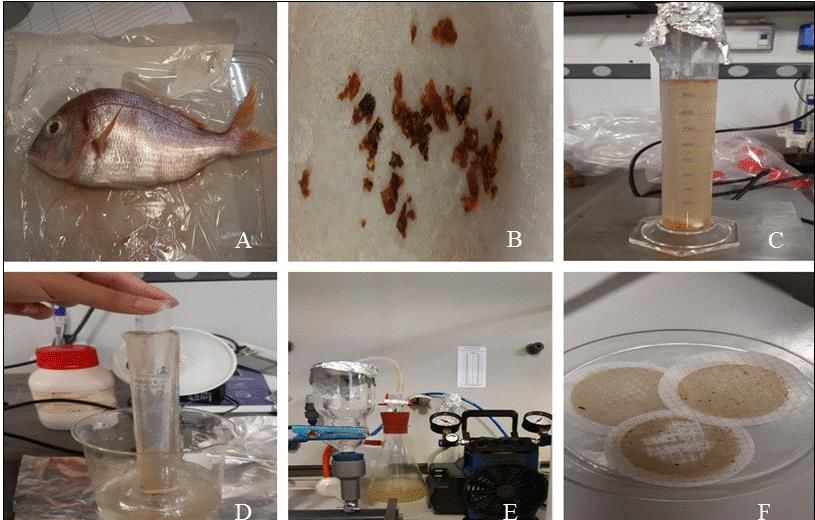
ACKNOWLEDGEMENTS
This final year project was carried out in the Institute for the Study of Anthropic Impacts and
Sustainability in Marine Environment of the National Research Council (CNR-IAS, Genova- Italy)
and I am using this opportunity to express my gratitude to everyone who supported me throughout
the course of this final year project.
First and foremost, I would like to express my sincere gratitude to my supervisor Dr. Nelly Hobeika
for her continuous support of my final year project, for her patience, motivation, and immense
knowledge. Her guidance helped me in all the time of research and writing of this project.
My sincere thanks also goes to Dr, Francesca Garaventa, my supervisor in CNR-IAS, and to the
members of her team, Dr. Silvia Morgana, Dr. Chiara Gambardella, Dr. Veronica Piazza and Dr.
Elisa Costa for their aspiring guidance, their friendly advices during the project and for their
permission to use all required equipments and the necessary materials to complete my tasks.
I would also like to offer my special thanks to Dr. Marwan Azzi, head of the chemical engineering
department in the Lebanese University - Roumieh as well as to Dr.Marco Faimali, responsible of
CNR-IAS.
Last but no least, I would like to thank my family for supporting me spiritually throughout this
project and in my life in general.

                                                2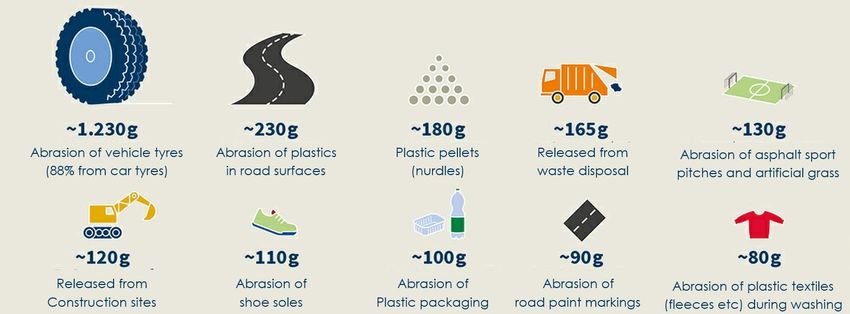
ABSTRACT
Pollution of the marine environment by microplastics is a topic of increasing concern and it has
received a lot of attention in recent years. This work presents a study done in the framework of a
European project “CLAIM” (Cleaning Litter by developing & Applying Innovative Methods in
European seas) in which the Lebanese University is a partner. It aims to develop innovative
technologies in order to reduce the amount and impact of plastic pollution on the ecosystem-based
services of the Mediterranean and Baltic Seas.
The objective of this project is to advance the knowledge on the current status of marine plastic
pollution in the Gulf of Gabes area of the Mediterranean Sea, by quantifying and qualifying the
microplastics in water and biota samples. The results obtained show a high abundance of
microplastics in all marine compartments studied with an average abundance of 1.16 items/m3 ±
0.83 SD in the water sample. This concentration is relatively high compared to those reported in
other Mediterranean regions. Dominance in number of fragments over other shapes of micro-
plastics was reported in all sites. Polyethylene was the main plastic polymer for water samples
(73% of the items analyzed are Polyethylene). These data underscore that the Gulf of Gabes region
is a hotspot for plastic pollution, and this calls urgently for precautionary measures. Concerning
the ingestion of microplastics by marine organisms, one blue plastic particle of 0.13 mm is found
in 20 tested fishes. In addition, ecotoxicological tests were run in order to verify whether 1-4 and
20-25 μm polyethylene beads are likely to trigger lethal and sub-lethal responses in marine
planktonic crustaceans and the results show that microplastics were accumulated in crustaceans,
and may affect mortality specially if no future precautions are considered. These results report a
deeper understanding of the extent of the threat of microplastics in the marine environment to
marine species and to humans themselves.

Keywords: Microplastics, Gulf of Gabes, water pollution, crustaceans

                                                 3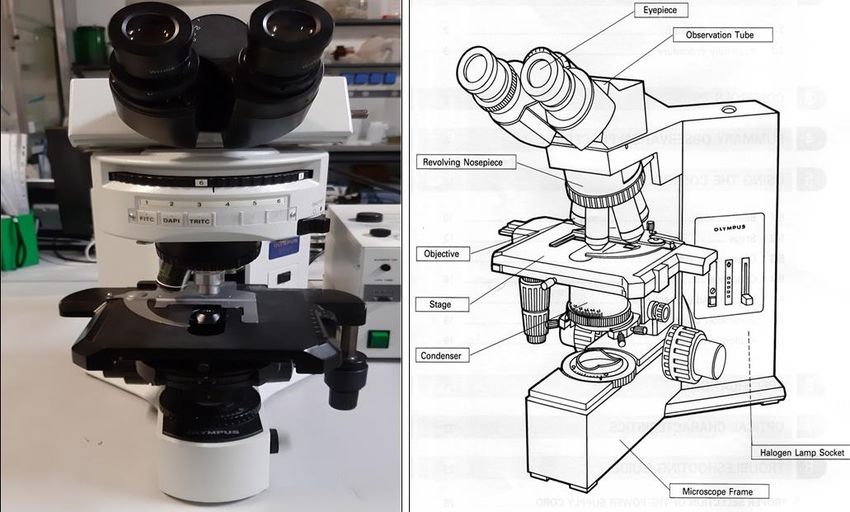
RÉSUMÉ
La pollution du milieu marin par les microplastiques est un sujet d’actualité qui reçoit beaucoup
d’attention ces dernières années. Cet travail présente une étude réalisée dans le cadre d’un projet
Européen “CLAIM” (Cleaning Litter by developing & Applying Innovative Methods in European
seas) dans lequel l'université Libanaise est un partenaire. Il vise à developper des technologies
innovantes afin de reduire la quantité et l’impact de la pollution des microplastiques sur les services
ecosystémiques de la Méditerranée et de la mer Baltique. L’objective de ce projet est de faire
progresser les connaissances sur l’état actuel de la pollution par les microplastiques au Golfe de
Gabès de la Méditerranée. Ceci est réalisé en qualifiant et quantifiant les microplastiques dans des
échantillons d’eau et de biote. Les résultats obtenus montrent une forte abondance des
microplastiques dans tous les compartiments marins étudiés avec une abondance moyenne en
nombre de 1.16 particules/m3 ± 0.83 SD dans l’echantillon d’eau. Cette concentration est
relativement élevée par rapport à celles rapportées dans les autres régions du Méditerranée. Une
dominance en nombre de fragments sur les autres types de microplastiques a été signalée. Les
plastiques de nature polyéthylène étaient les plus répandus dans la colonne d’eau (73% des
particules analysées sont du nature polyéthylène). En ce qui concerne l’ingestion des
microplastiques par les organismes, une particule bleu de 0,13 mm est trouvée dans 20 poissons
testés. En outre, des tests écotoxicologiques ont été effectués afin de vérifier si les 1-4 et 20-25 μm
billes de polyéthylène étaient susceptibles de déclencher des réponses létales et sublétales chez les
crustacés planctoniques marins et les résultats montrent que les microplastiques se sont accumulés
dans les crustacés et peuvent affecter la mortalité, surtout si aucune précaution future n'est
envisagée. Ces résultats rapportent une compréhension plus profonde de l’ampleur de la menace
des microplastiques présents dans l’environnement marin sur les espèces marines et sur l’homme
même.
Mot-Clés: Microplastiques, Golfe de Gabès, pollution marine, crustacés planctoniques marins

                                                  4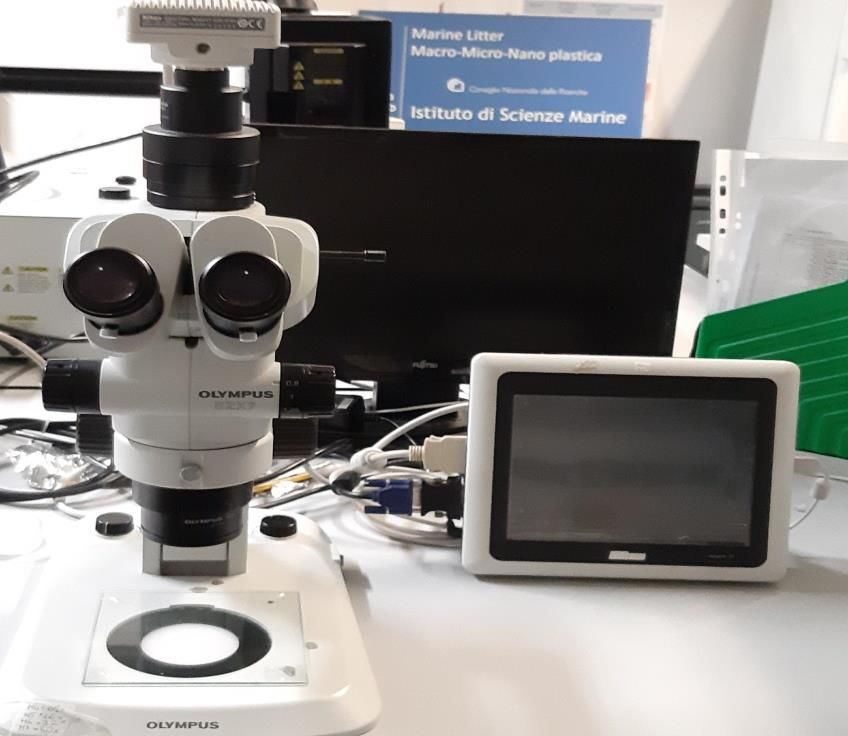
Table of Contents
ACKNOWLEDGEMENTS.........................................................................................................2

ABSTRACT ...............................................................................................................................3

RÉSUMÉ ....................................................................................................................................4

FIGURES LIST ..........................................................................................................................7

TABLES LIST ............................................................................................................................9

LIST OF ABBREVIATIONS AND SYMBOLS ....................................................................... 10

INTRODUCTION .................................................................................................................... 11

CHAPTER Ι – LITERATURE REVIEW .................................................................................. 13

   I.1 Origin of plastics .............................................................................................................. 13
   I.2 What are plastics and how they are made? ........................................................................ 14
   I.3 Advantages and disadvantages of using plastic products ................................................... 16
   I.4 Biodegradable alternatives to plastic ................................................................................. 19
   I.5 Microplastics definition and categories ............................................................................. 21
   I.6 Sources of microplastics ................................................................................................... 21
   I.7 Distribution of microplastics in the aquatic environment .................................................. 23
   I.8 Threat of microplastics to the aquatic environment ........................................................... 24
   I.9 Are microplastics affecting our health? ............................................................................. 26
   I.10 Microplastics treatment technologies .............................................................................. 28
   I.11 The Mediterranean: one example of the impact of marine microplastics ......................... 29
CHAPTER II - MATERIALS AND METHODS ...................................................................... 30

   II.1 Zone of study and sampling sites ..................................................................................... 30
   II.2 Samples collection .......................................................................................................... 32
      II.2.1 Sea water sampling procedure................................................................................... 32

                                                                     5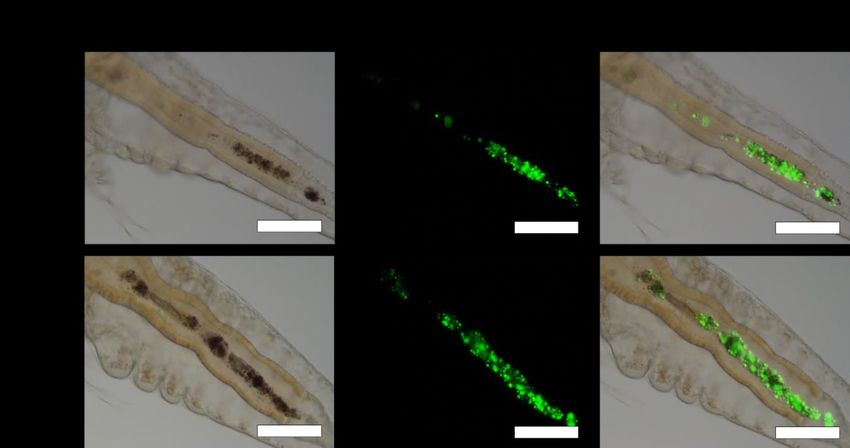
II.2.2 Biota samples collection ........................................................................................... 33
   II.3 Samples laboratorial analysis .......................................................................................... 35
      II.3.1 Analysis of sea water samples ................................................................................... 35
      II.3.2 Biota samples analysis .............................................................................................. 40
      II.3.3 Contamination control measures ............................................................................... 41
   II.4 Ecotoxicological effects of MPs on the marine environment ............................................ 42
CHAPTER III -RESULTS AND DISCUSSIONS ..................................................................... 46

   III.1 Quality control ............................................................................................................... 46
   III.2 Microplastic abundance in water samples ....................................................................... 47
      III.2.1 Abundance of MPs according to their shape ............................................................ 50
      III.2.2 Size classes of MPs ................................................................................................. 51
      III.2.3 Abundance of MPs according to their polymer type ................................................. 53
   III.3 Abundance of MPs in Biota samples .............................................................................. 54
   III.4 Ecotoxicological effects of MPs on Artemia sp. ............................................................. 55
      III.4.1 The effects of 1-4 µm fluorescent PE MPs on Artemia sp. nauplii............................ 55
      III.4.2 The effects of 20-25 µm polyethylene MPs on Artemia sp. nauplii .......................... 57
CONCLUSION ......................................................................................................................... 59

PERSPECTIVES ...................................................................................................................... 60

REFERENCES ......................................................................................................................... 62

                                                                    6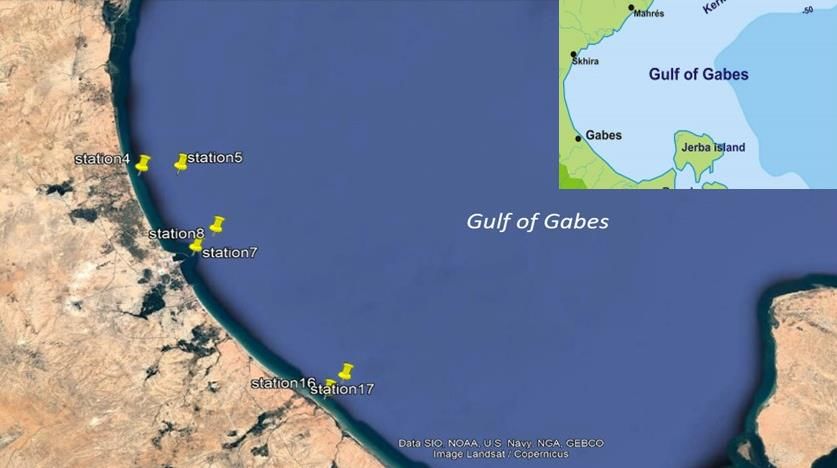
FIGURES LIST
Figure 1. plastic demand by type of resin .................................................................................. 14
Figure 2. Global plastic waste generation by industrial sector, measured in tonnes per year .... 19
Figure 3. Schematic of which synthetic polymers tend to float and which tend to sink in the ocean,
image from GRID-Arendal (2016). ................................................ Error! Bookmark not defined.
Figure 4. Potential Pathways for Transport of Microplastics and their Biological Interactions
.....................................................................................................Error! Bookmark not defined.
Figure 5. Map of the Mediterranean Sea showing the Gulf of GabesError!                                               Bookmark              not
defined.
Figure 6. Map showing the locations of the 6 sampling sites within the Gulf of Gabes........ Error!
Bookmark not defined.
Figure 7. Sea water sampling steps: (A) manta net is deployed in water, (B) the net is recovered,
held vertical and washed into the cod end, (C) the cod end is removed and rinsed using filtered
sea water. .................................................................................................................................. 33
Figure 8. Olympus SZX7, 8x-56x stereomicroscope with attached Nikon, DSL3 digital camera
used for MPs detection .................................................................. Error! Bookmark not defined.
Figure 9. Different shapes and colors of microplastics: (A) yellow fragment, (B) transparent film,
(C) black fiber ...............................................................................Error! Bookmark not defined.
Figure 10. PerkinElmer Spectrum Two Fourier Transform Infrared Spectroscopy Spectrometer
.....................................................................................................Error! Bookmark not defined.
Figure 11. Search results for one random plastic particle, showing a good match against the
polypropylene reference ............................................................................................................ 40
Figure 12. pictures showing the recovery of MPs from fish sampleError! Bookmark not defined.
Figure 13. Examples of fibers found on the procedural blank during the analysis of water and fish
samples. (A) black fiber, (B) and (C) blue fibers. ....................................................................... 46
Figure 14. classification of textile fibers: sources and examples ................................................ 47
Figure 15. Abundance of plastic items at each sampling station ................................................ 48
Figure 16. Distribution of plastic items by shape at each sampling station ................................ 51
Figure 17. Distribution of plastic items according to their size ...... Error! Bookmark not defined.
Figure 18. Distribution of MPs according to their chemical composition .................................. 54
Figure 19. The plastic item found in the digestive tract of one specimen of Scomber scombrus .. 55

                                                                       7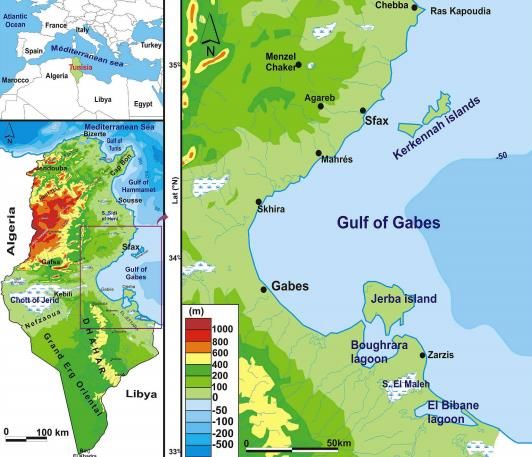
Figure 20. Percentage of mortality and immobilization of artemia nauplii after 24 and 48 h of
exposure to increasing concentrations of 1-4 µm fluorescent PE MPs ....................................... 57
Figure 21. Representative microscopy images of Artemia sp nauplii revealing MPs inside the
invertebrates after 48 h of the control and with exposure to 0.01and 1 mg/L.Error!                                              Bookmark
not defined.
Figure 22. Percentage of mortality and immobilization of Artemia sp. nauplii after 24 and 48 h
of exposure to increasing concentrations of 20-25 PE MPs ....................................................... 58
Figure 23. Closing the loop within the plastic economy, showing options for re-using, recycling
and recovering energy, within the globally-understood 3 Rs principle of Reduce, Re-use and
Recover ..................................................................................................................................... 61

                                                                       8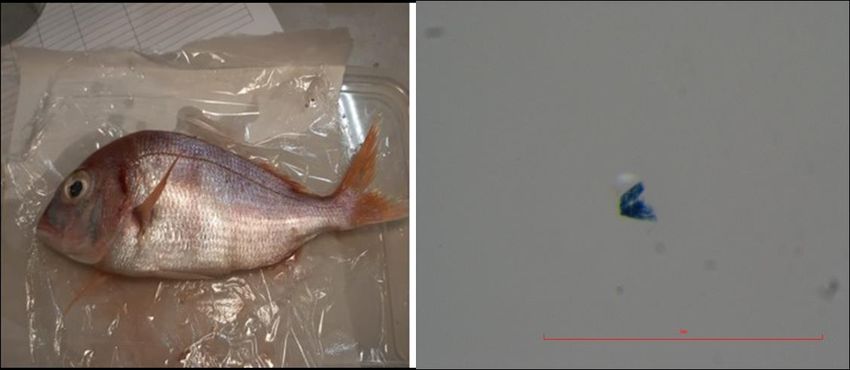
TABLES LIST

Table 1. Important dates in the history of plastic ......................................................... Error! Bookmark not defined.
Table 2. List of additives coumpounds used to make plastic fit for purpose .................. Error! Bookmark not defined.
Table 3. Most common synthetic polymers and their uses ...................................................................................... 17
Table 4. Specific densities of different polymer types commonly encountered in marine environment ..................... 23
Table 6. Station number, position (latitude and longitude) and sampling date of water sampleError! Bookmark not
defined.
Table 7. Dimensions and weight of the biota samples .................................................. Error! Bookmark not defined.
Table 8. Comparison of floating MP concentrations obtained in all previous studies performed in the Mediterranean
Sea ............................................................................................................................. Error! Bookmark not defined.
Table 9. Non plastic items found in all the analyzed samples ....................................... Error! Bookmark not defined.
Table 10. Percentage of mortality and immobilization observed in nauplii exposed to 1-4 µm fluorescent PE MPs
.................................................................................................................................. Error! Bookmark not defined.
Table 11. Percentage of mortality and immobilisation of Artemia sp. Nauplii exposed to 20-25 µm PE MPs .... Error!
Bookmark not defined.

                                                                              9
LIST OF ABBREVIATIONS AND SYMBOLS
CLAIM Cleaning Litter by developing and Applying Innovative Methods in European seas
MPs Microplastics
PE Polyethylene
PP Polypropylene
PS Polystyrene
PA Polyamide
PVC Polyvinyl Chloride
PETE Polyethylene Terephthalate
LDPE Low-Density Polyethylene
HDPE High-Density Polyethyleme
EVA Ethylene-Vinyl Acetate
CO2 Carbon Dioxide
ZnO Zinc Oxide
H2O Pure Water
H2O2 Hydrogen Peroxide
•OH Hydroxyl Radical
BPA Bisphenol A
PE Pagellus Erythrinus
SS Scomber Scombrus
ATR Attenuated Total Reflectance
FTIR Fourier Transform Infra Red Spectroscopy
AOP Advanced Oxidation Process
BDPs Biodegradable Plastics
UV Ultraviolet
UNEP United Nations Environment Program
FSW Filtred Sea Water
GPS Global Positioning System
SD Standard Deviation
mt Millions Tons
MTPY Million Tons Per Year
μm Micrometer
mm Millimeters
10cm Centimeters
g Grammes
INTRODUCTION
Plastic pollution is an emerging and growing threat across world oceans and it has been pointed
out as one of the most visible problems in Earth’s ecosystems. Global plastics production has
consistently increased over recent years and the amount of plastic produced in the world today is
170 times greater than it was 60 years ago, 335 million tons per year (MTPY) to be exact [1].
Thanks to its durability, low cost, and widespread application, plastic is a material of vast benefits
to society. Therefore, plastics production is likely to increase even further.
Once in the environment, plastics tend to break down into smaller debris called microplastics
(MPs), and they can be defined as ubiquitous plastic particles smaller than five millimeters (5 mm)
in size, of various shapes, color and polymer composition[2].
The biggest part of these MPs is found in the seas and oceans. In 2010, the amount of plastic waste
reaching the oceans was estimated between 4 to 12 MTPY, and without proper management
measures, the predictions indicate an increase by an order of magnitude by 2025[3].
With a size spectrum and buoyancy comparable to most planktonic organisms, MPs are likely to
be ingested by higher trophic level organisms (fish, bivalves) and could accumulate along the food
chain [4][5].
In the Mediteranean Sea, the MPs analyses are increasing on the last year but a significant data
gap can be identified expecially for what concerns South Mediterranean countries. To fill this gap,
and as part of CLAIM project, this study focuses on sampling and characterisation of MPs in the
Gulf of Gabes area in Tunisia which is a partner in CLAIM project and where data are still missing.
The main goals of the present study are:
Monitoring and assessment of MPs abundance in two environmental compartments (sea
surface water and marine biota) by determining MPs abundance, types, sizes, and polymer
composition.
Studying the effects of MPs on marine crustaceans represented by the brine shrimps
Artemia.
This manuscript consists of three chapters:
11The first chapter is a literature review that exposes the origin and the importance of plastics, the
problems caused by its excessive use, as well as the biodegradable alternatives of plastic. The
definition of MPs, their sources, categories and distribution in the aquatic environment is also
presented. Moreover, the threats of MPs to the environment and their treatment processes are
studied. Finally, results from previous studies on the MPs abundance in the Mediterranean are
listed in order to compare our results with previous ones.
The second chapter presents the sampling sites and details the methods of MPs sampling from
surface sea water. In addiion, it explains the experimental procedure starting from sample
handling, MPs separation from sea water and biota samples, and finally the characterisation using
Fourier-Transform Infrared Spectroscopy (FTIR ). Moreover, ecotoxicological tests are performed
in order to study the effects of two different sizes of polyethylene (PE) MPs on the marine
organisms represented by the Nauplii of the brine shrimp Artemia sp., which is considered as a
model extremophile organism offering a unique suite of adaptations.
The third chapter is devoted to results and discussion. It focuses on the distribution of MPs in
water and biota samples, according to their shape, size and polymeric nature. These results allows
better understanding of the situation of the Gulf of Gabes compared to other Mediterranean
countries. The effects of PE MPs on Nauplii of the brine shrimp Artemia sp. in terms of mortality
and immobilisation are also presented.
Finally, a conclusion will be made on all the executed work by opening the prospects for future
research.
12CHAPTER Ι – LITERATURE REVIEW
This chapter concerns the origin of plastics, the advantages and disadvantages of using it and its
degradation to MPs. In addition, it covers the types, categories, sources, distribution and threat of
MPs to the aquatic environment. Moreover, it presents the biodegradable alternatives to plastics
as well as the possible treatment technologies focusing on the photocatalytic device proposed by
CLAIM scientists.
I.1 Origin of plastics
Although the very first plastics, made from natural plastic materials such as rubber, chewing gum
and shellac were already made and used as early as 1600 BC and Middle Ages, the invention of
modern, synthetic plastic only started in the 1800s.
Parkesine (nitrocellulose) is considered the first man-made plastic. The plastic material was
patented by Alexander Parkes in Engand in 1856 and it was unveiled in the 1862. Parkesine was
made from natural cellulose (in the form of cotton or wood pulp) treated with nitric acid as a
solvant. The output of the process, commonly known as cellulose nitrate, could be dissolved in
alcohol and hardened into a transparent and elastic material that could be molded when heated. By
incorporationg pigments into the product, it could be made to resemble ivory.
1862 Alexander Parks invents and patents the first man-made plastic mateial, Parkesine
1869 Johhn Wesly Hyatt develops the first synthetic polymer when trying to find an
ivory subtitute
1905 Leo Baekeland creates the first fully synthetic thermoset, the first ‘real’plastic that
was used on a large scale
1920-1950 Many new kinds of plastic, such as Polystyrene (PS), Polyvinyl Chloride (PVC),
and polyethylene (PE) are discovered and mass produced
1954 Giulio Natta discovers Polypropylene (PP)
Table 1. Important dates in the history of plastic
The production and use of plastic materials have increased steadily since the start of the industrial
manufacturing in the 1950s. Plastic materials have become indispensable for numerous
applications in our everyday lives and are important in many sectors including the transportation,
electronics, construction, packaging, agriculture, food safety, health, hygiene and textile industies.
Figure 1. shows the increase in plastic demand from 2016 to 2017 for each polymer type.
13Figure 1. Plastic demand by type of resin (measured in millions tons)
It is very difficult to realise how important plastics have become to our everyday lives. We always
seem to know these materials, and we tend to take it for granted that they occur everyday and all
around us, for example in our clothing, the pen that we write with, the chair that we sit on or the
wrapping of the food that we eat.
It is sometimes hard to believe that plastics have only been commonly available for about the last
one hundred years. Yet in this time, the impact that they have made upon the quality of our lives
and on the products that we have access to has been enormous.
I.2 What are plastics and how they are made?
The word “plastic” comes from the greek word “plastikos” meaning “ to grow” and it can be
defined as a group of materials, either synthetic or naturally occuring that may be shaped when
soft and then hardened to retain the given shape. Plastics are polymers, and polymer is a large
molecule made of repeating smaller units called monomers.
These plastics can be derived from coal, natural gas, and, of course, crude oil. Crude oil is a
complex mixture of thousands of compounds and needs to be processed before it can be used.
Today, 4% of the world crude oil is used to make plastics. The production of plastics begins with
14drilling and extraction of oil from the reserves, after extraction, the oil is transported by either
pipelines or tanker to the refinery. In the refinery, a distillation column is used to separate the
heavy crude oil into groups of lighter component, called fractions. Each fraction is a mixture of
hydrocarbon chains which differ in term of the size, weight and boiling temperature. One of these
fractions, naphta, is heated by process called steam cracking which breaks it down further into a
number of products: ethylene, propylene, benzene and many others. All these products are
processed further in petrochemical plants using polymerisation in order to produce PE, PPand PS
in the form of pellets. These plastic pellets, also known as nurdles, are the raw material used in the
manufacture of plastic products such as drink bottles, caps and food containers.
Figure 2. Crude oil to plastic production process
The basic polymer is always incorporated with different “additives”. Additives are chemical
compounds added to improve the performance, functionality and ageing properties of the polymer.
These additives can be mainly divided into the following 4 categories [6]:
1. Functional additives (stabilizers, antistatic agents, flame retardants, plasticizers,
lubricants, slip agents, curing agents, foaming agents, biocides, etc.)
2. Colorants (pigments, soluble azocolorants, etc.)
3. Fillers (mica, talc, kaolin, clay, calcium carbonate, barium sulphate)
4. Reinforcements (glass fibers, carbon fibers, etc.)
15The most commonly used additives are listed in table 2. Each of them plays a distinct role in
delivering/enhancing the final functional properties of a plastic product.
Additive coumpounds Function
Plasticisers Used for improving the flexibility, durability and stretch
ability of polymeric films
Antioxidants Delay the overal loxidative degradation of plastics if/when
exposed to ultraviolet (UV) light
Heat stabilizzers Prevent thermal degradation of polymers when exposed to
elevated temperatures i.e. during the thermal processing of
foods
Slip agents Reduce the surface coefficient of friction of a polymer
Table 2. Use and application for most common additives
Most plastics contain 0-50% of additives and the average content is 20% by weight of the polymer.
The additives are not covalently bonded to the polymer, so they can leach out of the plastics as
they degrade and enter into the marine environment [7].
I.3 Advantages and disadvantages of using plastic products
Plastics may seem the perfect material for any kind of market. First of all, it is inexpensive, durable
and very resistant. Also, plastic is easy to work and shape, making it suitable for a great variety of
usages. These characteristics made plastic the most used material in industry.
Plastics are important in our society providing a range of benefits for human health and the
environment [8]. For example:
Plastic packaging protects food and goods from getting wasted and/or contaminated,
thereby saving resources.
The light weight of plastic packaging compared to other materials saves fuel and decreases
emissions during transportation.
Plastic water supply systems and storage containers/tanks can provide clean water.
Low-density plastic materials, used as replacements for metals or ceramics in cars and
aircraft, save fuel and decrease emissions.
Plastic protective clothing and safety equipment (e.g. fire proof materials, helmets, airbags)
prevent injuries.
Plastic products for medical applications contribute to improved heath (e.g.blood pouches,
tubings, disposable syringes, prosthesis).
16In Europe, the use of plastics is mostly dominated by packaging(38%), followed by building and
construction (21%), automotive (7%), electrical and electronic (6%), and other sectors (28%), such
as medical and leisure [9].
Table 3 summurize the most commun synthetic polymers and their uses.
Polymer Monomer Resin Uses
identification
code
Polyethylene Soft drink bottles, solar cells,
terephtalate food packaging (microwavable
(PETE) meals)
High density Plastic chairs and tables, vehicle
polyethylene fuel tanks, detergent bottles
(HDPE)
Polyvinyl chloride Raincoats, automobile seat
(PVC) covers, electricity pipes
Low-density Plastic bags, computer hardware
polyethylene covers, dispensing bottles
(LDPE)
Polypropylene Bottle caps, fishing nets, plastic
(PP) cups
Polystyrene Laboratory ware such as Petri
(PS) dishes, CD case, trays, styrofoam
packaging
Table 3. Most common synthetic polymers and their uses
Despite the appealing characteristics of this material, the downsides connected to the usage of
plastics are many and the greatest enviromental concern is its disposal. Large volumes of plastic
wastes are generated, mainly due to the short life span of many plastic products (it is estimated
that approximately 40% of plastic products have a service life of less than 1 month)[10]. This large
waste creates serious environmental and management problems. In fact, plastic is never
17biodegradable and as such its end-of-life disposal is particularly delicate. Plastic can go through
photo-degradation, meaning that in a time span of 450 to 1000 years, it can disappear by being
exposed to the sun. When plastics are under water, this process will take even longer because
sunlight has difficulty penetrating. Figure 3 displays the degradation rate of everyday plastic items
found in the marine environment.
fi
Figure 3. Estimated number of years for selected items to bio-degrade in a marine
environment
Furthermore, there is a wide range of types of plastic and not all of them can be recycled, and even
when they can be recycled, the process is complicated, expensive and it decreases its quality over
time. According to UNEP (United Nations Environment Program), between 20% and 40% of the
world’s plastic waste are thrown in landfills where they occupy valuable space and pollute the
environment. In the figure below, the industries that produce the largest amounts of plastic waste
are showen. Packaging, for example, has a very short “in-use” lifetime (typically around 6 months
or less). This is in contrast to building and construction sectors, where plastic use has a mean
lifetime of 35 years[11]. The packaging sector is therefore the dominant generator of plastic waste,
responsible for almost half of the global total.
18Figure 4. Global plastic waste generation by industrial sector, measured in tonnes per year
I.4 Biodegradable alternatives to plastic
Most synthesised polymers are not biodegradable under normal environmental conditions.
Degradation will occur under favourable conditions, such as higher temperatures, physical
abrasion and exposure to UV radiation, with the rate dependent on the type of polymer and
presence of stabilising compounds, but this leads simply to weakening and fragmentation.
New polymers meant to either biodegrade or to last longer would reduce waste. Biodegradale
plastics (BDPs) refer to polymeric materials that can break down in the environment into naturally
occurring components, not just smaller pieces of themselves. BDPs are used for disposable items,
such as packaging and pots. In principle, they could replace many applications for petroleum-
derived plastics, however cost and performance remain problematic. (The cost of BDP polymers
fall in the range of 2–5 €/Kg compared with approximately 1.2 €/Kg for major petrochemical
polymers)[12].
Types of biodegradable plastics include: starch-based plastics, cellulose-based plastics and
protein-based plastics.
The most versatile base material is starch, produced by plants. Starch is a polysaccharide,
consisting of linked glucose molecules, and is used as an energy store in plants. It is one of the
19most important forms of carbohydrate in the human diet. Common sources of starch include rice,
maize, wheat and potatoes.
Figure 5. Starch molecule structure
Starch-based plastics have increased in relevance with the introduction of improved resin grades,
their ability to blend with other biopolymers and an increasing number of suppliers. In fact, starch-
based bioplastics are widely employed in the medical industry because of their biocompatibility,
low toxicity, degradation properties and mechanical properties.
Because starch polymers on their own are brittle at room temperature, flexibiliser
and plasticiser such as sorbitol and glycerine can be added in a process called starch gelatinization
to augment its crystallization; so the starch can also be processed thermo-plastically. The
characteristics of the resulting bioplastic can be tailored to specific needs by adjusting the amounts
of these additives. While all starches are biodegradable, not all plasticizers are. Thus, the
biodegradability of the plasticizer determines the biodegradbility of the starch blend.
There are significant downsides. Thermoplastic starch usually needs to be mixed with small
amounts of polyester, often derived from petrochemical processing, to achieve the same material
performance as plastic. Some polyesters can be broken down with certain bacteria, but others
simply break into smaller pieces as conventional plastic does.
Even if all single-use plastic were biodegradable, however, there simply isn’t enough composting
infrastructure available to handle it all.
20I.5 Microplastics definition and categories
When plastics enter the environment, and due to mismanagment and improper disposal, they are
subjected to physical, chemical and biological degradation processes that will transform them into
smaller fragments classified as "microplastics”[13].
The degradation occurs through exposure to ultraviolet radiation from the sun, abrasion or by the
action of washing synthetic nylon or polyester clothing which can release thousands of plastic
fibers into wastewater [14].
The term “microplastics” was first used in 2004 to describe tiny fragments of plastic in the water
column and in sediments[15]. Nowdays, in general contexte, MPs is used as collective term to
desribe a heterogenous mixture of particles up to 5 mm in size, including particles of various
shapes from completely spherical to elongated fibers.
This study deals with micro sized plastics and their presence in the marine environment.
MPs are themselves divided into two categories, primary MPs and secondary MPs.
The distinction between primary and secondary MPs is based on whether the particles were
originally manufactured to be that size (primary) or whether they have resulted from the
breakdown of larger items (secondary)[16]. Examples of primary MPs include resins pellets (used
within the plastics industry for transporting the raw material), industrial abrasives and abrasives in
personal care products such as toothpaste. Examples of secondary MPs include fibers from
synthetic textiles, dust from vehicles tires and fragments from the wide variety of plastic object in
everyday use, including fishing nets, containers and packaging.
This distinction is useful since it can help to indicate potential sources and identify mitigation
measures to reduce their input to the environment
I.6 Sources of microplastics
Sources of marine litter are traditionally classified as either land-based or sea-based, depending on
where the litter enters the water. They can enter directly into the marine environment by
commercial and recreational fishing which rejects monofilm lines plastic and nylon nets. These
types of plastics generally have neutral buoyancy and can reach the bottom. Ships also contribute
significantly to marine litter by dumping plastic packaging materials, as well as marine industries
(such as aquaculture, oil rigs and power generating boats). Additionally, coastal tourism and
21coastal landfills play an important role as a source of MPs which through lack of management and
maintenance, can bring waste into the marine environment.
Another notable source of plastic debris is the enviromental action. As plastic waste and debris
floats around the ocean, they are exposed to the elements of harsh solar radiation and constant
abrasion from the action of wind and water waves. Over time, these elements break down the
plastics into smaller chunks of debris and the cycle continues on and on until the remainng debris
become microscopic[14].
While enviromental action is the most common way that micoplastics are formed, the other
relevant means comes from intentional human production of small beaded plastics. These have
found use in the skin care and hygiene industry where small plastic microbeads are added to
products such as shower gels and facial scrubs to increase their abrasive qualities and ensure that
they provide proper exfoliation and cleaning.
Other source of MPs come in the shape of microfibers which unlike beads, are longer. They are
product of human clothing and when one washes plastic clothing, it sheds microplasic fibers into
the water, approximately 1900 fibers can be released in the water in a single wash [17].
Figures 6 lists the top 10 sources of MPs generated in Germany measured by grammes produced
by each person every year (g/person/year).
Figure 6. Top 10 sources of microplastics in Germany measured in g/person/year
22Although, the major sources of microplastics are land based, in general, it is extremely difficult to
confidently identify and point out the ultimate sources of MPs because of their fragment nature,
small size, varying sources and their ability to travel long distances before being deposited onto
shorelines or settling on the bottom of the sea or ocean.
I.7 Distribution of microplastics in the aquatic environment
Plastics do not always behave the same way, and that is why it is hard to know generacially their
final destnation in the marine environment. Polymers that have a lower density than seawater will
tend to float in the water column while those that are denser will sink to the bottom. The density
of sea water ranges from about 1.02 to 1.03 g.cm-3 depending on the salinity, depth and temperature
variations[18]. Table 4 and figure 7 illustrate which polymers tend to float and which tend to sink
in the ocean. As seen in the table, PE ( HD and LD) and PP are floating on water surface which
suggest that they will be the most abundant MPs types detected on the sea water surface.
Table 4. Specific densities of different polymer types commonly encountered in marine
environment
23Figure 7. Schematic of which synthetic polymers tend to float and which tend to sink in the
ocean, image from GRID-Arendal (2016).
However, Several variables, that are more or less studied, can modify the density and therefore,
even low density plastics can reach the seabed [19,20]. MPs of similar types were found in the
water column and sediments[21,22]. These variables include:
Change of the buoyance by accumulation of organism on immersed surface (biofouling)
Fragmentation rate (size distribution)
Conditions of the marine environment (circulation of water, tides, wind, etc.)
Degradation rate (persistence)
Influence of hot-spots and proximity to populated areas.
I.8 Threat of microplastics to the aquatic environment
Plastics present clear risks for the environment, leading to the death of countless fishes and birds.
The color of the MPs can potentially contribute to the likelihood of ingestion, because of the
similarity between prey[29]. These MPs can reach the highest levels of a marine food web, such
as sea turtles, fulmar, and sea lions by direct ingestion or by trophic transfer through fish that have
consumed MPs [30].
24The ingestion of MPs can influence marine animals in different ways (figure 8). It can affect to the
ammune system, both chemically (caused by the substances that MPs may contain, absorb or
release, which may be toxic) or physically by blocking the digestive organs and preventing the
animals from feeding.
One example on the effect of MPs, in oysters, PS cause a decrease in the number of oocytes, the
diameter and speed of sperm which affect their reproduction [31], they can also cause ulcers, signs
of liver stress and obstructions in the digestive tract, which can cause satiety, starvation or even
death of fish [32].
Additives used in the production of plastics, such as bisphenol A (BPA), accumulate in aquatic
species through the process of bioaccumulation, causing disruption of the endocrine system.
MPs have the capacity to absorb lubricating oils, heavy metals and toxins present in water and
during ingestion in aquatic organisms can be desorbed and accumulated in adipose tissue [33].
Figure 8. Principal effects of microplastics on marine fish
It’s not only animal consumption of plastic and ocean well-being that is causing grave concern.
Plastic is also increasingly contributing to climate change. A 2019 report by the TearFund states
25that global plastic production emits 400 mt of greenhouse gases each year. Moreover, a study from
the University of Hawaii found that plastic is known to release a variety of harmful chemicals as
it breaks up. When exposed to solar radiation, the most commonly used plastics produce two
greenhouse gases, methane and ethylene. Methane alone is roughly 30 times more potent a heat-
trapping gas than carbon dioxide[34].
I.9 Are microplastics affecting our health?
Currently there is no clear evidence whether microplastics have a serious effect on humans as it
does on marine organisms, as the level of microplastics ingested is not at sufficient concentrations
to cause the same issues as it does in marine animals. (One reason is for this is because MPs remain
in the guts of fish and do not move into muscle tissue, which is what we eat).
The highest concentration of MPs in the food chain appear to be in fish, particularly shellfish. But
since little is known about how MPs affect health, it is not necessary to avoid shellfish entirely.
Chemically speaking, the plastics themselves are generally inert and have minimal effect on human
health. However, it’s the other substances attached to them that could be more concerning.
Chemical additives added to plastics, toxic chemicals sorbed to MPs and harmful pathogens
attached to the MPs have the potential to negatively affect human health[35].
Table 5. Effects of the constituents of microplastics on human health
26Table 5 lists the effects of the most common plastic monomers and additives.
PVC for example, contains plasticizers such as phthalates and BPA. BPA is one of the best studied
chemicals found in plastic and it is usually found in plastic packaging or food storage containers.
BPA doesn’t remain in the plastic but leaches out and migrates into adjacent substances like water,
food or even saliva. Some evidence has shown that BPA can interfere with reproductive hormones,
especially in women causing human health problems such as prostate cancer, type-2 diabetes,
obesity and cardiovascular disease.
In addition, phthalates, a chemical used to make plastic flexible, have shown to increase the growth
of breast cancer cells. However, this research was carried out in a petri dish, so the results can’t be
generalized to humans[36].
Microparticles including MPs have shown to pass from the intestines into the blood and potentially
into other organs[32]. The figure below explain how the body interact with the plastic particles
according to their size.
Figure 9. An example on how consumed plastic particles could interact with our body
27I.10 Microplastics treatment technologies
The last decades have shown a reevaluation of the environmental pollution issue. Reducing the
amount of pollutants in water remains the main goal of the most of nations in order to reduce the
diseases caused by water pollution. Stop throwing the plastic garbage away, buy environment-safe
cleaning products and reduce the amount of insecticides and pesticides used in agriculture are the
main ideas that came to the mind to minimize the water pollution. However, since wastewater from
industries and sewage are the main sources that affect and can significantly increase the rate of
water pollution, and since the microplastics are not readily visible to the naked eye, the
development of effective and affordable technologies to treat these pollutants is therefore the
effective way to reduce the rate of pollution.
In the past, several physical techniques like coagulation, flocculation, sand filtration, adsorption
on the activated carbon, and chemical methods like photosensitized oxidation, adsorption [37-40],
have been used to reduce the toxic effluents from waste water [41-44]. However, the main
drawback of these techniques is formation of secondary waste product which can not be treated
again and dumped as such [45,46]. Therefore, attention has been focused on the oxidation of
organic compounds to harmless products such as carbon dioxide (CO2) and water (H2O) using the
Advanced Oxidation Processes (AOP). In fact, through these processes, the polluting molecules
can be destroyed in an effective and sustainable way.
AOPs are chemical – physical systems which have been developed as new technologies for water
purification. AOPs make use of different types of energy such as ultrasounds, UV light ( with
photocatalysts like zinc oxide ZnO) and ionizing radiation to generate a number of reactive species
that attack toxic pollutants in wastewaters. Among the reactive species produced by the AOPs,
hydroxyl radical (•OH) plays a major role, it reacts unselectively once formed and contaminants
will be quickly and efficiently fragmented and converted into CO2 and H2O.
The main AOP is photocatalysis and it is based on the activation of a photocatalyst by the action
of irradiation with an appropriate wavelength.
Photocatalysts are usually semiconductors. Photoexcitation with light of energy greater than the
semiconductor band-gap promotes an electron from the valence band to the conduction band, and
leaves an electronic vacancy or hole (h+ ) in the valence band. The hole is highly oxidative and
quickly reacts with organic molecules adsorbed on the photocatalyst surface leading to their
degradation.
28The team of CLAIM scientists relied on the photocatalysis principal to develop a small scale
photocatalytic nanocoating device. This device will speed up UV-fueled degradation and
breaking down of MPs into harmless elements.
Other innovative technologies developed by CLAIM include pyrolizer and Ferrybox.
Mounted on ships, a small-scale thermal treatment device (pyrolizer) will be used for energy
recovery from collected litter on board ships and ports.
Additionnally, a method to measure microlitter on board ships (Ferrybox) will operate on ships
in the Baltic, West & East Mediterranean mounted with an automated seawater sampling device
and passive flow-through filtering system.
The proposed cleaning technologies and approaches prevent litter from entering the sea at two
main source points, wastewater treatment plants and river mouths. Effectiveness of developed
devices and methods will be demonstrated under real conditions.
I.11 The Mediterranean: one example of the impact of marine microplastics
The Mediterranean Sea has been described as one of the areas most affected by marine litter in the
world. Being semi-enclosed, it is even more vulnerable to plastic pollution than the Ocean. Its
water has a 90 year renewable period and plastics persist for periods in excess of 100 years.
The Mediterranean Sea accounts for 7% of the world’s microplastic waste, yet 1% of its water.
And in this area, a high concentration of floating debris has been reported with the majority of
objects counted (from 60 to 70%) in the form of plastic pieces [34].
In 2016 a study was carried out in Turkey for the detection of MPs in fish and in seawater. In 28
different species, 58% of the total fish had an average of 2.36, and 41% had an average of 1.80
particles per fish. The quantity of MPs in the water samples collected at 18 locations on the coast
Mediterranean Turkey was between 16,339 and 520,213 MPs per km2 with a dominance of blue
plastics [35].
In the same period, in 2016, another study was done in Palestine in order to detect MPs in seawater;
samples were taken at 17 locations on the Mediterranean coast of Palestine. MPs were found in all
samples with an average of 1,518,340 particles/km2 with a dominance of clear colors such as white
and transparent plastics [30].
There is no significant data about the presence, quatification and qualification of MPs in the Gulf
of Gabes area, that’s why in this study, we will cover this area of the Mediterranean Sea.
29CHAPTER II - MATERIALS AND METHODS
This chapter is diveded into two parts, the first part presents the sampling sites, details the methods
of microplastic sampling, sample handling and characterisation in water and biota samples. In the
second part, the ecotoxicological tests performed in order to study the effects of MPs on the marine
organisms are presented.
II.1 Zone of study and sampling sites
In this project, studies focus on assessing the MPs abundance in the Gulf of Gabes area. The gulf
is 100 km long and 100 km wide and is bounded by the Kerkennah Islands on the northeast and
by Jerba Island on the southeast.
Figure 10. localization of the Gulf of Gabes
The Gulf of Gabes is the only part of the Mediterranean with a substantial tidal range causing the
uncovering of extensive sandbanks at low water. It is also considered highly productive,
30contributing approximately 40% of the national fish production in Tunisia [47]. Both Gabes and
Sfax are major ports on the gulf, supporting sponge and tuna fisheries, with Gabes being the
economic and administrative center.
To asses MPs in this area, 6 stations are selected for sea water sampling (figure 11, table 6). The
stations are located near ports and rivers which are considered as main sources point for the entry
of MPs to the sea.
Station 7 and 8 are located close to Gabes port: station 8 is very close to the port while
station 7 is …. Km away
Station 4 is located in the estuary of .. river and station 5 is … km away
Station 16 is located in the estuary of .. river and station 17 is … km away
Figure 11. Map showing the locations of the sampling stations
31Sample ID Station 4 Station 5 Station 7 Station 8 Station 16 Station 17
Start time 13h55 14h37 11h24 12h06 09h25 09h59
Start latitude N34°00'386'' N 34°00'494'' N33°55'507'' N33°56'691'' N 33°46'789'' N 33°47'769''
Start longitude E010°03'449'' E010°05'959'' E010°07'044'' E010°08'33'' E 010°15'701'' E 010°16'824''
Stop time 14h10 14h55 11h39 12h21 09h40 10h14
Stop latitude N34°00'588'' N 34°00'397'' N33°56'248'' N33°57'185'' N 33°47'354'' N 33°48'284''
Stop longitude E010°04'353'' E010°06'858'' E010°07'863'' E010°09'148'' E 010°16'384'' E 010°17'442''
Volume filtered 240 231 301 254 246 215
(m3)
Table 6. Station number, position (latitude and longitude) and sampling date of water
samples
II.2 Samples collection
II.2.1 Sea water sampling procedure
Microplastics sampling on the sea surface by manta net is a widely used method for the sampling
of microplastics on the sea surface, but to date there has been no unified methodology. In this
study, we report the procedure for manta net sampling.
In April 2019, water samples were collected using a 330 μm mesh size towed manta net having
the dimension of the opening of 25x65 cm following the below sampling procedure [48]:
1. Deploy the net out of the wake zone (approximately 3 to 4 m distance from the boat) in
order to prevent collecting water affected by turbulence inside the wake zone (figure 12,A)
2. Write down the initial GPS coordinates and initial time in the data sheet
3. Start to move in one straight direction for approximately 15 minutes and begin the time
measurement.
4. After 15 minutes, stop the boat and write down final GPS coordinates, the length of the
route (the most correct way is to calculate the length from the GPS coordinates) and the
average boat speed into the data sheet provided and lift the manta net out of the water.
325. Rinse the manta net thoroughly from the outside of the net with seawater using water from
the boat water reservoir. Rinse in the direction from the manta mouth to the cod end in
order to concentrate all particles adhered to the net into the cod end (figure 12,B)
6. Safely remove the cod end and the materials retained is carefully transferred into new
plastic bottles. Rinse the cod end thoroughly from the outside and pour the rest of the
sample through the sieve. Repeat this step until there are no longer any particles inside the
cod end (figure 12,C)
7. Close the bottle, label the lid and outside of the jar with the sample name and date with
waterproof marker
8. Unless required, remove large pieces (algae, wood, organisms such as jellyfish) from the
sample. Rinse them thoroughly with water from a wash bottle to ensure that all plastic is
retained.
Figure 12. Sea water sampling steps: (A) manta net is deployed in water, (B) the net is
recovered, held vertical and washed into the cod end, (C) the cod end is removed and
rinsed using filtered sea water.
II.2.2 Biota samples collection
The fish samples studied were not sampled directly from the sea, they were purchased in May
2019 from the market of Gabes.
The samples consist of 20 commercially available fishes: 10 Pagellus erythrinus (PE) and 10
Scomber scombrus (SS) specimens
33PE is a popular food fish in Mediterranean countries, with delicate white flesh. It has a slim,
oval body, with a smallish mouth and scales covering its face (figure 13,A). It is silver in colour
with a pink tinge, particularly on its back. A typical specimen measures 10–30 cm.
SS are found in the Mediterranean Sea, the Black Sea, and the northern Atlantic Ocean. it has an
elongate body with a long, pointed snout (figure 16,B). SS is a highly commercial species and it is
sought after for its meat, which is strong in flavor and high in oil content and omega-3 fatty acids
among other nutrients. Nearly 1 million tonnes this specie are caught each year globally, and it is
sold fresh, frozen, smoked, or canned.
Figure 13. The fish samples studied (A: Pagellus erythrinus and B: Scomber scombrus)
PE sample PE1 PE2 PE3 PE4 PE5 PE6 PE7 PE8 PE9 PE10
ID
Total length 19.2 19.9 18.9 19.9 18.6 18.9 19.7 19.8 19.1 19.4
Standard 14.9 15.6 14.6 15.8 15.7 15.2 15.8 15.9 14.9 15.3
length
Total weight 79.3 104.88 81.16 92.55 78.72 78.92 95.67 97.99 84.73 86.18
Weight 75.72 93.39 78.83 86.91 74.7 77.92 91.47 93.35 79.41 82.45
without guts
SS sample ID SS1 SS2 SS3 SS4 SS5 SS6 SS7 SS8 SS9 SS10
Total length 18.3 18.3 18.9 18.4 18.8 18.9 19.7 18.9 19.4 18.6
Standard 16.9 17.9 17.8 16.2 16.9 16.4 17.2 16.6 16.7 16.4
length
Total weight 66.23 66.3 44.75 50.38 59.4 56.21 60.86 57.3 55.91 48.12
Weight 60.44 59.16 40.78 46.47 54.63 51.84 55.88 51.36 51.4 44.01
without guts
Table 7. Dimensions and weight of the biota samples
34You can also read