SOURCES OF IR RADIATION IN THE EARTH'S ATMOSPHERE IN CONNECTION WITH THE PETA EFFECT - SCIENTIFIC RESEARCH PUBLISHING
←
→
Page content transcription
If your browser does not render page correctly, please read the page content below
Optics and Photonics Journal, 2021, 11, 152-196
                                                                                             https://www.scirp.org/journal/opj
                                                                                                        ISSN Online: 2160-889X
                                                                                                          ISSN Print: 2160-8881

Sources of IR Radiation in the Earth’s
Atmosphere in Connection with
the PeTa Effect

Vitali A. Tatartchenko

CNRS, University of Aix-Marseille, Marseille, France

How to cite this paper: Tatartchenko,         Abstract
V.A. (2021) Sources of IR Radiation in the
Earth’s Atmosphere in Connection with the     The PeTa (Perelman-Tatartchenko) effect is the radiation of the energy of a
PeTa Effect. Optics and Photonics Journal,    first-order phase transition during the transition from a less condensed phase
11, 152-196.
                                              to a more condensed one. The effect was independently discovered by M.
https://doi.org/10.4236/opj.2021.116013
                                              Perelman and the author of this paper. Six papers on the PeTa effect have
Received: May 6, 2021                         been published in this journal over the past nine years. They are devoted
Accepted: June 26, 2021                       to the development of PeTa models to explain the following phenomena:
Published: June 29, 2021
                                              IR radiation from cold surfaces, cavitation luminescence/sonoluminescence
Copyright © 2021 by author(s) and             (CL/SL), laser-induced bubble luminescence (LIBL), and vapor bubble lumi-
Scientific Research Publishing Inc.           nescence (VBL) in underwater geysers. This paper describes the sources of
This work is licensed under the Creative
                                              PeTa radiation in the Earth’s atmosphere. These sources of infrared radiation
Commons Attribution International
License (CC BY 4.0).                          have been investigated by numerous research groups, but their interpretation
http://creativecommons.org/licenses/by/4.0/   either does not exist at all, or it is erroneous. The following phenomena are
               Open Access                    specifically considered: PeTa radiation during the formation of clouds and
                                              fog; a pulse laser based on the PeTa radiation; condensation explosions as
                                              sources of PaTa radiation; measurement of the concentration of water vapor
                                              in the atmosphere using PeTa radiation; atmospheric scintillation of infrared
                                              radiation in the atmosphere due to the PeTa effect; PeTa radiation as a source
                                              of comfort for the igloo; the influence of PeTa radiation on living organisms;
                                              PeTa radiation due to characteristics of tropical storms; PeTa radiation as a
                                              possible precursor to earthquakes. The problem of global warming, which
                                              worries everyone, as it turns out, is also associated with the PeTa effect.

                                              Keywords
                                              PeTa (Perelman-Tatartchenko) Effect, Sources of PeTa Radiation in the
                                              Earth’s Atmosphere, Pulse IR Laser, Condensation Explosions, Atmospheric
                                              IR Scintillations, Tropical Storms, Earthquakes, Global Warming

DOI: 10.4236/opj.2021.116013 Jun. 29, 2021                      152                               Optics and Photonics Journal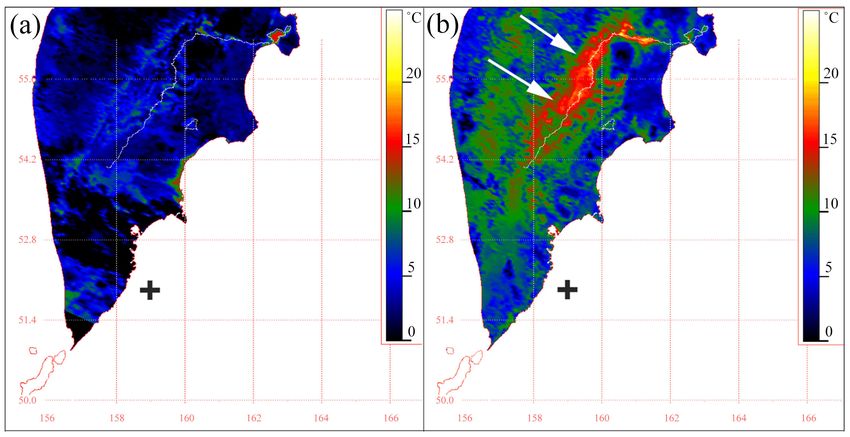
V. A. Tatartchenko
1. Introduction
The PeTa effect is the radiation of the energy of a first-order phase transition
during the transition from a less condensed phase to a more condensed one. M.
Perelman as well as the author of this paper identified the effect independently.
Prior to the work of these researchers, it was believed that this energy can be
removed only through heat conductivity. M. Perelman predicted the effect theo-
retically [1]. V. Tatartchenko proved its existence experimentally during the
crystallization of several alkali halides [2] [3] and sapphire [4]. The experimental
results of V. Tatartchenko were published with a great delay due to the strong
resistance of opponents of this effect. In 2010, M. Perelman died. In memory of
Professor Perelman, the term PeTa (Perelman-Tatartchenko) effect is used in
this paper as suggested in the discussion of this problem in the journal “New
scientists” [5].
Six papers devoted to the PeTa (Perelman-Tatartchenko) effect have been
published in this journal over the past nine years. They are devoted to the de-
velopment of PeTa models to explain the following phenomena: IR radiation
from cold surfaces [6] [7], cavitation luminescence/sonoluminescence (CL/SL)
[8], laser-induced bubble luminescence (LIBL) [9] [10], vapor bubble lumines-
cence in underwater geysers (VBL) [11]. This paper describes the sources of
PeTa radiation in the earth’s atmosphere.
The following phase transitions with the participation of water vapor, water,
and ice can occur in the earth’s atmosphere: 1) Condensation of water vapor
with the formation of clouds and fog; 2) Freezing of water droplets with the
formation of the hail; 3) Deposition of water vapor with the formation of snow;
4) Condensation of vapor on the surfaces of tiny water droplets that are too
small to form fog; 5) Evaporation from the surface of these small droplets. The
first four processes occur with the emission of PeTa radiation. In the simplest
cases, the wavelength of PeTa radiation can be estimated by formulas (3)-(5)
from [8] and (5) from [9]. Estimates made using these formulas show that for
our case, PeTa radiation lies mainly in the IR range, in the atmospheric transpa-
rency window of 6.5 - 14 µm.
In 1990, R. Lindzen, Professor of Meteorology at MIT, wrote: “Water vapor in
the atmosphere contributes 60% - 70% of the greenhouse effect, while carbon
dioxide contributes 25%…Given the predominant role of water vapor in tro-
pospheric radiation…it is clear that our current knowledge of the behavior of
water vapor does not correspond to the existing task” [12]. This paper shows
that the PeTa effect can explain many hitherto incomprehensible phenomena in
the Earth’s atmosphere: IR radiation during the formation of clouds and fog (§
2); IR radiation recorded by sensitive radiometers from satellites (§ 3); Conden-
sation explosions (§ 4); Measurements of the concentration of water vapor in the
atmosphere due to the IR radiation (§ 5); Atmospheric IR scintillations (§ 6); IR
radiation and living organisms (§ 7); IR characteristics of tropical storms (§ 8);
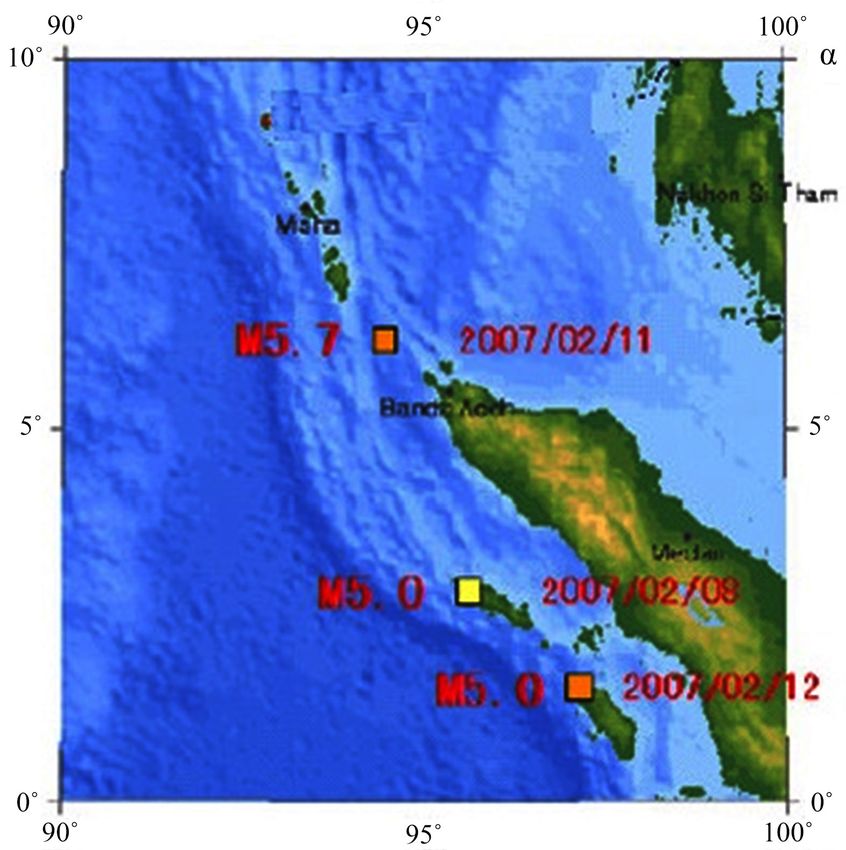
VBL—vapor bubble luminescence (§ 9); IR radiation preceding earthquakes (§
DOI: 10.4236/opj.2021.116013 153 Optics and Photonics Journal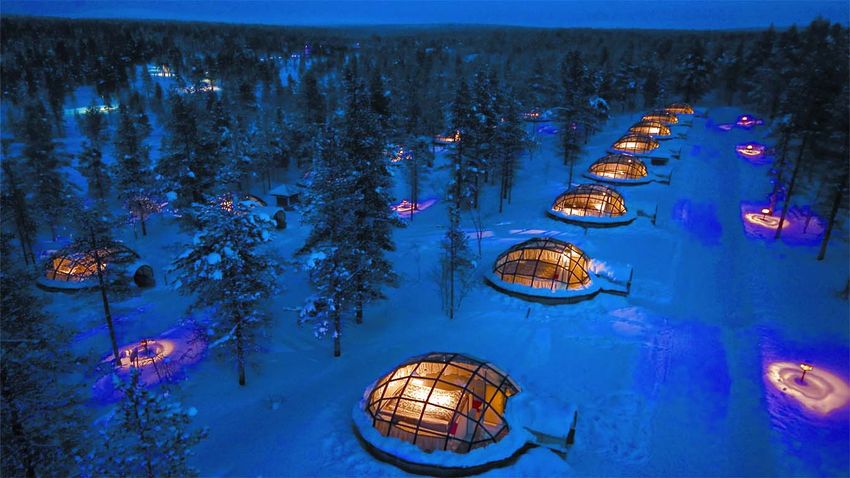
V. A. Tatartchenko

                               10); PeTa effect and global warming (§ 11). Thus, our knowledge of the behavior
                               of water vapor will be greatly expanded.

                               2. IR Radiation during the Formation of Clouds and Fog
                               In [13], the authors reported that they have developed an infrared camera that
                               scans an object linearly in three separate spectral ranges simultaneously and
                               creates an image of the object in the form of a color photograph. Three detec-
                               tors: Si, InSb, and Ge were respectively used for the following spectral regions:
                               0.5 - 1.0 µm, 3.0 - 5.5 µm, and 8 - 14 µm. The last two detectors were cooled with
                               liquid nitrogen. Each of the infrared spectral bands mentioned above has been
                               displayed in one of the colors: blue, green, and red, respectively. As a result, ac-
                               cording to the authors, the color of the objects in the picture indicates their rad-
                               iation temperature, as well as their reflective and radiative properties. Several
                               images presented by the authors (Figure 8a, b from [6]; Figure 1(a), Figure 1(b)
                               and Figure 2(a), Figure 2(b)) suggest that they actually detected atmospheric
                               sources of infrared radiation, which are in the range of 8 - 14 μm and cannot be
                               associated with either temperature or reflected radiation.
                                 These sources correspond to the underside of forming (Figure 8a, b from [6])
                               and dissipating (Figure 1(a), Figure 1(b)) cumulus clouds with a temperature of
                               −5˚C and rising warm air saturated with water vapor (Figure 2(a), Figure 2(b)).
                               On dry, clear days, the last radiation was not so obvious. It should be noted that
                               the authors did not find unusual IR radiation either in the 0.5 - 1.0 µm range or
                               in the 3.0 - 5.5 µm range. Nichols and Lamar write: “The true origin of the 8 - 14
                               micron radiation is unknown.” Nevertheless, PeTa emission during cloud (Fig-
                               ure 8a, b from [6]) or fog (Figure 2(a), Figure 2(b)) formation, as well as
                               dispersion of cumulus clouds (Figure 1(a), Figure 1(b)), is the only obvious
                               plausible explanation for this phenomenon.
                                 It is surprising that these interesting studies, carried out more than 50 years
                               ago, have not been developed. This is probably because PeTa radiation exists
                               only during condensation, i.e. during the formation of clouds, while the clouds
                               reflect the long-wave radiation coming from the earth’s surface into space both
                               during its formation and after. This process masks the PeTa effect. But even on
                               the basis of work [13], it can be said that the study of the radiation of clouds in
                               the spectral range of 8 - 14 µm and the comparison of this radiation with radia-
                               tion in other spectral intervals could clarify the problem.
                                 However, it is interesting to know what modern meteorology has to say about
                               the effect of clouds on the earth’s radiation balance. This effect is called radiative
                               forcing [14]. Quantification of the global distributions of cloud radiative forcing
                               was obtained from the Earth Radiation Balance Space Experiment (ERBE),
                               which began in 1984. In April 1985, it was found that the reflection of shortwave
                               solar radiation was −44.5 W/m2. At the same time, the reflection of long-wave
                               radiation from the earth (greenhouse effect) was 31.3 W/m2. Thus, the clouds
                               had a pure cooling effect on the earth.

DOI: 10.4236/opj.2021.116013                        154                                  Optics and Photonics Journal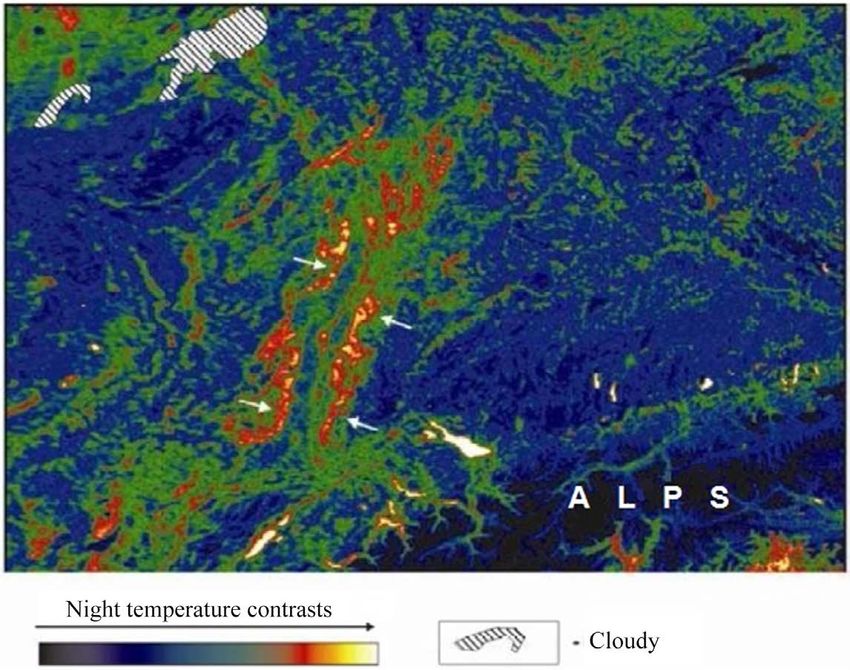
V. A. Tatartchenko

                                                   (a)                                       (b)

                                Figure 1. From [13]. Photographs of a scattering cumulus cloud in different wave-
                                length ranges: (a) visible range; (b) Infrared range 8 - 14 μm.

                                                    (a)                                      (b)

                                Figure 2. From [13]. The photograph was taken in the desert on a warm and humid
                                day in different wavelength ranges: (a) visible range; (b) Infrared range 8 - 14 μm.

                                 This cooling effect is especially strong in the middle and high latitudes over
                               the oceans, and its values reach −100 W/m2. The average monthly value of long-
                               wave radiation reaches maximum values from 50 to 100 W/m2 in convectively
                               disturbed regions of the tropics. However, this heating effect is almost offset
                               by the corresponding large negative effect of clouds on shortwave radiation,
                               indicating a delicately balanced state of the tropics. The observed net cloud
                               forcing is about four times the expected radiative forcing from a doubling of
                               CO2. Hence, small changes in cloud radiative forcing can play an important role
                               as a climate feedback mechanism. For example, during past glaciations, the
                               migration to the equator of a field of strong negative cloud radiative forcing
                               in response to a similar migration of colder waters could significantly enhance
                               oceanic cooling and continental glaciation.

DOI: 10.4236/opj.2021.116013                        155                                  Optics and Photonics Journal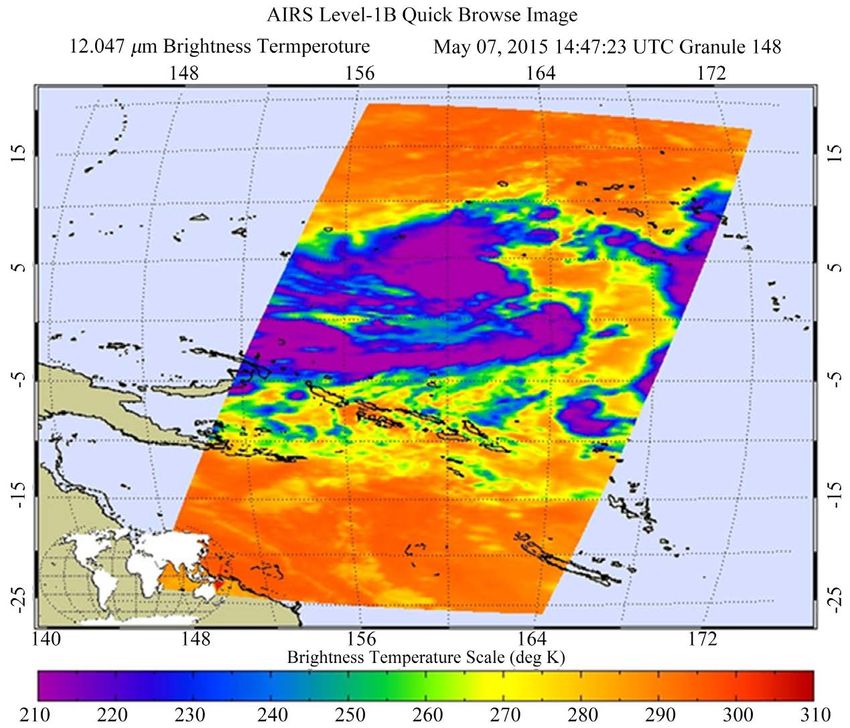
V. A. Tatartchenko

                               3. IR Radiation Recorded by Sensitive Radiometers
                                  from Satellites
                               Detected by satellites, infrared radiation allows getting very important information
                               concerning the atmosphere and processes on the earth’s surface. But the inter-
                               pretation of infrared images is always unproven. An anomalous distribution of
                               infrared radiation had been found and was described by several groups of
                               scientists in the series of papers [15]-[31]. Initial data were obtained with the
                               AVHRR (Advanced Very High Resolution Radiometer) from “The Satellite Active
                               Archive NOAA”. The first AVHRR was a 4-channel radiometer, carried on
                               TIROS-N (launched October 1978). This was subsequently improved to a 5-
                               channel instrument (AVHRR/2) that was initially carried on NOAA-7 (launched
                               June 1981). The AVHRR/3, with 6 channels, first carried on NOAA-15 (launched
                               in May 1998), was used in these studies (see Table 1).
                                 Of course, we exclude from consideration the thermal anomalies caused
                               by hydrothermal springs and volcanic activity. Only anomalies which in our
                               view are the result of the PeTa radiation during cloud and fog formation will
                               be analyzed. It is evident that the piquancy of the situation lies in the fact that
                               satellite data cannot be explained by existing models without taking the PeTa
                               effect into consideration. However, the authors of the above papers (geologists
                               and geochemists) try to insert the data in the old framework with help of
                               features of the geological structure of the regions of the globe where the thermal
                               anomalies are detected. Besides, it is very strange that the authors of the papers
                               under consideration have been using the term “anomaly”. In the end, if the
                               phenomenon can be explained by existing physical concepts, it is not an
                               anomaly. But we leave on the conscience of the authors an answer to this rhe-
                               torical question.
                                 To begin with, we will consider the paper [15] which represents in detail a
                               procedure of treatment of satellite data. The southern part of Eastern Siberia was
                               the region of investigation in the paper. It should be noted that the geothermal
                               environment of this area has been well studied: there are many geophysical
                               ground surveillance stations, many deep-drilled wells, in which the temperature

                               Table 1. AVHRR/3 Channel Characteristics.

                                                          AVHRR/3 Channel Characteristics

                                Channel     Resolution     Wavelength
                                                                                           Typical Use
                                Number       at Nadir        (μm)

                                   1          1.09 km       0.58 - 0.68        Daytime cloud and surface mapping

                                   2          1.09 km      0.725 - 1.000             Land-water boundaries

                                   3A         1.09 km       1.58 - 1.64               Snow and ice detection

                                   3B         1.09 km       3.55 - 3.93    Night cloud mapping, sea surface temperature

                                   4          1.09 km       10.3 - 11.3    Night cloud mapping, sea surface temperature

                                   5          1.09 km       11.5 - 12.5              Sea surface temperature

DOI: 10.4236/opj.2021.116013                        156                                   Optics and Photonics Journal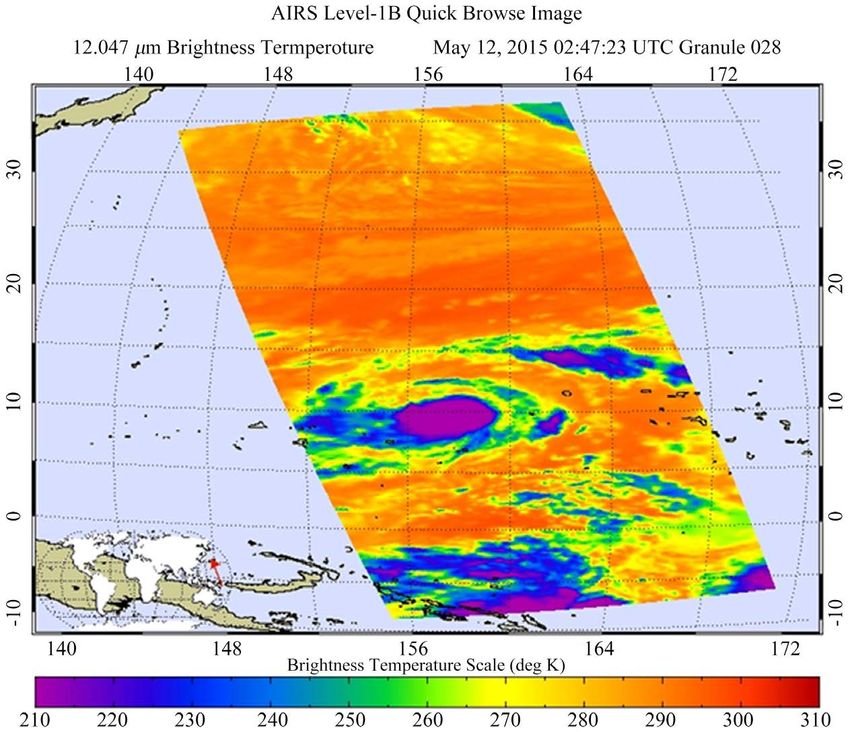
V. A. Tatartchenko

                               distribution is well measured [16]. The author of the paper [15] formulates his
                               task: Establishment of infrared radiation contours and accurate geographic
                               coordinates; measurement of radon activity in the areas of infrared anomalies;
                               link of the infrared anomalies with other geological parameters: vegetation
                               index, radon activity, and relief.
                                 Probably, we need an explanation of the meaning of a vegetation index (a
                               measure of vegetation intensity). The author used NDVI (Normalized Difference
                               Vegetation Index), the relative normalized vegetation index—a simple measure
                               of the amount of photosynthetic active biomass. A vegetation index qualitatively
                               reflects the fact that the vegetation well absorbs light in the visible range and is
                               worse in the near-infrared range of the spectrum.
                                 Data from the AVHRR were processed using a specialized package. An area,
                               date, and time of reception were selected. From the values of brightness, the
                               radiant temperature and vegetation index were calculated. To clarify the spatial
                               distribution of infrared anomalies, a comparison with the lay of the land was
                               implemented. The heat map was superimposed on a three-dimensional map
                               of the terrain. Therefore, according to the data from the device AVHRR, a
                               distribution of the heat flow in areas of the Baikal Rift Zone (Tunkin depression
                               and Barguzin depression) in the 4th channel (10.30 - 11.30 µm, maximum flow
                               of energy from the earth) for the period 1998 to 2001 was obtained. In parallel,
                               the data from the 1st and 2nd channels were used for vegetation index calcula-
                               tions. In addition, concentrations of Thoron (Rn-222) and Radon (Rn-220) were
                               measured in the identified infrared anomalies, using the radiometer of Alpha-
                               active gases RGA-01. Here are the main results from this and other above-
                               mentioned papers:
                                 Tunka Valley (Figure 3(a), Figure 3(b)). For the determination of the thermal
                               flow from the ground, autumn night images were chosen because the greatest
                               contrast in luminance between the edges and the bottom of the valley was found
                               in these pictures. The maximum radiant temperatures are on the Sayan slopes. It
                               has a value of 8 - 10 K higher than the valley itself. The width of this anomaly is
                               8 - 10 km. A similar maximum of 6 - 8 km length is also located on the opposite
                               side of the valley. It has less intensity of 2 - 3 K in relation to the south slope. The
                               vegetation Index remains practically unchanged in the valley (Figure 3(c)).

                                                                    (a)

DOI: 10.4236/opj.2021.116013                         157                                  Optics and Photonics Journal
V. A. Tatartchenko

                                                                      (b)

                                                                      (c)

                                                                      (d)

                       Figure 3. From [15]; (a) Thermal Photo of Tunka Valley and measuring circuit 1; (b) Values of tem-
                       perature; (с) Vegetation Index VI; (d) Altitude (All values mark on the circuit 1).

                                       A similar pattern concerning the peculiarities of the heat fields was observed
                                    in the Barguzin valley [15], in other tectonic breaks located in the central and
                                    south parts of Eastern Siberia, in the Tarim Valley in China [17] [19] [20] [21]
                                    [22] [23] (Figures 4(a)-(c)), in the Rhine Graben in Germany [18] (Figure 5),
                                    and in the zones of spreading and riftogenesis of the Afar depression in North-
                                    east Africa [23] [24] [25].
                                       The zones of permanent or periodical increase in intensity of the infrared
                                    radiation were detected on the images of tectonic breaks located in the western
                                    part of the North American continent. The dry climate and low density of forests
                                    in this area allowed excluding an influence of the vegetation index on the results
                                    of detected brightness. To minimize the daily heat inertia, the only morning data
                                    of measurement at 4-5 o’clock of the local time were used [26].
                                       These results allowed the authors to conclude that the anomalies of the earth’s
                                    infrared radiation at the regions of tectonic breaks have a global character. Four
                                    types of anomalies were detected: 1) Linear; 2) Contour; 3) Striped; and 4) Iso-
                                    lated. Respectively, they had the lengths: 1) 200 - 600 km; 2) 100 - 200 km; 3) 40
                                    - 60 km; 4) 1 - 1.5 km; and the widths: 1) 5 - 15 km; 2) 1 - 6 km; 3) 10 - 20 km; 4)
                                    1 - 1.5 km. Emissions of the 1st, 2nd, and 4th types had a permanent character,
                                    and one from the 3rd type was most noticeable during the rain season and be-
                                    came weak in the winter. Some of the anomalies were located in coastal ocean or
                                    lake strips, on lake surfaces but most of them were situated on slopes of moun-
                                    tain ranges with an altitude reaching up to 2700 m above sea level (a.s.l). The last
                                    anomalies were narrower for the steeper slopes, and the intensity of their radia-

DOI: 10.4236/opj.2021.116013                             158                                 Optics and Photonics Journal
V. A. Tatartchenko

                               tion was distributed in the most contrasting ways on alternate mountain ranges
                               and valleys. The typical values of measured infrared flows [23] were arranged as
                               50 - 90 mW/m2·str·μm (Figure 4(b)).

                                                                        (a)

                                                                        (b)

                                                                        (c)

                                      Figure 4. From [17]; (a) Location of regional faults on the Tarim plat-
                                      form (North-west China, at the top left, Lake Issyk-Kul is located) and
                                      its folded margins; (b), (c) Contrast outgoing winter surface IR flow of
                                      the Tarim platform and framing, the radiating elements include the
                                      Lake Issyk-Kul and others: (b) January 2001 night; (c) October 2000.

DOI: 10.4236/opj.2021.116013                       159                                   Optics and Photonics Journal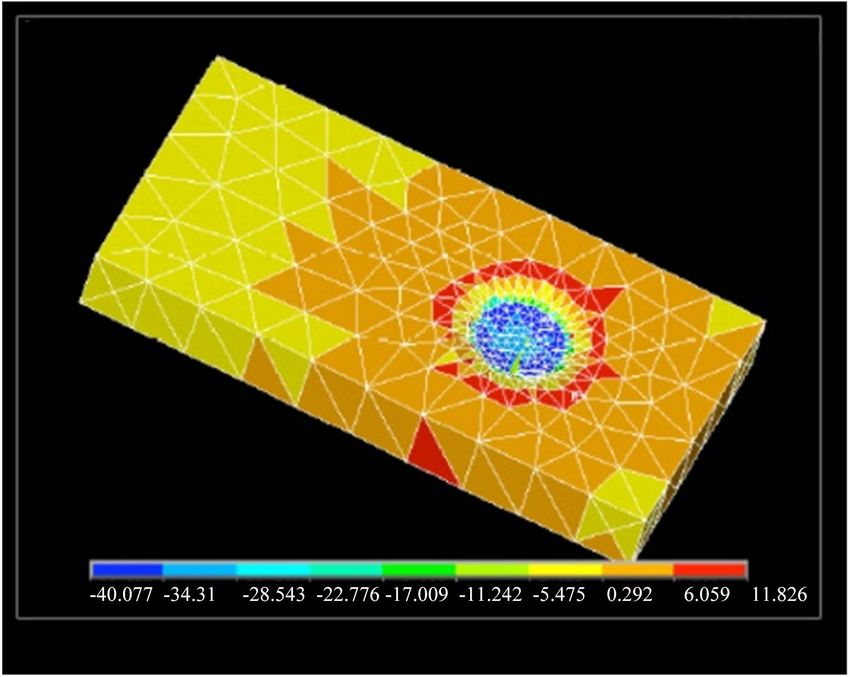
V. A. Tatartchenko

                                      Figure 5. From [18] “Thermal Line” Rhine Graben, card night temperature
                                      contrasts—on the satellite survey materials NOAA (AVHRR); arrows in-
                                      dicate positive linear contrasts night surface temperature.

                                  The authors considered several possible sources of the recorded radiation, but
                               first of all, they have explained these anomalies as the result of endogen heat flows
                               exiting through the tectonic breaks. Let us discuss this hypothesis. There are only
                               two ways for the exit of endogen heat: convective or conductive ones. With re-
                               spect to [18], the convective heat and mass transfer in comparison with conduc-
                               tive heat transfer is a much more efficient mechanism for Earth’s internal energy
                               dissipation. For the first time, this mechanism was suggested in the paper [27] to
                               explain the peculiarities of heat exchange in the fault zone near Kopet-Dag.
                                  According to this model (Figure 6), Kopet-Dag fractured limestones are a
                               zone of meteoric water percolation. When reaching heated deep horizons, the
                               temperature of meteoric water rises. Under the action of hydrostatic pressure
                               of a Kopet-Dag fault, the water rises and is unloaded at the level of the
                               groundwater. With respect to opinions of the authors of the papers [18], such
                               a mechanism, based on the difference between the hypsometric levels of infil-
                               tration and discharge zones, can explain the occurrence of thermal satellite
                               images—“thermal lines” for all mountain systems under consideration.
                                  In our opinion, this scheme cannot be implemented. Indeed, hot water rises to
                               the surface under the influence of hydrostatic pressure. This is a simple physical
                               process. But how does cold water penetrate into the depths, overcoming hydros-
                               tatic pressure and replacing hot water? The authors call the cause of this process
                               percolation. But it is not applicable in this case, because the only driving force
                               here may be the Laplace pressure in the capillary, and it disappears as soon as
                               the free surface of the liquid in the capillary disappears when the liquid seeping
                               from the surface joins with the liquid in the depths. In other words, the imple-
                               mentation of the process according to the scheme in Figure 6 contradicts the
                               second law of thermodynamics.

DOI: 10.4236/opj.2021.116013                        160                                 Optics and Photonics Journal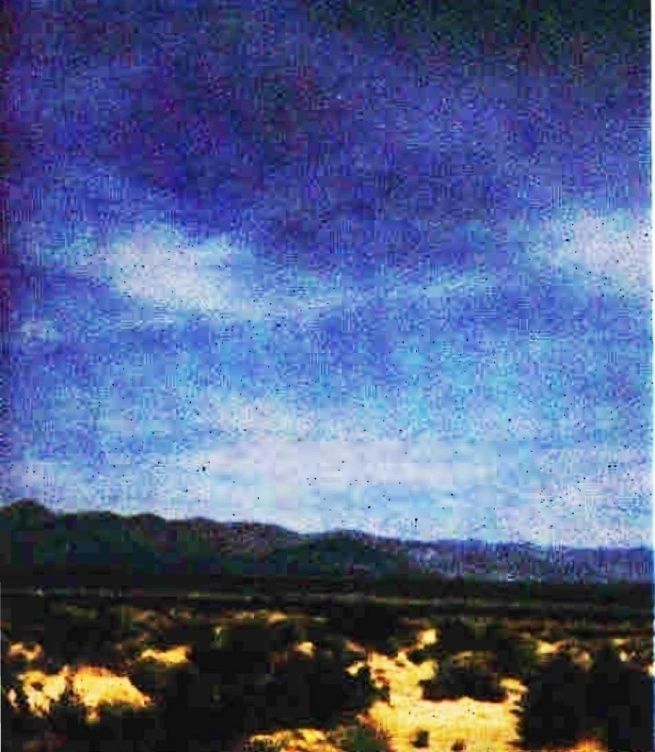
V. A. Tatartchenko

                                Figure 6. From [18] Model of underground fluids convection in the Rhine Graben.

                                 We offer our own explanation of the observed anomalies. Given that the ano-
                               malies are located in places with ideal conditions for fog and cloud formation, it
                               would seem to follow as a natural consequence that the recorded IR radiation is
                               the PeTa emission of water vapor condensation and/or deposition during fog
                               and cloud formation. Indeed:
                                 1) It is not surprising that anomalies are detected in the zones of tectonic
                               breaks because only these zones have been considered in most of the above-
                               mentioned papers. At the same time, in [18], the similar “thermal lines” were
                               mentioned in North Karelia, the basin of the White Sea, the Kola Peninsula, the
                               North Arkhangelsk region, and at the foot of the mountains of Kopet Dagh,
                               Urals, Caucasus, and the Himalayas.
                                 2) The analyzed hypothesis of our opponents cannot explain why endogen
                               heat exits on the middle of mountain slopes of altitude ranging between 1000 m
                               and 2700 m a.s.l., but not in valleys.
                                 3) The location of anomalies on surfaces of lakes as well as in coastal ocean or
                               lake strips also does not follow the analyzed hypothesis.
                                 4) If we accept the hypothesis of our opponents, the vegetation in the zone of
                               anomalies must be very different from the surrounding one, as it happens near
                               geothermal sources. For instance, in the paper [18], an unusual fact is analyzed:
                               the Big Solovetski island that is located in the very cold White Sea has very in-
                               tensive vegetation (It is a well-known tourist zone). At the same time, all nearly
                               located islands have the typical poor north vegetation. A good explanation of
                               this phenomenon is the nearly located hydrothermal water which increases the
                               temperature of the internal island’s lakes.
                                 5) With respect to the analyzed hypothesis of our opponents, the anomalies
                               have to be very inert. Their hypothesis cannot explain the sensitivity of the ano-
                               malies to the seasons and the time of a day, especially in arid climate zones [28].
                                 6) On the other hand, high mountains, e.g. Mont Blanc, a guide points your
                               attention to a cloud that steadily circles the mountain at an altitude of nearly
                               2500 m a.s.l. Condensation of cooled water vapor in the warm air flow rising
                               along the mountain slope when they reach a temperature of a dew point is the
                               reason for these cloud formations.
                                 7) The peculiarities of the zones of infrared radiation, especially narrowing on
                               the steep slopes, location on the surfaces of lakes, in coastal ocean or lake strips,

DOI: 10.4236/opj.2021.116013                        161                                 Optics and Photonics Journal
V. A. Tatartchenko
and seasonal or diurnal dependence correspond to our assumption.
8) Large quantities of charged ions, e.g. Radon or Thoron gases, in the at-
mosphere along the tectonic brakes could intensify the process of vapor con-
densation.
9) With respect to the analysis of linear cloud anomalies (LCA) by Morozova
[29], utilizing satellite imagery, the appearance of LCA above breaks in the li-
thosphere over various earth regions is a well-known natural phenomenon. LCA
length can reach several hundreds of kilometers. A unified opinion concerning
the nature of LCA is absent. Letnikov [30] asserts that lithosphere breaks are the
sources of ionized radon which initiates the LCA formation. Other geologists
support orographic factors of LCA appearance. In any case, the existence of
LCA, as well as the seasonal and diurnal change of sources’ intensities [17] sup-
ports our PeTa model.
It should be noted that, sometimes, together with endogen heat, the authors
of the analyzed hypothesis suggest the heat of water vapor condensation as a
possible infrared source: “Water vapor is transformed in a fog…The heat of the
phase transition is liberated, the radiometers of satellites ‘see’ this heat” (our
translation from Russian) [31]. This does not contradict our model in which on-
ly a part of the phase transition energy is emitted as the PeTa radiation. Howev-
er, the heat of condensation seems not to be the only reason for the anomalies.
Let us estimate this effect. If a reasonable quantity, 5 g/m3, of water vapor during
fog or cloud formation is condensed, and the energy of transition is completely
thermalized and used only for air heating, it will increase the air temperature by
1 K. In reality, this effect is recorded [31]: a systematic measurement of three
weather stations in the above-mentioned Tunka Valley recorded a thermo-
dynamical temperature on the mountain slope at the center of the thermal line
that was 1˚C higher than at the bottom of the valley.
Nonetheless, bright temperatures systematically measured by satellites in the
same (Figure 7(a)) and other (Figure 7(b)) regions were 6 - 12 K higher. This
fact can be explained if we assume that dew points coincide with the centers of
thermal lines, and are located circa at the middle of mountain slopes. There
cloud formation here is very intensive. A part of the liberated energy of phase
transition is absorbed and heats the air and soil. It explains the thermodynamic
temperature difference of 1 K between this place and the bottom of the valley.
The other part of the liberated energy of phase transition is emitted as the PeTa
radiation. It is added to Planck’s radiation and increases the recorded bright
temperature. Thus, the abnormalities of radiation temperature described above
are a result of non-equilibrium PeTa radiation that is added to equilibrium
Planck’s radiation.
A fact that the authors of the above-analyzed paper [13] recorded infrared
radiation in the range 8 - 14 µm from the middle parts of mountain slopes also
serves as an additional confirmation of our model.
PeTa energy could be stored. Let us imagine a system of two parallel mirrors
(one of them is semitransparent) of area of 1 m2 on the distance of 1 m from
DOI: 10.4236/opj.2021.116013 162 Optics and Photonics JournalV. A. Tatartchenko
(a)
(b)
Figure 7. Distribution of bright temperature on the slopes of moun-
tains: (a) from [23] Primorsky fault (Siberia, Russia); (b) from [26]
Taibai west slope (California, USA).
each other. Let us locate this system in the atmosphere where the water vapor is
saturating but is not condensed yet. Let us provoke condensing of the vapor. In
this case about 5 g of water vapor will be condensed in our system. It means that
12 kJ of energy will be liberated. The system would work as a laser. For the 8%
laser efficiency the energy of 1 kJ would be accumulated. A movement of the
vapor with the speed 1 m/s would provide a pulse generator of 1 kW power. For
comparison, a silicon solar cell of 1 m2 area provides 100 W power.
4. Condensation Explosions as Sources of PaTa Radiation
4.1. Registration of Powerful Pulses of IR Radiation in the
Atmosphere
Bordonsky [32] detected powerful pulses of infrared radiation in the atmosphere
using a broadband radiometer in the wavelength range of 7 - 14 µm. First mea-
surements were carried out in 1987 in Preobrazhenka village, Chita region (Rus-
sia), at an altitude of 1000 m a.s.l. A radiation pulse was registered at the time of
DOI: 10.4236/opj.2021.116013 163 Optics and Photonics JournalV. A. Tatartchenko
the existence of weak thunderstorm clouds. By the way, in this area, there are
unique weather conditions—at least 300 sunny days a year. The instrument had
an angle of view of about 0.1 rad and was oriented at an angle of 45˚ to the ho-
rizon in the south direction. On July 14, the radiometer gave impetus of radia-
tion of power exceeding all possible interference in the radiation pattern: birds, a
sharp change in the cloudiness, etc. A storm was observed at a distance of few
kilometers to the north. Calculations show that the observed signal could be a
result of the lightning discharge in the distance of the order of 1 km. However,
in the fixing angle near the receiver’s location, nobody did hear a thunderstorm.
This however is not absolute evidence of absence in the field of the device of a
lightning ball with poorly audible discharge. But if we consider that in August
1989, during a severe thunderstorm, the infrared radiometer did not register any
pulses, while a set of microwave radiometers operating in the 18 cm range con-
tinuously recorded lightning strikes (about 100 lightning strikes were recorded),
this excludes the possibility of false triggering of the radiometer in the previous
case due to interference from low-frequency electromagnetic fields. Thus, there
is an experimental fact: in July, the device recorded a radiation pulse, the mag-
nitude of which exceeded all possible atmospheric noises. The recorded pulse
corresponded to a radiation temperature of 340 K with a background tempera-
ture of 260 K (Figure 8).
This experimental fact is not the only one: in the same place, on December 14,
2006, a similar emission was recorded [33]. The members of this research group
did not exclude the PeTa nature of the radiation recorded in their experiments
[34] but this does not answer the question about the sources of this radiation.
4.2. Flash Implosion Craters in Balloon Date
At first glance, such powerful flashes of PeTa radiation in a weakly cloudy sky
are amazing. However, it turns out that the appearance of these outbursts is
quite understandable. J. Jenkins in his website [35] describes such an interesting
phenomenon as condensation explosions in the earth’s atmosphere, arising for
the following reason: temperature in the troposphere decreases with height. Even
in good weather, under conditions of light cloud cover and weak wind, signifi-
cant volumes of supersaturated vapor arise in certain places of the atmosphere
during the convective rise of warm air. When the critical supersaturation
Figure 8. From [32]. Infrared pulse: Radiation tem-
perature (K) versus local time (Hours).
DOI: 10.4236/opj.2021.116013 164 Optics and Photonics JournalV. A. Tatartchenko
of steam is reached in such a volume, instant condensation occurs—a condensa-
tion explosion. It should be noted that the phenomenon of condensation explo-
sions by its physical nature belongs to the same category of physical phenomena
as the glow of bubbles during cavitation luminescence (CL), sonoluminescence
(SL), luminescence of laser-induced bubbles (LIBL), and luminescence of vapor
bubbles (VBL) [8] [9] [10]. Similar to the listed effects, it is very convenient to
represent the phenomenon of condensation explosions on the nonequilibrium
phase diagram of water vapor-water-ice [10] [11].
It is very likely that the IR pulses detected in [32] [33] are the result of such
condensation explosions emitting PeTa radiation. After condensation explosions,
craters remain in the atmosphere, which are characterized by a sharp difference
in temperature, pressure, and humidity from the surrounding atmosphere. Jumps
in temperature and wind rotation are recorded by research probes passing
through funnels left by condensation explosions. A huge number of records show
that there are many such craters in the ordinary sky, i.e. infrared flashes caused by
condensation emissions occur continuously during normal weather. Craters exist
for a long time and then dissolve. Temperature jumps last the longest.
Let us consider examples of this phenomenon on the basis of the site [35],
which presents many research results that record the presence of condensation
craters: 15 soundings of the atmosphere from Norfolk Island, 34 from New
Caledonia, and 15 from Fiji. For Jenkins, studying normal weather is much more
important to understanding climate than studying storms and unusual weather.
The most common weather on Earth is a clear sky over the ocean with a con-
stant wind. We present 1 graph (Figure 9) from [35], which represents some
atmospheric parameters in normal weather at the Norfolk Island weather sta-
tion. According to [35], similar atmospheric sounding data for the entire terri-
tory of North America are available at
(http://weather.uwyo.edu/upperair/sounding.html).
Figure 9. From [35]. Some atmospheric parameters obtained with a weather
balloon during normal weather at the Norfolk Island weather station.
DOI: 10.4236/opj.2021.116013 165 Optics and Photonics JournalV. A. Tatartchenko
Upward movement of air is adiabatic expansion, and downward movement of
air is adiabatic compression. Expansion makes the air colder, and contraction
returns its temperature to the surface temperature. The graph shows that the
recorded temperature drop with height is much less than it would be for a purely
adiabatic process.
In the graph presented, the wind speed is ~15 knots at the surface and ~30
knots with a turn in almost the opposite direction at an altitude of ~1000 meters
a.s.l. In combination with lower pressure at this altitude, the power of the air
flow, and, therefore, its continuity is maintained. This change in the magnitude
and direction of the wind in the near-surface layer of the atmosphere is asso-
ciated with a sharp change in the friction force with height and is represented by
the Ekman spiral. A change in wind direction at an altitude corresponding to a
pressure of ~400 milliatmospheres is not accompanied by a change in tempera-
ture and is the result of some global processes in the atmosphere. We are inter-
ested in three intermediate changes in wind speed and direction, which corres-
pond to temperature jumps. It is there that the balloon passes through the cra-
ters left by the explosion of condensate.
An overwhelming number of records show that the normal sky is full of such
craters. Condensate explosions have led to bursts of infrared radiation, so the
craters show that bursts of radiation occur constantly in normal weather. It fol-
lows from the graph that condensation explosions in a specific place are not a
frequent phenomenon; therefore, it is natural that only individual radiation
pulses were recorded experimentally.
It should be remembered that the explosions that caused the craters occurred
before the balloon got there. Each crater dissipates heat, so its power, when the
balloon arrives, is not the same as it was when it happened. Explosions cause ro-
tation. Rotation accelerates the wind toward the surface below the center of the
crater and reduces speed in that direction or even changes its direction above the
center of the crater. The wind caused by the crater disappears first. The jump in
humidity can also disappear, but the jump in temperature remains the longest.
4.3. Laboratory Experiments
In laboratory facilities, for about 20 years, a group of researchers from Lithuania
has been experimentally researching the condensation implosions phenomena
that can occur for horizontally stratified liquid-vapor flow conditions [36] [37]
[38] [39] [40]. The goal is to understand the critical boundary conditions suffi-
ciently so that the phenomenon can be controlled and initiated at will.
Diagram of the experimental setup used in [36] [37] [38], is shown in Figure
10. The installation operates as follows. Steam is generated in boiler 4 and stored
in tank 5, from where it is sent to research chamber 1 and is contained therein at
the required pressure. Then from vessel 2 into the research chamber 1, which
begins to supply water at a fixed rate through dispenser 3 from the bottom. As
water is supplied, due to the shape of research chamber 1 (horizontal cylinder),
the area of contact between water and steam increases. The rate of this increase
DOI: 10.4236/opj.2021.116013 166 Optics and Photonics JournalV. A. Tatartchenko
depends on the rate of water supply. When the water surface area reaches a
certain critical value, a condensation explosion occurs, which is recorded by a
sharp drop in pressure in chamber 1 due to instantaneous condensation of
steam, Figure 11.
For us in these experiments, it is essential, first, to prove the existence of con-
densation explosions; secondly, the realization of condensation explosions when
a certain critical value is reached by the area of contact between steam and water.
In further work, the group developed a thermal-hydraulic system in which pe-
riodic condensation flashes are the driving force of water circulation [39] [40].
The advantage of the system is that its operation does not require a pump to
maintain circulation. Such a system does not require an external source of ener-
gy and could be used, for example, for emergency cooling of a nuclear reactor in
the event of a power failure and stopping the main circulation pump.
Figure 10. From [35] MOD2 Pulser Test Facility: 1, pulser; 2, water supply tank;
3, cylinder-piston with motor; 4, steam boiler; 5, steam hold-up tank; 6, 9, ther-
mocouples; 7, pressure transducers; 8, flow meter; 10, data acquisition system.
Figure 11. From [35] Pressure change P(t) for varying liquid flow rates. Open steam
line; water nozzle diameter 1 cm; 50, 48, 45—voltage supplied to the plunger motor;
a, b—experimental test.
DOI: 10.4236/opj.2021.116013 167 Optics and Photonics JournalV. A. Tatartchenko
Based on this modeling and experiments, it can be assumed that in nature,
condensation explosions can occur not only in the high-altitude layers of the
atmosphere but also in moving fog over the water surface, if the wind speed is 4 -
6 m/s, as a result of which the water surface is disturbed.
5. Measurements of the Concentration of Water Vapor in the
Atmosphere
As a rule, 6.7 - 6.9 μm IR radiation of the Earth has been particularly useful for
recording water vapor in the Earth’s atmosphere. Presently, a lot of infrared im-
ages of the Earth taken from the Space in this range exist. For instance, [41] con-
firm that the NASA orbiting GOES 8 satellite’s multi-channel imager produces
images of the upper troposphere at the infrared wavelength of 6.7 μm (Figure
12). Another example is the images obtained by the Japanese weather satellites of
series GMS 5-GMS 9. According to [42], for the water vapor images on the GMS
satellites, the radiometers VISSR with a range of measurement 6.5 - 7.0 μm have
been installed. But do modern meteorologists understand why this particular
range is used to measure water vapor concentrations? The book of [43] is usually
used for the interpretation of images. There we read: “Water vapor imagery is
derived from radiation emitted by water vapor at wavelengths around 6.5 - 7.0
μm. This is not an atmospheric window but a part of the spectrum where water
vapor is the dominant absorbing gas. The center of the absorbing band is 6.7 μm.
Emissions from water vapor low in the atmosphere will not normally escape to
space. If the upper troposphere is moist, the radiation reaching the satellite will
mostly originate from this (cold) region and be displayed in white shades, fol-
lowing the IR imagery color convention. Only if the upper atmosphere is dry,
radiation will originate from water vapor at warmer, mid-tropospheric levels
and be displayed in darker shades on the image. In a normally moist atmos-
phere, most of the IR radiation received by satellite originates in the 300 - 600
hPa layer, but when the air is dry some radiation may come from layers as low as
800 hPa. Because of the general poleward decrease of water vapor content, the
height of the contributing layer gets lower toward the poles”. The authors seem
to propose a reasonable scheme of the image interpretations on the basis of radi-
ation emitted by water vapor with the center of the band located at 6.7 μm. It is
only surprising: why up to now, nobody has been interested in the physical na-
ture of this radiation while, no doubt, this is the PeTa emission? Thus, there are
a lot of misunderstandings without a clear physical interpretation of this phe-
nomenon. For instance, the site (Imaging the Earth) describes Figure 12: “The
imager on this satellite records radiation emitted by water vapor in the upper
troposphere. Regions with high concentrations of water vapor are bright, while
dark spots signal lower water vapor concentrations.” On the other hand, for the
same image, on the site (http://antwrp.gsfc.nasa.gov/apod/ap020323.html), there
is the following description: “These instruments can produce images at the
infrared wavelength of 6.7 microns, recording radiation absorbed by water vapor
DOI: 10.4236/opj.2021.116013 168 Optics and Photonics JournalV. A. Tatartchenko
Figure 12. From [41]. Earth image at the infrared wavelength of 6.7 μm,
recording radiation emitted by water vapor in the upper troposphere.
in the upper troposphere. In this picture, the planet’s dark regions correspond to
high concentrations of water vapor over storms and high cloud tops, while
bright areas are relatively dry.” No comments.
For a set of TIROS (Television and Infra-Red Observation Satellites), the sys-
tem TOVS (TIROS Operational Vertical Sounder) was developed. With respect
to the paper [44], it was also installed on board the NOAA series (National
Oceanic and Atmospheric Administration) of polar-orbiting satellites. The
system TOVS contains three water vapor channels located at 6.7, 7.3, and 8.3
μm. The channels are sensitive to relative humidity in the upper, middle, and
lower troposphere, respectively. Thus, there is an empiric experimental fact. But
what is the physical nature of these sensitivities and, hence, why were these
ranges chosen? The authors explain: “Satellite observations of the upwelling
infrared radiation in the 6.3-μm water absorption band provide a unique source
of information on tropospheric water vapor.” If this postulate is accepted,
then two questions arise: 1) Why are ranges rather far from 6.3 μm? 2) Why
are they essentially different for three altitudes? Let us analyze this problem.
The keywords to be dealt with are “relative humidity” and “three vapor chan-
nels…sensitive…in the upper, middle and lower troposphere”. First of all, the
device is sensitive to the relative humidity (i.e. to the energy of vapor condensa-
tion and/or deposition) but not to the absolute one. Secondly, different energies
recorded from the three tropospheric levels correspond to three various combi-
nations of temperatures and pressures. Hence, both discrepancies could be com-
pletely explained in the frame of our PeTa model. It is important to bear in mind
that PeTa power is proportional to the speed of cloud formation (i.e. to the
speed of condensation and/or deposition) but not to the cloudiness. This is the
DOI: 10.4236/opj.2021.116013 169 Optics and Photonics JournalV. A. Tatartchenko
reason why we are not surprised to read in the paper under consideration that
TOVS’s data do not correspond to the radiosonde’s ones. Most likely two devices
measure different physical atmospheric characteristics (presumably relative and
absolute humidity).
It is interesting to compare the two methods of measuring the humidity
of the atmosphere: emitting of infrared radiation and absorption of high-
frequency radiation. The second method is based on the experimental fact of
emission of electromagnetic radiation from the earth’s surface in a wide range
of wavelengths. Water vapor and oxygen have multiple absorption bands in
the spectrum (Figure 13) [45]. As a rule, the strongest absorption band of
1.35 cm (f = ~22.2 GHz) is used to determine the amount of water vapor in the
atmosphere.
If the measurement is made from a satellite in a direction perpendicular to
the earth’s surface, the total content of water vapor in the atmosphere can be
measured. In the paper [46], the author notes the presence of own infrared
radiation in the atmosphere, unfortunately, without discussing the physical
nature of this radiation; a comparison is made between two methods for mea-
suring humidity—infrared and microwave (Table 2). Besides, a combination
of both methods is possible—the addition of an infrared radiometric channel
of the 7 - 10 µm or 7 - 14 µm range to the microwave measuring system opens
up the possibility of measuring humidity at low water vapor content. The
choice of these infrared ranges for measurement seems to be empirical again
without understanding the physical nature of this radiation.
Table 2. Comparison between three methods for measuring humidity-infrared, microwave and combined.
Infrared Microwave Combined IR and microwave method
Aerosol does not affect the Possibility to eliminate the influence of the
High level of self-radiation of the atmosphere
measurement results aerosol
Extensive use of different wavelengths for The range weather conditions: Advanced application range complex weather
the hardware adaptation of the season summer, spring, autumn. conditions and seasons.
Advantages
Due to the optics you can create a compact Possibility of obtaining further information
and highly directional gauges Clouds without precipitation on the lower boundary of clouds and thick
It opens the possibility of estimating the can be measured clouds using infrared measurements for
height of cloud and moisture in-cloud layer microwave tomography method
Method is intended for use in the
Method are influenced by aerosol, which is Complicated measuring equipment and data
summer. In winter, its use is
difficult to prediction processing.
extremely limited
Influenced by cloud cover, which entails
Clouds and precipitation require
Disadvantages limiting the height sensing and difficulties
the use of additional wavelengths
in processing the results of measurements
to account for their influence.
in-cloud layer The increase in the price of the complex
The complexity of the calibration at Highly sensitive
a low level of atmospheric radiation equipment is needed
DOI: 10.4236/opj.2021.116013 170 Optics and Photonics JournalV. A. Tatartchenko
Figure 13. From [45] Atmospheric absorption due to water vapor and
gases in the millimeter-wave spectrum.
6. Atmospheric Scintillations and the PeTa Effect
Scintillation is a general term for rapid changes in the apparent position, bright-
ness, or color of a distant luminous object observed in the atmosphere. In the
visible region, scintillations are associated with the scattering of light by fluctua-
tions in the density of air and microscopic drops or particles in air. According to
the Rayleigh law, the scattering intensity is I ~ 1/λ4 (λ is the wavelength of light).
Therefore, in diffused sunlight, blue and violet colors prevail, which explains the
color of the sky. But we do not see scintillations of the colors of the sky, because
fluctuations of air density in relatively small volumes are sufficient for the scat-
tering of blue color, and this happens with a high probability. Photons with a
longer wavelength in the visible and infrared ranges require the formation of
larger fluctuations, which is less likely, therefore, scintillations of this radiation
are also less likely. This statement is beyond doubt. At the same time, experi-
ments show that atmospheric scintillations in the visible and infrared ranges are
likely to have a different nature. Let us analyze the features of this phenomenon
in the infrared range.
In the paper [47], the observation is described that scintillation intensities
measured with LOPAIR (Long-Path Infrared operating near 10 µm) equipment
in the desert near Yuma, Arizona, were much bigger than those observed at Ed-
gewood Arsenal, Maryland, under similar seasonal conditions. LOPAIR is a de-
vice designed to measure the concentration of harmful gases in the atmosphere
by absorbing certain radiation in the infrared range. For these experiments, the
device was suitably modified. In both cases, the distance between the radiation
source and the receiver was 400 meters. The effects of haze and particles were
ruled out since heavy scintillation frequently follows heavy rain when the air is
washed clean. From experiments, it follows that in the IR range, scintillation on-
ly occurs at high relative humidity. Thus, only humidity, dissolved gases, and
suspended particles could seem to account for the apparent discrepancy. What is
the difference between natural conditions in these two geographical points? At
DOI: 10.4236/opj.2021.116013 171 Optics and Photonics JournalV. A. Tatartchenko
Yuma, the difference between the air temperature near the ground and the air
temperature along the line of sight is enormous. It is not inconceivable that wa-
ter vapor, which on the macroscale dominates weather patterns, producing
clouds and precipitation, might contribute to a microphenomenon such as ter-
restrial scintillation. A range ~10 μm and the place (desert) correspond to the
PeTa emission registration in Figure 2(a), Figure 2(b). It is therefore natural to
assume that it is linked to the PeTa radiation during the formation of micro-
scopic droplets in the atmosphere. This means that the physical nature of scin-
tillations in the infrared region is the same as the nature of abnormal continuous
absorption.
Indeed, air heated at the surface of the earth constantly rises, while being in-
tensively cooled. Upon reaching the dew point in these air flows, condensation
of water vapor begins with the emission of PeTa radiation. In parallel with this
process, another is inevitable—streams of cold air moving toward the earth are
formed. The presence of these oncoming flows leads to inevitable turbulence,
and, consequently, to the uncontrolled appearance of regions with a temperature
corresponding to the temperature of the dew point. Thus, the chaotic appear-
ance of PeTa radiation sources occurs. Recall that a similar chaotic PeTa radia-
tion is described in [6]. It occurred when hot steam, stirred by a fan, was admit-
ted into a cold chamber with a volume of 21 m3.
Of course, we cannot exclude the possibility that, along with PeTa radiation, a
certain contribution to the scintillation of IR radiation is made by the absorption
and scattering of radiation by microscopic drops of water formed as a result of
condensation.
7. PeTa Radiation and Living Organisms
In nature, PeTa radiation has a rather strong direct effect on humans and ani-
mals.
7.1. PeTa Radiation and Igloo Effect
An igloo, or a snow house, is a type of shelter built from the snow. On the out-
side, temperatures may be as low as −45˚C, but on the inside, the temperature
may range from −7˚C to 16˚C.
These buildings are widespread among the peoples of the north because they
provide comfortable living conditions for their inhabitants (Figure 14). Moreo-
ver, based on the principles of an igloo, comfortable hotels are currently being
built (Figure 15). The most amazing thing is that the colder the outside the
warmer inside. What is the reason for this?
The authors of the paper [48] tried to answer this question by modeling ther-
mal conditions in an igloo. They used the mathematical program FIDAP with
the geometry and boundary conditions shown in Figure 16. The conclusion of
the authors is as follows: Elevated temperature in igloos is explained by the fact
that snow is a good insulator and the human body is a source of heat.
DOI: 10.4236/opj.2021.116013 172 Optics and Photonics JournalV. A. Tatartchenko
It should be noted that the author of this paper has a special relationship with
the FIDAP program. In 1993, I was engaged in the development of the technol-
ogy of growing sapphire crystals [49]. Sapphire has a melting temperature of
2050˚C. I grew the crystals from molybdenum crucibles. Molybdenum has a
melting point of 2800˚C. In one experiment, a colleague of mine proposed that I
should calculate the conditions for crystal growth using the FIDAP program. As
a result, it was a single experiment in my life in which the crucible melted. The
fact is that the FIDAP takes into account only convective (nonradiative) heat
exchange. No comments.
Figure 14. From:
(http://vamvigvam.ru/blog/2015-05-10/iglu-traditcionnoe-zhilische-skimosov);
Classic igloo.
Figure 15. Kakslauttanen Arctic Resort—Igloos and Chalets, from
(http://images.google.fr/imgres?imgurl=http://www.kakslauttanen.fi/assets/2013/09/)
Igloo-hotel.
DOI: 10.4236/opj.2021.116013 173 Optics and Photonics JournalV. A. Tatartchenko
Figure 16. From [48]. Igloo geometry.
But now, let’s get back to the subject at hand. Obviously, the authors of the
paper [48] did not explain why the inside of the igloo becomes more comfortable
when it is colder on the outside. The main reason is that it is impossible to take
into account only conductive heat transfer and ignore the radiative one. Indeed:
firstly, now luxury ice hotels are widespread with ice sculptures inside; it means
that the temperature inside these hotels could not be positive. Secondly, the ho-
tels with thin glass walls are numerous (Figure 15). In this case, the walls of the
igloo have the temperature of the outside air. As doctors say, the peculiarity of
the situation lies in the fact that the person feels comfortable, even at tempera-
tures below freezing point, if his body heats up a source of infrared radiation. A
good confirmation of this is, for example, bare-chested skiers on a mountainside
at low temperatures but in the sun. Our experiments of [6] [7] indicate that the
walls of the igloo from snow or glass have to be a good source of the PeTa radia-
tion. Recall that a wall cooled to −25˚C emits PeTa radiation, the integral inten-
sity of which is equal to the Planck radiation of a wall having a temperature of
+25˚C. A significant part of this radiation is located in the window of air trans-
parency. It had not been absorbed with the air in the igloo, and thus, does not
DOI: 10.4236/opj.2021.116013 174 Optics and Photonics JournalV. A. Tatartchenko
heat the air inside. On the other hand, the radiation is absorbed by the human
body, and heats him. Most likely, this is the reason the wide use of these habita-
tions in northern areas. From our point of view, a good experiment would be to
place a model of a human figure inside an igloo and measure the temperature of
its surface and heat flux at different values of the external and internal tempera-
tures.
There is another interesting circumstance: the authors of the paper [50], who
are engaged in research of Vernacular Architecture, are interested in our expla-
nation of the effect of the igloo. Vernacular architecture means an architectural
direction that uses thousands of years of experience in building structures that
take into account and practically apply the geographic and climatic features of a
particular area. We are confident that, taking into account our explanation, the
igloo effect can be widely used in the construction of structures in the Arctic and
Antarctic climatic zones.
7.2. Stuffiness before Thunderstorm and Real (Feel) Temperature
The stuffiness before a thunderstorm is a well-known effect that ceases with the
first droplets of rain. See for instance
(http://www.youtube.com/watch?v=HEL9jm4jZoI): It was a very stuffy day and
suddenly there comes a very short but heavy thunderstorm! Most likely, the ef-
fect is a result of PeTa radiation during intensive thunderstorm cloud formation.
But the influence of clouds on the feeling of people is not limited to the closeness
of thunderstorms. It is obvious that the cloud protects the earth’s surface from
direct sunlight (Shortwave radiation). At the same time, during its formation,
the cloud emits the PeTa infrared radiation. A substantial portion of it lies at the
atmospheric transparency window. It is not absorbed by the air and thus does not
increase its temperature. But it is absorbed by the human body. Therefore, during
the formation of clouds, it appears as if the temperature a person feels was raised.
This effect is similar to that which holds in the igloo and is described in point 7.1.
At present, several weather sites show not only the measured (thermodynam-
ical) temperature but also a real (feel) temperature, e.g.
(http://www.accuweather.com/fr/fr/paris/623/hourly-weather-forecast/623). For
this, the AccuWeather RealFeel Temperature, e.g.
(http://www.accuweather.com/en/weather-news/what-is-accuweather-realfeel/7
198202), was developed in the 1990s. The RealFeel Temperature is calculated
from an equation that takes into account multiple factors to determine how hot
or cold feels. Some of the components that are used in the equation are humidi-
ty, cloud cover, winds, sun intensity, and the angle of the sun. Humidity is a
large contributor to determining the RealFeel, but the time of the day also is
important, due to the angle of the sun.
But we have our vision of the problem: if there is a cloudy day or fog forma-
tion, the real (feel) temperature has to be higher than the thermodynamic one
because of PeTa radiation during the cloud or fog formation. It would be inter-
esting to know that to determine the RealFee temperature, the PeTa radiation is
DOI: 10.4236/opj.2021.116013 175 Optics and Photonics JournalYou can also read