IMO's SULPHUR REGULATION TO BE ENFORCEABLE FROM THE YEAR 2020 AND ITS IMPACT ON THE SHIPBUILDING INDUSTRY - ABRAHAM VARUGHESE MSc in Maritime ...
←
→
Page content transcription
If your browser does not render page correctly, please read the page content below
Erasmus University Rotterdam

      MSc in Maritime Economics and Logistics

                       2017/2018

    IMO`s SULPHUR REGULATION TO BE
ENFORCEABLE FROM THE YEAR 2020 AND ITS
  IMPACT ON THE SHIPBUILDING INDUSTRY
                            by

           ABRAHAM VARUGHESE

               Copyright © [ABRAHAM VARUGHESE]

                                                 i
Acknowledgments

In the bible, Jesus says, “I do not know who fitted the board on the floor that I stand
upon right now, I do not know the great people who may come and stand upon this
floor but I do know that the one who made the floor and the one that sweeps it is just
as great as anybody in the world who may come and stand upon it if each be doing
their work with the same great love, faithfulness and capability.”

Lead by these principles, I have prepared this study with the support of many. First
and foremost, I would like to thank god, my parents Ebby and Serah, my brother
Thomas for leading me through the years to mould me as I am and for this opportunity
to study at this prestigious university. I would like to thank my grandparents for always
reinforcing my spirits and belief. I would like to thank Mr. Majumdar and Mr. Ranka,
two figures who lead me through my formative years as a maritime lawyer and instilled
me with all the skills that have proved to be advantageous in pursuing this study. I
would like to thank Dr. Berden for patiently guiding me on this study. I thank Renee,
Felicia and Martha from the MEL office who were pivotal in guiding me through the
arduous challenges of the MEL programme. I would also like to thank Mr. Clayton,
Dr. Pearce and Mr. Moondra for their guidance. The list is endless and to you all,
dedicate this product of a conversion of thought into character. I am blessed by your
presence in my life.

                                                                                       ii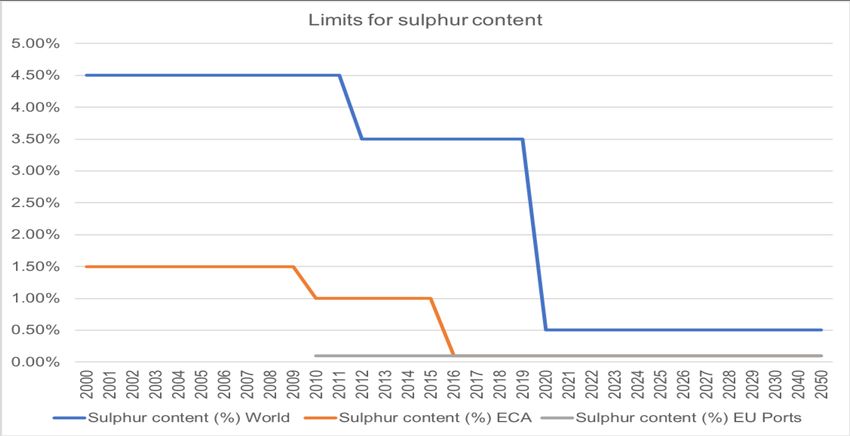
Abstract
In the study at hand, the impact from the use of low sulphur bunkers on the
shipbuilding industry is investigated. IMO, vide its efforts to transform the shipping
industry into a more environmentally friendly industry, has set out reforms requiring
the industry to make substantial changes in the way the trade is conducted. One such
effort is the use of regulating the bunkers used so as to reduce the shipping industry`s
contribution to air pollution by limiting the permissible content of sulphur in these
bunkers from 1st January 2020, when the reform suggested by IMO comes into effect.
The run up till the date of enforcement, the industry can choose how to comply with
this sulphur regulation as the said reform permits the use of alternative technology to
achieve its goal. Weighing the options available to the industry and its respective
feasibility, a majority of the industry has decided to use low sulphur bunkers to comply
with the sulphur regulation.
However, since low sulphur bunkers are sold at a premium as compared to the high
sulphur variants popularly used as on date, it is intuitive to foresee that use of low
sulphur fuels will severely impact the operating expense of vessels. However, the
ripples from such a shift is very wide and carries on through various aspects of the
global supply chain. Furthermore, the envisaged change is one of many ensuing
measures brought into force by the members of the IMO. Since a plethora of aspects
await to be investigated by analysts, the author seeks to study the impact of the global
use of low sulphur bunkers on the shipbuilding industry between named major
economies.
The said study is conducted using the GSIM as an econometric tool to measures the
impact of trade in the shipbuilding industry. Scenarios run by the GSIM model were
formulated on the cycles of changes that have commences from the year 2020, the
ambiguities around the instant regulation that consume the stakeholders and the
feasibility of the various options available to the industry to comply with the said
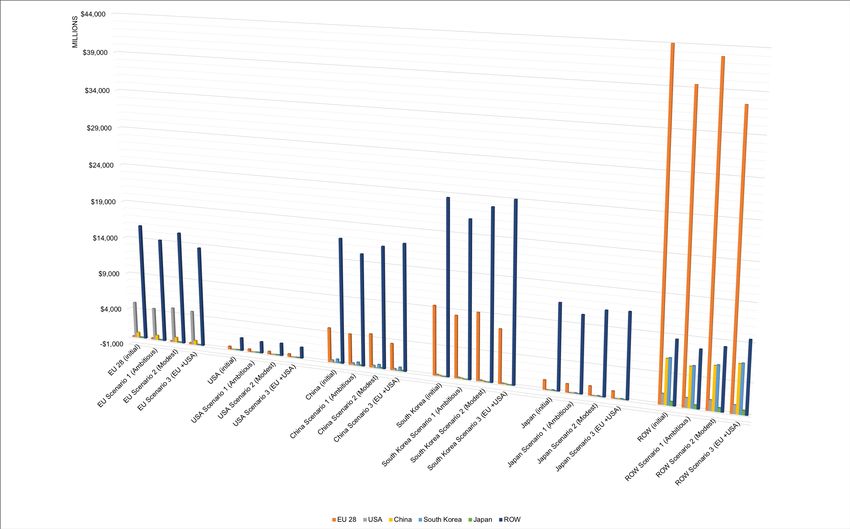
sulphur regulation. The results of the study yield that there would be a severe
reduction in trade between these countries as the increment in investment to run
vessels whilst maintaining compliance of the sulphur regulation translates into a rise
in NTMs for the shipbuilding industry. the output of shipbuilding nations are calculated
to be affected as much as – 12%. Bilateral trades are estimated to reduce as much
as 30% translating to approximately $ 9.3 Billion. State parties adopting a “wait and
see” approach could yield better benefits. Since, forward thinking economies like the
EU are known to have set higher standards in emissions as they have implemented
the spirit of IMO`s sulphur regulation in their territorial water as early as 2010, a
thorough implementation of the sulphur regulation by the EU would yield comparative
trade benefits to the other State Parties.
iii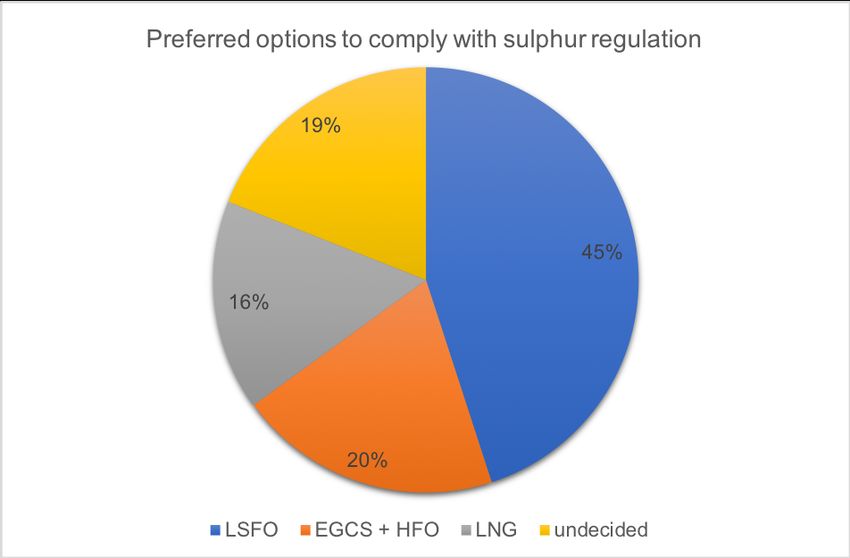
Table of Contents and Appendices
Acknowledgments ................................................................................................. ii
Abstract ................................................................................................................. iii
Table of Contents and Appendices ..................................................................... iv
List of Tables .......................................................................................................... v
List of Figures ....................................................................................................... vi
List of Abbreviations ........................................................................................... vii
Chapter 1 – Introduction........................................................................................ 1
   1.1.       Literature review ....................................................................................... 1
   1.2.       Research Objectives and Research Question........................................... 2
   1.3.       Thesis Structure ....................................................................................... 3
Chapter 2 – Emissions and Shipping ................................................................... 4
   2.1.       UN Sustainable Development Goals......................................................... 4
   2.2.       UNFCCC and related measures ............................................................... 9
   2.3.       Emissions by the shipping industry ......................................................... 13
Chapter 3 - Restriction on emission of Sulphur Compounds ........................... 20
   3.1.       Measures by the IMO ............................................................................. 20
   3.2.       ECAs and standards of compliance ........................................................ 21
   3.3.       Compliance with 2020 Sulphur regulation ............................................... 24
   3.4.       Uncertainty of adequate supply of low sulphur fuel ................................. 26
   3.5.       Balance of supply and demand and rising freight.................................... 28
   3.5.       Ship building industry.............................................................................. 32
   3.6.       Phases of changes awaiting the shipping industry .................................. 34
Chapter 4 – Methodological Approach ............................................................... 37
   4.1.       GSIM Model ........................................................................................... 37
   4.2.       Estimation of scenarios........................................................................... 39
Chapter 5 - Results and Analysis from the GSIM model ................................... 41
   5.1.   Changes in output and producer revenue ............................................... 41
   5.2.   Changes in welfare effects...................................................................... 43
   5.2.1.   Changes in producer surplus .............................................................. 43
   5.2.2.   Changes in consumer surplus............................................................. 44
   5.2.3.   Changes in tariff revenue .................................................................... 44
   5.2.4.   Total Welfare effect............................................................................. 45
   5.3.   Trade effects........................................................................................... 46
Chapter 6 - Conclusions ...................................................................................... 50
Bibliography ......................................................................................................... 52
Appendix .............................................................................................................. 57

                                                                                                                           iv
List of Tables

Table 1: List of countries per the percentage of global tonnage ............................. 26
Table 2: Elasticity data for GSIM model ................................................................. 40

                                                                                                          v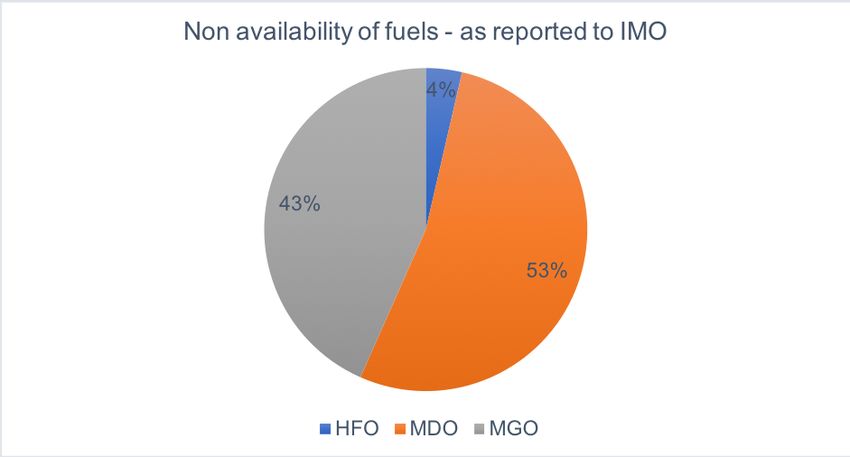
List of Figures

Figure 1: Graphical representation of GDP (in %) basis clustering of years ............. 6
Figure 2: Graphical representation of GDP (in %) from 1971 till 2015 ...................... 6
Figure 3: Graphical representation of global trade till 2017 (in USD) ........................ 7
Figure 4: Graphical representation of projected CO2 emissions based on 4 scenarios
 .............................................................................................................................. 11
Figure 5: Graphical representation of SOx emissions in EU28 ............................... 13
Figure 6: Graphical representation of SOx emissions in EU28 by shipping ............ 14
Figure 7: Graphical representation of NOx emissions in EU28 ............................... 14
Figure 8: Graphical representation of NOx emissions in EU28 in shipping ............. 15
Figure 9: Graphical representation of projected Global SOx emissions based on 4
scenarios ............................................................................................................... 16
Figure 10: Graphical representation of projected SOx emissions from International
Shipping based on 4 scenarios .............................................................................. 17
Figure 11: Graphical representation of projected Global NOx emissions based on 4
scenarios ............................................................................................................... 18
Figure 12: Graphical representation of projected NOx emissions from International
Shipping based on 4 scenarios .............................................................................. 18
Figure 13: Graphical representation of the reduction of sulphur content in marine
fuels ....................................................................................................................... 23
Figure 14: Pie chart showing the survey results on preferred options to comply with
the sulphur regulation............................................................................................. 25
Figure 15: Pie chart of cases of non-availability of compliant fuel as reported to IMO
 .............................................................................................................................. 27
Figure 16: Graphical representation of the freight market....................................... 28
Figure 17: Graphical representation of the world seaborne trade ........................... 29
Figure 18: Graphical representation of the weighted average earnings .................. 30
Figure 19: Graphical representation of the results from the Confidence Survey ..... 30
Figure 20: Graphical representation of the results from the Confidence Survey –
Demand trend v Tonnage....................................................................................... 31
Figure 21: Graphical representation of the results from the Confidence Survey -
Operating Costs v Regulation ................................................................................ 31
Figure 22: Clarksons Newbuild Price Index from February 1990 to February 2018 33
Figure 23: Delivery schedule of newbuilds from Clarksons outlook ........................ 34
Figure 24 : Graphical representation of projected global GHG concentration based
on 4 scenarios........................................................................................................ 35
Figure 25 : Graphical representation of timeline for reforms in shipping ................. 36
Figure 26: Graphical representation of change in output ........................................ 41
Figure 27: Graphical representation of change in producer revenues .................... 42
Figure 28: Graphical representation of change in percentage of producer revenue 42
Figure 29: Graphical representation of change in producer surplus........................ 43
Figure 30: Graphical representation of change in consumer surplus ...................... 44
Figure 31: Graphical representation of change in tariff revenues ........................... 45
Figure 32: Graphical representation of change in net effect ................................... 46
Figure 33: Graphical representation of change in trade values............................... 47
Figure 34: Graphical representation of the percentage change in trade values ...... 48

                                                                                                                               vi
List of Abbreviations

ABS – American Bureau of Shipping
CEIP – Centre for Emissions Inventories and Projections
CLRTAP – Convention on Long-Range Transboundary Air Pollution
ECA – Emission Control Areas
EGCS – Exhaust Gas Cleaning System
EU – European Union
GDP – Gross Domestic Product
GSIM – Global Simulation Model
GEF – Global Environment Facility
GHG – Greenhouse gas
GloMEEP – Global Maritime Energy Efficiency Partnership
HSFO – High Sulphur Fuel Oil
IMO – International Maritime Organization
IPCC – Intergovernmental Panel on Climate Change
LSFO – Low Sulphur Fuel Oil
MARPOL – International Convention on Prevention of Pollution from Ships
MGO – Marine Gas Oil
NDC – Nationally Determined Contributions
NOx – Nitrous/Nitrate Oxides
NTM – Non-Tariff Measures
ROW – Rest of the World
RCP – Representative Concentration Pathways
SDG – Sustainable Development Goals
SECA – Sulphur Emission Control Areas
SOx – Sulphur Oxides
UN – United Nations
UNDP – United Nations Development Programme
UNECE – United Nations Economic Commission for Europe
UNFCCC – United Nations Framework Convention for Climate Change
USA – United States of America
USD – United States Dollars

                                                                          vii
Chapter 1 – Introduction

Martin Stopford beautifully records that to thoroughly understand the drivers of
change and trading economics, the evolving frameworks of trade and its symbiotic
relationship needs to be studied. To do so it is imperative to abide by the distinction
that maritime economists work with quantities of cargo traded whereas trade
economists work with the value of the cargo traded (Stopford, M., 2007). Gereffi, et
al. 2005, theorised that the shipping industry is a complex algorithm comprised of
various parties establishing their value chains. Building on this, Bloor, et al. 2013,
stated that the industry evidences a ‘polycentric governance structure’ wherein a ship
owned by a company is managed by another company and equipped/manned by
another thereby creating a multi-layered structure. Accordingly, the governance of the
shipping industry follows a similar structure; Government, International agencies and
Non-State actors collaborate in a multi-layered structure (Bloor, 2014). Accordingly,
effective management and governance of the shipping industry involves these
multiple parties either in a top-down or bottom-up manner (supra). Either way, waves
of changes to the shipping industry can be seen to display an interpretive flexibility
wherein the proposed changes creates a favourable environment and an
objectionable environment (Bijker, 1995). Intuitively, the same can be observed with
a number of reforms with the debate being divided between the proponents and the
opponents of changes for the shipping industry (Latour, 1988). In light of the dual
nature of reforms, the events around and leading up to the reforms are crucial to
ascertain the parameters of the study at hand.

1.1.   Literature review

Since IMO has officiated, in 2018, that the most drastic phase of the sulphur
regulations would come into effect from 1st January 2020, the advisors, consultants
and experts have been scrambling to decipher the impact of this regulation on the
shipping and oil industry. Accordingly, a plethora of literature has been published
since highlighting the uncertainties ahead whilst suggesting plausible options for
compliance and safeguards under the proposed and imminent regime for the shipping
industry and the oil industry. ABS, vide its advisory, provides an overview on the
current practice, the details around different types of fuels used by ships and a
detailed list of practical challenges (approximately 20 challenges) in the wake of the
2020 sulphur cap along with possible solutions for shipowners and operators (ABS,
2018). Similarly, IG P&I clubs have funded a large number of independent studies to
advise their clients on how to comply with the sulphur regulation and what to expect
in the days ahead.

The highlights across these literature on the global shift to low sulphur bunkers are
common; uncertainty of enforcement of by State Parties, supply of compliant fuels or
ECGS systems. It is undisputed that the impact of the sulphur regulation is not
restricted to the shipping and the oil industry but the ripples of the same would be felt
across the board wherever shipping plays even the most insignificant of roles and in
this regard, lies the scope for research questions such as the one at hand. The
research question at hand finds its relevance as it is one of the many industry that is
expected to be severely impacted by the imminent sulphur regulation; more so in the
wake of a recovering order book. However, the limitation in the literature available as
on date is that they merely highlight the issues that could be faced by stakeholders in

                                                                                       1
the shipping industry. Although the industry was anticipating the enforcement of the
sulphur regulation to be delayed till the year 2025, the recent confirmation on the
enforcement of sulphur regulation from the year 2020 would set off a plethora of
analysis on the impacts of the global shift to low sulphur bunkers and to do the same,
reliance can be made on the earlier measure to control the emissions from bunkers.
However, environmental efforts have a history of being met with strong obstruction
when the results of its execution are too costly for industries but the envisaged change
is undisputedly one of great importance and urgency and must be enforced. Thus,
within these parameters, the research question poses great relevance for its time and
hopes to highlight further points for research towards a run up to 1st January 2020 so
that the transition into a sulphur free regime doesn’t come at the cost of international
trade discounting the transitional impact. Goldman Sachs, has made a sweeping
statement in an update published in June 2018, that the sulphur regulation would
impact the end consumers by approximately $240 billion (Goldman Sachs, 2018).
Bloor, et. al, 2014, notes highlights that the the guiding and working principle of
reforms are based on a principle of precaution which, by its very nature, would be
defeated if the garb of uncertainty is used to defer the enforcement of the proposed
reforms. In the run up to 1st January 2020, PPR5 was held in January 2018 after which
MEPC 72 will be scheduled during Spring 2018 followed by MEPC 73 during Autumn
2018 and thereafter, PPR 6 in January 2019 and finally MEPC 74 in Spring 2019; all
to facilitate a smooth transition into a sulphur-free shipping. Hopefully these events
would shine light on uncertainties posed by the industry to facilitate a smooth
transition into a sulphur-free shipping.
Till date, any rise in bunker costs over a long term has resulted in the innovation of
more fuel-efficient vessels thereby limiting rise in the capital costs and voyage costs
associated with the ship as result of which the question for analysts have always been
whether the burden of increased capital costs outweighed the bunker savings (Drewry
Shipping Consultants. Ltd., 1984). However, the imminent Sulphur regulation wouldn’t
seem to trigger another search for energy efficient ships but will turn the industry at
its heels.
1.2. Research Objectives and Research Question
The idea for this research stems from the confusion and scrambling that has
consumed the shipping industry as a result of the IMO regulating the use of bunkers
by ships to reduce or eliminate the emission of pollutants such as SOx, NOx and
particulate matter. The IMO has mandated that from 1st January 2020, no ship shall
use bunkers that contain more that 0.5% of sulphur. This comes as a drastic measure
that stirred the confusion and scrambling since the shipping industry was being fuelled
by bunkers with a sulphur content of 3.5% m/m; which is an 85% reduction.
Consecutively, ambiguity on supply and demand of compliant fuels, feasibility of
alternative compliance methods cause the industry to expend great amount in an
environment when the shipping industry is, colloquially, recovering. That said, the
shipping industry has endured a lot of changes by bearing the brunt of economic and
political changes, most of which are unknown to the common man. However, in this
first bout of changes to the shipping industry, the cascading effects on international
trade is unbeknownst but worthy of investigating. As part of a series of changes that
await the shipping industry, the effects on trade is not anticipated to be small and
short-lived. in this regard, an analysis on the prospective changes could aid in
2establishing counteractive measures, incentives or policies so buffer the impact of
these changes to the shipping industry. As such the research question is as below
followed by sub-research questions:
Main Research Question: What is the economic and trade impact of the global
shift to low sulphur fuels on the shipbuilding sector?
Sub Research Question 1: What are the commitments to the global environment by
the shipping industry and their developments?
Sub Research Question 2: What are the imminent reforms facing the shipping
industry and the methods of compliance?
Sub Research Question 3: What is the methodological approach used in this study
and are there any assumptions applied?
1.3. Thesis Structure
The study at hand comprises of 6 chapters. Chapter 2 elucidates the global
commitment towards our environment and charts out how, why and where efforts
arise from and where they are intended to lead to. Upon highlighting the global
framework established or sought to be established for our environment, reference is
drawn to the shipping industry to indicate the impact shipping has made on the
environment to build context on the efforts needed/in place to counter the same.
Accordingly, Chapter 3 emphasises on the measures instituted by regulatory
agencies against air pollution by ships and the practices of the industry. Thereafter,
the imminent regulation on emission of sulphur from ships is explained in detail along
with the options the industry can execute to be compliance of the said regulation.
However, it is imperative to understand the gravity of these reforms and the same is
expressed by explaining the current context of the shipping industry and drawing a
parallel to the bigger picture of cleaner shipping envisaged by global leaders and inter-
governmental organizations.
Having explained the ambit of the reform and its context, Chapter 4 elucidates the
methodological approach employed to ascertain the research question. Since
different methodological approaches merits their respective assumptions, the same
are listed subsequent to the theoretical framework behind each methodological
approach.
In Chapter 5, the results from our methodological approach are reproduced and
explained as a tacit conclusion and solution to the research question which is,
thereafter, summarised in Chapter 6 along with points for further research and
limitations in the instant study to ensure a correct interpretation of the result produced
herein.
3Chapter 2 – Emissions and Shipping
In this chapter, regulations and measures to transform the shipping industry as we
know it into a cleaner and more environmentally friendly facilitator of international
trade are highlighted by charting the various instruments and measures that were
pivotal in forming the framework around emissions by the shipping industry.
2.1. UN Sustainable Development Goals
The United Nations, convened on an apparent dawn of the millennium on the dates
of 4th to 6th September 2000 at the United Nations Headquarters in New York, USA to
reaffirm their association to the organization, synchronisation of their goals and
rekindle the fire to mould a sustainable environment for the future generations of this
planet. This meeting of world leaders was condensed into a resolution by the General
Assembly of the United Nations numbered as A/55/L/2 dated 18th September 2000
which is magnanimously titled as “United Nations Millennium Declaration”.
Vide this resolution, the United Nations, as a medium of speech of a unanimous global
agreement, lays down values, principles and goals for the 21st Century as an oath to
ensure its fulfilment. The said declaration makes a specific mention of certain values
such as the need to protect the environment and joint cooperation that is noteworthy
and forms the foundation of endeavours that are under the scope of this study and
the reproduced below as follows (UN, 2000):
“Respect for Nature: Prudence must be shown in the management of all
livings species and natural resources, in accordance with the precepts of sustainable
development. Only in this way can the immeasurable riches provided to us by the
nature be preserved and passed on to our descendants. The current unsustainable
patterns of production and consumption must be changed in the interest of our future
welfare and that of our descendants.”
“Shared responsibility: Responsibility for managing worldwide economic
and social development, as well as threats to international peace and security, must
be shared among the nations of the world and should be exercised multilaterally. As
the most universal and most representative organization in the world, the United
Nations must play the central role.”
Intuitively, a joint reading of the above principles would render an unequivocal
understanding that nations ought to participate in a collaborative manner to combat
the threats harming the sustenance of our environment by building a sustainable
balance between need and greed. However, it is often the case that much thought is
given into framing, drafting and explaining such concepts that often doesn’t need any
explanation but no further action is taken in realizing the contents of a paper that will
be stacked in shelves as was the case regarding in 1992 with The Rio Declaration on
Environment and Development (UN, 1992) wherein the following (select portions of
the declaration are reproduced below) was agreed but not acted upon:
“Principle 7: States shall co-operate in a spirit of global partnership to
conserve, protect and restore the health and integrity of the Earth's ecosystem. In
view of the different contributions to global environmental degradation, States have
common but differentiated responsibilities. The developed countries acknowledge the
4responsibility that they bear in the international pursuit of sustainable development in
view of the pressures their societies place on the global environment and of the
technologies and financial resources they command.”
“Principle 12: States should co-operate to promote a supportive and open
international economic system that would lead to economic growth and sustainable
development in all countries, to better address the problems of environmental
degradation. Trade policy measures for environmental purposes should not constitute
a means of arbitrary or unjustifiable discrimination or a disguised restriction on
international trade. Unilateral actions to deal with environmental challenges outside
the jurisdiction of the importing country should be avoided. Environmental measures
addressing transboundary or global environmental problems should, as far as
possible, be based on an international consensus.”
“Principle 16: National authorities should endeavour to promote the
internalization of environmental costs and the use of economic instruments, taking
into account the approach that the polluter should, in principle, bear the cost of
pollution, with due regard to the public interest and without distorting international
trade and investment.”
Albeit the fundamentals and concepts sought to be enforced are important, an
inaction to realize the same could’ve been in the minds of the leaders convened at
the summit that they enumerated goals to realize the principles they laid down and
the same is reproduced below (UN, 2000):
“We resolve therefore to adopt in all our environmental actions a new ethic of
conservation and stewardship and, as first steps, we resolve:
• To make every effort to ensure the entry into force of the Kyoto Protocol, preferably
by the tenth anniversary of the United Nations Conference on Environment and
Development in 2002, and to embark on the required reduction in emissions of
greenhouse gases.
• To intensify our collective efforts for the management, conservation and sustainable
development of all types of forests.
• To press for the full implementation of the Convention on Biological Diversity and
the Convention to Combat Desertification in those Countries Experiencing Serious
Drought and/or Desertification, particularly in Africa.
• To stop the unsustainable exploitation of water resources by developing water
management strategies at the regional, national and local levels, which promote both
equitable access and adequate supplies.
• To intensify cooperation to reduce the number and effects of natural and manmade
disasters.
• To ensure free access to information on the human genome sequence.
The order of the enumerated goals is noteworthy as it seems to follow, on a plain
reading, a pattern of reasonable achievement, being the first goal of reducing the
emission of greenhouse gasses ought to be achieved first.
However, ever since the Millennium Declaration of 2000 has been enacted, the global
economy and scenario has evolved rapidly; some for the better while others for the
worse. Whilst goals such as gender equality, hunger, diseases etc have become more
difficult to overcome (UN, 2014), poverty and economic standards of developing and
5transitioning economies have become better over time. Such development can be
easily and summarily gauged by graphing the GDP of the global economy over the
years and classified into three: the developed economies, transitioning economies
and developing economies (UN, 2014).
Figure 1: Graphical representation of GDP (in %) basis clustering of years
Source: UNCTADStat.org
A detailed view of Figure 1 is as below:
Figure 2: Graphical representation of GDP (in %) from 1971 till 2015
Source: UNCTADStat.org
GDP and global trade have a phenomenon of one hand feeding the other and
therefore, it is complete to note how global trade has increased over the years as
below.
6Figure 3: Graphical representation of global trade till 2017 (in USD)
Source: UNStat, 2018
Rampantly growing trade, as above, worsened the achievement of targets set earlier
coupled with grave inaction necessitated the world leaders to revisit the drawing board
to chalk out a revised strategy and revisiting sustainable goals. Accordingly, an Open
Working Group of the General Assembly of the United Nations was formed for the
purposes of preparing a “post-2015” agenda in light of Principle 7 of the Rio
Declaration of 1992 (UN, 1992) as reproduced above. In order to strengthen the steps
to be undertaken, Principle 7 of the Rio Declaration of 1992 (supra) was enshrined as
a concept of Common but Differentiated Responsibilities (CBR) that later on forms
the basis of the post-2015 agenda and thereafter, the SDGs (UN India, 2015).
Thereafter, much was discussed and negotiated which culminated in the adoption of
Resolution A/70/L.1 by the General Assembly of the United Nations on 25th October
2015 which enumerates the 2030 agenda for Sustainable Development (UN, 2015)
through 17 sustainable development goals and 169 targets.
Some excerpts of the said resolution is extracted and reproduced as below with
adequate caution to avoid interpreted out-of-context (UN, 2015):
“…the interlinkages and integrated nature of the Sustainable Development
Goals are of crucial importance in ensuring that the purpose of the new Agenda is
realized.”
“We are determined to address decisively the threat posed by climate change
and environment degradation. The global nature of climate change calls for the widest
possible international cooperation aimed at accelerating the reduction of global
greenhouse gas emissions and addressing adaptation to the adverse impacts of
climate change. We note with grave concern the significant gap between the
aggregate effect of parties` mitigation pledges in terms of global annual emissions of
greenhouse gasses by 2020 and aggregate emission pathways consistent with
having a likely chance of holding the increase in global average temperature below 2
degrees Celsius, or 1.5 Celsius above pre-industrial levels.”
“Seventy years ago, an earlier generation of world leaders came together to
create the United Nations. From the ashes of was and division they fashioned this
Organisation and the values of peace, dialogue and international cooperation which
7underpin it. The supreme embodiment of those values is the Charter of the United
Nations. Today we are also taking a decision of great historic significance. We resolve
to build a better future for all people, including the millions who have been denied the
change to lead decent, dignified and rewarding lives and to achieve their full human
potential. We can be the first generation to succeed in ending poverty; just as
we may be the last to have a chance of saving the planet. The world will be a
better place in 2030 if we succeed in our objectives.”
In the same vein, there are various acknowledgements of reality; that each sovereign
battles its respective priorities and hurdles in achieving the SDGs enumerated by UN,
that data remains unavailable and other challenges which is strongly urged to
overcome for the sake of “our common home” (UN, 2015). The 17 SDGs are as
follows:
Goal 1. End poverty in all its forms everywhere.
Goal 2. End hunger, achieve food security and improved nutrition and
promote sustainable agriculture.
Goal 3. Ensure healthy lives and promote well-being for all at all ages.
Goal 4. Ensure inclusive and equitable quality education and promote
lifelong learning opportunities for all.
Goal 5. Achieve gender equality and empower all women and girls.
Goal 6. Ensure availability and sustainable management of water and
sanitation for all.
Goal 7 Ensure access to affordable, reliable, sustainable and modern
energy for all.
Goal 8. Promote sustained, inclusive and sustainable economic growth,
full and productive employment and decent work for all.
Goal 9. Build resilient infrastructure, promote inclusive and sustainable
industrialization and foster innovation.
Goal 10. Reduce inequality within and among countries.
Goal 11. Make cities and human settlements inclusive, safe, resilient and
Sustainable.
Goal 12. Ensure sustainable consumption and production patterns.
Goal 13. Take urgent action to combat climate change and its impacts
Goal 14. Conserve and sustainably use the oceans, seas and marine
resources for sustainable development.
8Goal 15. Protect, restore and promote sustainable use of terrestrial
ecosystems, sustainably manage forests, combat desertification, and halt and
reverse land degradation and halt biodiversity loss.
Goal 16. Promote peaceful and inclusive societies for sustainable
development, provide access to justice for all and build effective, accountable
and inclusive institutions at all levels.
Goal 17. Strengthen the means of implementation and revitalize the Global
Partnership for Sustainable Development.
Since Goal 13 of the SDGs is under the scope of this study, the contents of the said
Goal as enumerated by the United Nations is enumerated below. At this juncture is it
noteworthy to point out that the United Nations Framework Convention on Climate
Change is considered to be the primary authority to negotiate on climate change
between countries however, a brief overview on the SDGs is essential to highlight the
intention of all participating sovereigns to combat climate change/environmental
pollution. Furthermore, for the sake of the study, the phrases climate change and
environmental pollution would be used interchangeably in light of the scope of the
study. Goal 13 of UN SDGs is as follows (UN, 2015):
“Goal 13. Take urgent action to combat climate change and its impacts*
13.1 Strengthen resilience and adaptive capacity to climate-related hazards
and natural disasters in all countries
13.2 Integrate climate change measures into national policies, strategies and
planning
13.3 Improve education, awareness-raising and human and institutional
capacity on climate change mitigation, adaptation, impact reduction and early
warning
13.a Implement the commitment undertaken by developed-country
parties to the United Nations Framework Convention on Climate Change to a
goal of mobilizing jointly $100 billion annually by 2020 from all sources to
address the needs of Developing countries in the context of meaningful
mitigation actions and transparency on implementation and fully
operationalize the Green Climate Fund through its capitalization as soon as
possible
13.b Promote mechanisms for raising capacity for effective climate
change-related planning and management in least developed countries and
small island developing States, including focusing on women, youth and local
and marginalized communities”
2.2. UNFCCC and related measures
Having paved way for the United Nations Framework Convention on Climate Change,
it is essential to study the same for the scope of the research question at hand. The
United Nations Framework Convention on Climate Change, 1992, although a unique
and vital instrument, is a culmination of various earlier efforts to combat climate
change and/or curb atmospheric pollution such as:
a. General Assembly Resolution 43/53 (UN, 1988),
b. General Assembly Resolution 44/207 (UN, 1988),
9c. General Assembly Resolution 44/228 (UN, 1989),
d. General Assembly Resolution 44/206 (UN, 1989),
e. General Assembly Resolution 44/172 (UN, 1989),
f. General Assembly Resolution 45/212 (UN, 1990),
g. General Assembly Resolution 46/169 (UN, 1991)
h. Rio Declaration of 1992 (UN, 1992),
i. The Vienna Convention for the Protection of the Ozone Layer, 1985 (UN,
1985)
j. The Montreal Protocol on Substances that Deplete the Ozone Layer, 1987
(UN, 1987)
Echoing the sentimentalities of sustainable development, the United Nations
Framework Convention on Climate Change is framed for the sole purpose of
maintaining the levels in the atmosphere to avoid atmospheric degradation so as to
permit the environment to naturally recover from externalities caused by human
interference and for the same to be done in a time-period manner (UN, 1992).
Building under the aegis of the United Nations Framework Convention on Climate
Change is the Paris Agreement on Climate Change that was brought into force on 4
November 2016 which is aimed at restricting the increasing warming of the globe to
under 2 degrees Celsius and thereafter to 1.5 degrees Celsius by requiring all State
parties ratifying the Paris Agreement to endeavor towards the goals as set out in the
said agreement through nationally determined contributions (NDCs) (UNFCC, 2015).
In addition to the above, the remainder of the agreement embodies an agreement to
foster the atmosphere by adopting long term strategies lowering the emission of
greenhouse gases (supra). The aforementioned NDCs forms the core in latter of the
agreement as it encompasses the proposal and goals by each country in attaining the
mandates of the Paris Agreement per Article 4, paragraph 2 (UNFCC, 2015)
A combination of NDCs will aid in ascertaining if the mandates of the Paris Agreement
can be realized and strategize accordingly. Despite political standoff during
negotiations, it is noteworthy that the Paris Agreement has adopted a policy of equity
wherein it is inherently provided for developing countries to take a longer duration to
achieve the mandates of the said agreement. These NDCs are to be submitted every
5 years with the next round of submission due in 2020.
A striking observation is that, like most conventions, the signatory state party is
incumbent to enact upon the contents of the Paris Agreement and ought to realize or
partially realize (limited to its sovereignty) their goals. Although this is the basis of
international law, this allows a certain leeway for the intended goals to be sought at a
later stage in time as opposed to when it was intended to be fulfilled. Therefore, the
crux of such international instruments boils down to the urgency of the situation at
hand sought to be tackled so as to ensure a pan-global appreciation and fulfillment.
In this regard, it is noteworthy to briefly glance upon the the levels of greenhouse
gases in the atmosphere so as to gauge the expediency required in tackling this
situation. Surely, the effects of greenhouse gases on climate change need not be
delved upon.
The Graphical representation of CO2 emissions are projected on the basis of
historical data and 4 scenarios around the policies regarding emissions of greenhouse
gases. Under RCP 2.6, it is estimated that emissions would peak prior to 2020 (van
10Vuuren, D. et. al., 2007) and thereafter decline whereas in juxtaposition, under RCP
8.5 (Riahi, K. and Nakicenovic, N., 2007), CO2 emissions would uncontrollably
increase continuously. The median scenarios are RCP 4.5 (Clark. L, et. al., 2007) and
RCP 6 (Fujino. J, et. al., 2006) which are estimated to be intermediate stabilization
scenarios, surely the preferred reality being RCP 4.5.
Figure 4: Graphical representation of projected CO2 emissions based on 4 scenarios
Source: RCP Database (2018)
Despite the scientific significance of these estimations, it is beneficial to relate to
change caused by these emissions. Therefore, to bring perspective, it is estimated
that should RCP 2.6 be the case, the area between the tropic of Cancer and the tropic
of Capricorn equatorial region would face about 1-10 days with temperatures above
35 degrees Celsius whereas if RCP 8.5 is the case then the area between the tropic
of Cancer and the tropic of Capricorn would face over 180 days with temperatures
about 35 degrees Celsius resulting in severe drought and/or flooding (World Bank,
2018). Data collected in time along with these RCPs would aid in determining the
necessary measures so as to achieve the permissible limits of CO2 emissions.
Having laid down a brief overview of the international measures towards combatting
climate change and its urgency, it is time to piece these efforts with international
shipping. In the same vein, it is only just to look upon the IMO to understand how the
abovementioned international measures are being translated and enforced upon the
international shipping industry. Since the underlying elements of the various efforts
by intergovernmental organizations such as the UNFCC, IMO and the likes are the
same, many efforts in the past and in the present are relatable to each other and to
the 17 SDGs laid down by the UN. For instance, the International Convention on
Standards of Training, Certification and Watchkeeping for Seafarers (IMO, 1978)
establishes the standard for training and certification of seafarers along with
watchkeeping for these seafarers embodies Goal 4 of the SDG being Quality
Education. Similarly, further correlation of IMO instrument and UN SDGs are
enumerated as below (IMO, 2018):
111. The World Maritime University and the IMO Maritime Law Institute seeks to
fulfill Goal 4 – Quality Education.
2. GloMEEP; a joint project od the GEF, UNDP and IMO, seeks to fulfill Goal 7-
Affordable and Clean Energy.
3. IMO`s Integrated Technical Cooperation Programme seeks to fulfill Goal 10 –
Reduced Inequalities.
4. One of the pillars of IMO being the International Convention for the Prevention
of Pollution from Ships, 1973 seeks to fulfil Goal 12 – Responsible
Consumption and Production.
5. Through the same International Convention for the Prevention of Pollution
from Ships, 1973 and other raft of measures, the IMO seeks to also fulfil Goal
13 – Climate Change.
6. Similarly, the IMO, through the Ballast Water Convention and other noteworthy
instruments, seeks to fulfill Goal 14 – Life under water.
As commendable the synergy from the union of such intergovernmental instruments
are, the research question at hand necessitates refinement of the scope of the study.
Accordingly, the measures by the IMO in regards to climate change shall be delved
into to draw the measure the ambit and draw its boundaries whilst highlighting
limitations for future consideration.
The term “greenhouse gases” is an all-encompassing term that consists of any
emission into the atmosphere that attributes towards climate change (Kijewska. A, et.
al. 2016). In this regard, there is a natural process of climate change stemming from
a natural emission of “greenhouse gases” like CO2, methane etc into the atmosphere
and then there is the much debated, accelerated climate change induced by
excessive emission of “greenhouse gases” caused by man-made activities. One
would argue that progress as we have achieved now, although subjective to each
sovereign, could not have been achieved if not for the development of industries and
technology and its proportionate cost to the environment but as is the case with any
depleting resources, it ought to be carefully managed so as to ensure its sustenance.
With the advancements and developments of today, we have created for ourselves,
it is time to use that to modify our ways from barbaric methods and the time for that is
now; which is effectively the premise of sustainable development.
However, synonymous to the vastness of the atmosphere are the variety of issues to
be tackled to clean up the atmospheric environment and controlling the emissions into
the same and it is stressed that atmospheric pollutants comprise of an an equally
large threat as much as climate change does although there isn’t a directly attributable
SDG in its name. These pollutants are responsible for premature deaths, respiratory
diseases, acid rains, imbalance of pH level of the soil and loss of agricultural yield
amongst a plethora of negative effects (Corbett et. al. 2007).
In this context lies the significance of an international instrument, to the likes of the
Paris Agreement, called the UNECE Convention on Long Range Transboundary Air
Pollution, 1979 which was entered into force in 1983 where State Parties have agreed
to “protect man and his environment against air pollution and shall endeavor to limit
and, as far as possible, gradually reduce and prevent air pollution including long range
transboundary air pollution which is when air pollution emanates from a State party
but causes its polluting effects within another State party” (UNECE, 1979). This
12collective action was formed and enforced to monitor and share information on
pollutants of the atmosphere, in particular, Sulphur compounds (supra).
The said convention was notably adapted time to time so as to achieve its goal of
reducing air pollutants vide numerous protocols namely the Protocol to the CLRTAP
of 1985 signed in Helsinki, the Protocol to the CLRTAP of 1991 signed in Geneva, the
Protocol to the CLRTAP of 1991 signed in Geneva and so on till the Amendment to
the CLRTAP of 2012 signed in Geneva but what is most noteworthy is the Protocol
tot eh CLRTAP of 1979 signed in Geneva for the sole purpose of including Nitrous
compounds into the scope of the CLRTAP (UNTC, 2018).
2.3. Emissions by the shipping industry
That said, it is noteworthy the signatories to the CLRTAP are predominantly European
nations, Russian Federation and USA (a total of 51 nations) to the exclusion of Asia,
Australia and Latin America (UNTC, 2018). The said convention does not make a
distinction on emission per industry or sources, however, the regulatory organization
called the CEIP, formed under the convention to monitor data shared by sovereigns,
does classify it per industry. Since data on emission inventories from the EU (EU28)
is thoroughly available till 2016 for Sulphur and nitrous compounds, a graphical
representation of the data from CEIP is reproduced below to highlight the decrease
in the emission of these compounds through collective efforts (CEIP, 2018).
The CLRTAP regulates the emission of SOx and NOx and in this regard, the
contribution and progress by the shipping industry is graphically represented below.
For each compound, the cumulative emission from all industries are shown followed
by the shipping industry`s emission of SOx and NOx.
Figure 5: Graphical representation of SOx emissions in EU28
Source: CEIP (2018)
13The contribution by the shipping industry towards Figure 5 as above is represented
below.
Figure 6: Graphical representation of SOx emissions in EU28 by shipping
Source: CEIP (2018)
Similarly, the emission of NOx from all industries is below.
Figure 7: Graphical representation of NOx emissions in EU28
Source: CEIP (2018)
14The emission of NOx by the shipping industry in Figure 7, as above, is shown as
below.
Figure 8: Graphical representation of NOx emissions in EU28 in shipping
Source: CEIP (2018)
As much as the success of these collective efforts can be perceived from the above
images, CEIP has calculated that there is a 40-80% reduction in the emission of
pollutants (CEIP, 2017) and also due to the establishment of Sulphur Emission
Control Areas in the EU since 2004 as shall be elucidated further on.
At this juncture of success, it is crucial to highlight that the CLRTAP mandates and
governs only 51 nations out of 195 after acknowledging the fact that pollutants in the
air have a long ranging effect. Therefore, the results or success achieved is
diminished in the global context since the bulk of air polluting/developing or
transitioning countries (going on the assumption that developing or transitioning
countries cannot do without such polluting measures for industrialization and
progress) such as parts of Asia, Africa and Latin America are excluded from the
mandate of the said Convention.
With the aforesaid limitation, if one can say so, it is imperative to understand the ambit
of efforts that need to be undertaken for a sustainable atmosphere. In this regard, the
Representative Combination Pathways (RCPs) would be significant to draw light on
the projected changes in these compounds as such RCP estimations forms the basis
for calculations on climate change for the IPCC conferences (RCP Database, 2018).
Similar to the projections for CO2 emission (as above), the projections for SOx and
NOx are also done on the basis of 4 scenarios as graphically represented below.
Being projections, it is scientifically dutybound to account for plausible outcomes and
accordingly carry out experiments. Therefore, scenarios cannot be ruled out merely
on account of it being too extreme as it could be a possibility and since these RCPs
form building blocks for more complex calculations on climate change and other
atmospheric studies (supra). That said, RCP 4.5 and RCP 6.0 are considered to be
15median-projections, colloquially speaking, whereas RCP 2.6 and RCP 8.5 are
considered to be comparatively extreme projections; all of them plausible. Therefore,
these figures and their visual representations ought to be only considered to ascertain
the strength of measures that’s need to be executed so as to achieve a restriction on
the pollution into the atmosphere and also as a measure to modify such measure from
time to time.
In this regard, the projected emission of SOx and NOx is pictographically represented
in the same manner as in above; first the projected emission of the compound from
all industries followed by the emission of the said compound by the shipping industry.
Caution to the reader that as opposed to the historical emission in Figures 5 to 8 are
based on data from the EU as part of CLRTAP, the projections below are a global
projection of emission of SOx and NOx.
Figure 9: Graphical representation of projected Global SOx emissions based on 4
scenarios
Source: RCP Database (2018)
Projected emission of SOx by international shipping from the projection as in Figure
9 is as below.
16Figure 10: Graphical representation of projected SOx emissions from International
Shipping based on 4 scenarios
Source: RCP Database (2018)
Upon analyzing the numbers and graphs for Global SOx emissions (Figure 9) and
SOx emissions (Figure 10) from International shipping; it is seen that SOx emissions
from international shipping contribute between 4-11% over the predicted periods till
2100 depending upon the scenarios. To elucidate further, under RCP 6.0 SOx
emissions from international shipping is seen to account for 7.28% of the Global SOx
emissions, under RCP 4.5 SOx emissions from international shipping is seen to
account for 11.61% of the Global SOx emissions, under RCP 2.6 SOx emissions from
international shipping is seen to account for 4.3% of the Global SOx emissions and
under RCP 8.5 SOx emissions from international shipping is seen to account for
10.42% of the Global SOx emissions. It may puzzle you that RCP 4.5, being a median
based projection, seems to indicated the highest ratio for SOx emissions from
international shipping to Global SOx emissions. This is inherent of the nature of the
curve RCP 4.5 forms as opposed to RCP 8.5 from Figure 10 (for International
Shipping) as it follows a more delayed fall over the projected time instead of a sharp
fall between 2010 and 2020.
Similarly, the projections of NOx from all industries and projections of NOx from
international shipping is represented as below.
17Figure 11: Graphical representation of projected Global NOx emissions based on 4
scenarios
Source: RCP Database (2018)
The projected emission of NOx from international shipping is as below.
Figure 12: Graphical representation of projected NOx emissions from International
Shipping based on 4 scenarios
Source: RCP Database (2018)
Similarly, upon analyzing the numbers and graphs for Global NOx emissions (Figure
11) and NOx emissions (Figure 12) from International shipping; it is seen that NOx
emissions from international shipping contribute between 10-18% over the predicted
periods till 2100 depending upon the scenarios. To elucidate further, under RCP 6.0
NOx emissions from international shipping is seen to account for 10.39% of the Global
NOx emissions, under RCP 4.5 NOx emissions from international shipping is seen to
account for 18.4% of the Global NOx emissions, under RCP 2.6 NOx emissions from
international shipping is seen to account for 12.7% of the Global NOx emissions and
under RCP 8.5 NOx emissions from international shipping is seen to account for
17.9% of the Global NOx emissions. As was in the case of projected SOx emissions,
18is it interesting to note the the average contribution of NOx emissions from
International Shipping is close under RCP 4.5 and RCP 8.5. it can be seen from Figure
12 (for International shipping) that both seems to be a wave peaking at different times
thereby accounting for the slight difference in their ratios. RCP 8.5 seem to be rising
till 2050 and then slowly falling whereas, RCP 4.5 rises till 2040 and then starts falling
till 2080.
19Chapter 3 - Restriction on emission of Sulphur Compounds
In this chapter, the measures instituted by the IMO to restrict or limit the emission of
air pollutants are explained. Furthermore, the various options members of the industry
may execute to comply with imminent regulations/reforms are explained along with
their respective limitations. Furthermore, it is essential to understand the present
status of the shipping industry so draw perspective on the impact the imminent
reforms would have on the shipping industry.
3.1. Measures by the IMO
Shipping is considered to be least polluting in terms of the cargo carried in comparison
to other modes of transport (UNCTAD, 2017). However, comfort in such relative
figures does not absolve the emission shipping is responsible for in absolute terms.
With an average contribution of 4 to 11% of SOx emissions and 10-18% of NOx
emissions from international shipping, the IMO saw this agglomerating impediment to
life, health and economy and started to/took appropriate measures. This was so as
the industry predominantly used High Sulphur Fuel Oils which, to bring perspective,
are the bottom of the barrel from the distillation of crude oil so much that the only
grade beneath this is tar used for asphalt.
The most notable and all-encompassing of such measures is the MARPOL
convention along with its Annexures. MARPOL Annexure VI seeks to deals with air
pollution from shipping, particularly, the emission of pollutants into the atmosphere
through the exhaust of the ships. Annexure VI specifically provides for regulations to
prohibit/reduce emissions of Sulphur compounds such as SOx, Nitrous compounds
such as NOx and particles and/or substances that deplete the ozone layer. In order
to so, the said annex mandates minimum standards for incineration on board ships
and permissible limits of SOx (Regulation 14) and NOx (Regulation 13) in fuels used
by the ships. However, Annex VI evolved to be a pivotal instrument after numerous
amendments and protocols over time.
MARPOL Annex VI, having been adopted in 1997, entered into force on 19th May
2005 shortly thereafter was sought to be revised to incorporate technological
advancements that occurred over time while the annex was dormant (IMO, 2018).
Accordingly, Annex VI was out back into the workshop for changes and was brought
back to be adopted in its new avatar in October 2008 that encompasses pollution by
SOx, NOx etc. and was brought into force on 1st July 2010. (supra). Henceforth,
shipping was conducted by tiptoeing around boundaries dictating pollution and
emission limits as shall be elaborated further on.
The key takeaways from MARPOL Annex VI as enforced on 1st July 2010 are the
following (IMO, 2010):
1. Creating of SECA which are designated areas requiring a low emission of
SOx. Regulation 13 of Annex VI names the Baltic Sea as a SECA (on account
of being designated as an ECA per Annex I of MARPOL) with a proviso to
include more from time to time as long as the criteria mentioned in Appendix
III of the said annex is fulfilled. – Regulation 14.
2. The maximum permissible content of Sulphur in any fuel used by ships
anywhere outside the ECAs are 4.5% m/m till 1st January 2012. Thereafter, it
20You can also read