Regional review: the hydrology of the Okavango Delta, Botswana-processes, data and modelling - Core
←
→
Page content transcription
If your browser does not render page correctly, please read the page content below
Regional review: the hydrology of the Okavango Delta,
Botswana—processes, data and modelling

Christian Milzow & Lesego Kgotlhang &
Peter Bauer-Gottwein & Philipp Meier &
Wolfgang Kinzelbach

Abstract The wetlands of the Okavango Delta accom-             Introduction
modate a multitude of ecosystems with a large diversity in
fauna and flora. They not only provide the traditional          The Okavango wetlands, commonly called the Okavango
livelihood of the local communities but are also the basis     Delta, are spread on top of an alluvial fan located in
of a tourism industry that generates substantial revenue for   northern Botswana, in the western branch of the East
the whole of Botswana. For the global community, the           African Rift Valley. Waters forming the Okavango River
wetlands retain a tremendous pool of biodiversity. As the      originate in the highlands of Angola, flow southwards,
upstream states Angola and Namibia are developing,             cross the Namibian Caprivi-Strip and eventually spread
however, changes in the use of the water of the Okavango       into the terminal wetlands on Botswanan territory cover-
River and in the ecological status of the wetlands are to be   ing the alluvial fan (Fig. 1). Whereas the climate in the
expected. To predict these impacts, the hydrology of the       headwater region is subtropical and humid with an annual
Delta has to be understood. This article reviews scientific     precipitation of up to 1,300 mm, it is semi-arid in Botswana
work done for that purpose, focussing on the hydrological      with precipitation amounting to only 450 mm/year in the
modelling of surface water and groundwater. Research           Delta area. High potential evapotranspiration rates cause
providing input data to hydrological models is also            over 95% of the wetland inflow and local precipitation to be
presented. It relies heavily on all types of remote sensing.   lost to the atmosphere. Only a small percentage flows into
The history of hydrologic models of the Delta is retraced      regional groundwater.
from the early box models to state-of-the-art distributed          Seasonal flooding in the Okavango Delta is the result
hydrological models. The knowledge gained from hydro-          of a complex interaction of local, regional and basin-wide
logical models and its relevance for the management of         influences (McCarthy et al. 2000). The discharge from the
the Delta are discussed.                                       basin is quite variable from year to year and within a year.
                                                               It is characterised by a flood peak in April at the entry to
Keywords Wetlands . Groundwater/surface-water                  the “Panhandle” (see Fig. 1). The movement of the flood
interactions . Water-resources conservation .                  wave across the Delta is slow, taking about 3–4 months to
Regional review . Botswana                                     travel the 250 km from Mohembo to Maun. During that
                                                               time, wide areas of the Delta are flooded. The seasonal
Received: 1 February 2008 / Accepted: 19 January 2009          flood spreads in channels and by overland flow. The
Published online: 20 February 2009                             outflow of the Delta at Maun is a good indicator for the
                                                               extent of seasonal flooding. A high discharge at Maun is
© Springer-Verlag 2009                                         an indicator for widespread inundation. Another interest-
                                                               ing indicator is the occurrence of flooding at Lake Ngami,
C. Milzow : L. Kgotlhang : P. Meier : W. Kinzelbach ())        an event which only happens as a result of large floods.
Institute of Environmental Engineering, ETH Zurich,                Being located in the Kalahari Desert, the Okavango
8093, Zurich, Switzerland                                      wetlands are the only perennial water body for hundreds
e-mail: Kinzelbach@ifu.baug.ethz.ch                            of kilometres. The mean inundated area is around
Tel.: +41-44-6333066
Fax: +41-44-6331061                                            5,000 km2 but the intermittently inundated area exceeds
                                                               12,000 km 2. It is crossed by migration routes of
L. Kgotlhang                                                   wildebeest, zebra and other animals. Besides the presence
Department of Water Affairs,
Government of Botswana,                                        of water as such, it is the variability of hydrological
P/Bag 0018, Gaborone, Botswana                                 conditions over the year which makes these wetlands
                                                               unique. The combination of a highly seasonal inflow and
P. Bauer-Gottwein
Department of Environmental Engineering,                       local dry and wet seasons result in an ever-changing
Technical University of Denmark,                               flooding pattern. A multitude of different environments
2800, Kgs. Lyngby, Denmark                                     and ecological niches have developed accordingly. The

Hydrogeology Journal (2009) 17: 1297–1328                                                    DOI 10.1007/s10040-009-0436-0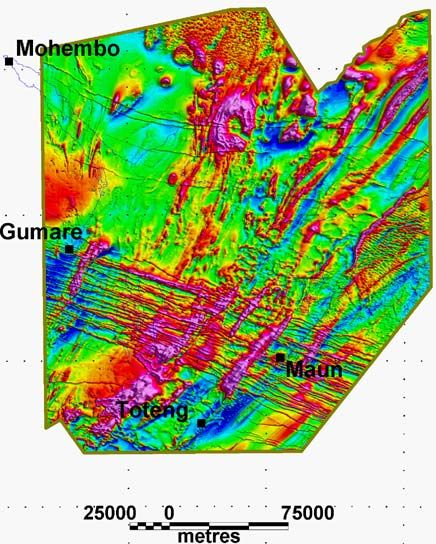
1298
Mohembo
Zambia
O
Angola
ka
a c
va
n
b
go
ay Zimbabwe
illw
R
Sp
.
Namibia
a
lind
Se Botswana
0
South Africa
99
19°00’S
Ma Mababe
una Explanation
0 . c Depression
98 Nqoga R 3 hira R
. a Cuito River
Khwai R.
t
b Cubango/Okavango
ul
Ja
Fa
o
River
R.
Ch
e
c Popa Falls
ar
ie 96
om
f’s 0
Is
G
0 la Permanent swamp
nd
97
Sa
n
Seasonal swamp
ta
4 2
nt
ad
0 95 Dry land
96 0
ibe
Th 1 Bo
ro Bor
R.
ao
Sh nyan o R.
Xud
ge Present channel system
R.
950 R. as e R
he . including dry reaches
e
um
20°00’S
an
R.
ak
R.
950
al
am
Maun Topographic contours,
Th
5 m equidistance [m asl]
Bot
eti Town or village
Lake Ngami R.
t
ul
t
Fa
0
ul
94
Fa
1 Beacon Island
e
er
e
950
an
ny
2 Phelo’s floodplain,
ak
Ku
al
Camp Island, Atoll Island
am
960 50 km
Th
3 Thata Island
4 Xaxaba
22°00’E 23°00’E 24°00’E
Fig. 1 The Okavango wetlands (commonly called the Okavango Delta) covering the so-called Panhandle on the northwestern side of
Gomare Fault and parts of the Okavango Fan. The extent of the permanent and seasonal swamps is plotted from data of the Sharing Water
Project (RAISON 2004). The channel network includes reaches that are not currently active
biodiversity found in the wetlands is large and can be tion of 120 million m3/year from the Okavango River at
primarily attributed to the special hydrological setting. Rundu, Namibia to supply the Eastern National Water
Ramberg et al. (2006b) list the number of identified Carrier of Namibia was originally proposed (JVC 1993;
species as 1,300 for plants, 71 for fish, 33 for amphibians, Pallett 1997). The project was later redimensioned to meet
64 for reptiles, 444 for birds, and 122 for mammals. With only immediate water consumption needs in an emergency
upstream activities still minor, the Okavango presently situation, which were anticipated at 17 million m3/year,
remains one of the largest virtually pristine river systems equivalent to an average flow of 0.54 m3/s (Water Transfer
on the African continent. The Okavango wetlands with a Consultants 1997). For comparison, the mean river dis-
recorded area of 5,537,400 ha were included in the charge since the beginning of the record in 1933 is
Ramsar List of Wetlands of International Importance 292 m3/s and the lowest monthly average was 83.2 m3/s.
(UNESCO 1971) in 1996. A number of future threats to Even though the impacts anticipated by a feasibility study
the wetland are apparent. These are linked mainly to the (Water Transfer Consultants 1997) were found to be rela-
development of the upstream basin and to climate change. tively minor, the scheme was not constructed due to inter-
Other large African wetlands included in the Ramsar list national protest. The same is true of a study to build a 20 MW
are for example the Niger inland delta in the Republic of hydropower dam in the Caprivi-strip (NamPower 2003).
Mali, the Sudd swamps in the Republic of Sudan, and the In Botswana, a population of about 125,000 was
Bahr Aouk et Salamat floodplains in the Republic of counted in 2001 in the larger Okavango Delta area
Chad. (Ngamiland District). Of these, slightly less than 2,700
The Okavango River Basin is an international basin, lived in the wetlands proper and about 50,000 in the city
with conflicting interests of the riparian states. Angola has of Maun at the downstream end of the wetlands (RAISON
a large potential both for hydropower and irrigated 2004). Household water is supplied either directly from
agriculture. The land area suitable for irrigation is the river or from groundwater. The latter was pursued in
estimated at 104,000 ha (Diniz and Aguiar 1973, in the Maun Groundwater Development Project (Water
Andersson et al. 2006). Agricultural intensification and its Resources Consultants 1997). Large-scale agriculture is
detrimental impact on the Okavango Delta with respect to not practiced in the Delta area. For Botswana, the
both water quantity and quality are to be expected. wetlands generate a considerable income through tourism.
Namibia suffers from severe water scarcity and is In 1996, tourism contributed 4.5% to the GDP of
highly interested in the Okavango waters. Within the Botswana (Mbaiwa 2005a), with a large part being
Central Area Water Master Plan (CAWMP), the abstrac- derived from the Delta area.
Hydrogeology Journal (2009) 17: 1297–1328 DOI 10.1007/s10040-009-0436-0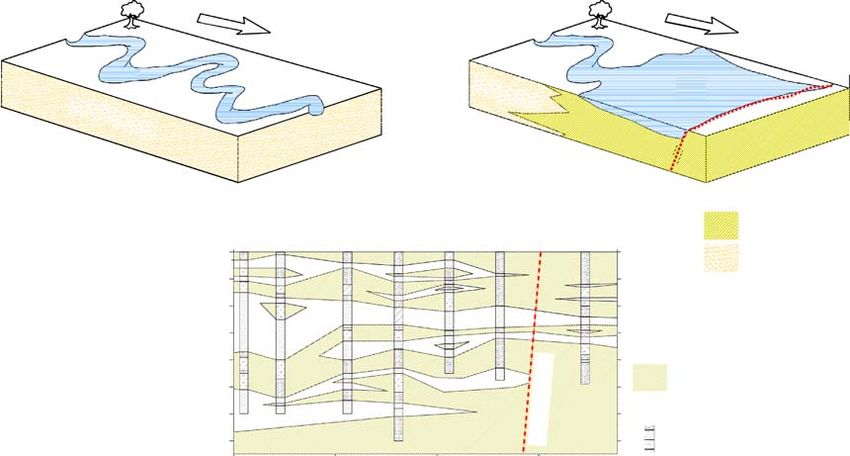
1299

                   a                                                                 b
                                     50                                                              Remote
                                                                                     Hydrology      Sensing 4%

                 Number of Records
                                     40                                                                      Geology 8%
                                                                                       38%
                                                                                                                  Applied
                                     30                                                                          Chemistry 10%

                                     20
                                                                                                                     Social
                                                                                                                   Sciences 14%
                                     10

                                     0
                                     1980   1985   1990      1995   2000    2005                  Biology 13%
                                                          Year
Fig. 2 a Yearly number of records found for the term Okavango in the Web of Science. b Classification of the 50 records of 2006 into
main research areas

    In 1994, Angola, Botswana, and Namibia jointly                         as Kalahari Beds (Hutchins et al. 1976; Reeves 1978;
established the Permanent Okavango River Basin Water                       Thomas and Shaw 1991; McCarthy et al. 1993b; Modisi
Commission, OKACOM, to “promote coordinated and                            et al. 2000). Hence, geological rock descriptions are
environmentally sustainable regional water resources                       derived mainly from rock outcrops in the nearby areas
development, while addressing the legitimate social and                    and their spatial distribution below the Delta is mainly
economic needs of each of the riparian states” (Pinheiro et                inferred from airborne magnetic survey and gravity data.
al. 2003).                                                                 Borehole data (where available) supplement these two
    Scientific interest in the Okavango Delta wetlands has                  data sets. The main aquifer of interest in hydrogeological
been growing considerably over the last few decades. As                    modelling of the Okavango Delta—the Kalahari Beds—is
an indicator for this interest, the number of records found                the very blanket that obscures the geology.
for the term Okavango in the Web of Science can be used.
In 2006, the yearly number of records reached 50, a large
part of which dealt with the hydrology of the Delta. Other
important fields of research are biology, social sciences
                                                                           10°S

and applied chemistry (Fig. 2).

The geological setting of the Okavango Delta
Regional tectonic setting
                                                                           20°S

The Okavango Delta straddles both the northeast trending
Ghanzi-Chobe Belt to the southeast and the Damara Belt
to the northwest (Fig. 3). These two belts are tectonically
the same, and are commonly referred to as the Damara
Belt in the literature. However, in Botswana, the rocks
marking the southeastern edge of the belt (Fig. 3b–e) are
known as the Ghanzi-Chobe Belt. The Damara belt
                                                                           30°S

formed during the collision of the Kalahari and Congo
Cratons, with the Kalahari Craton subducting northwards
below the Congo Craton during the Neo Proterozoic Pan                                                                             0   500 km
African Damara Orogeny (Passchier et al. 2002; Kampunzu
et al. 1998). Rock exposures in this belt are quite scarce in                            15°E               25°E             35°E
Botswana. However, they are well delineated in airborne                           Explanation
magnetic data maps. On the other hand, their correlatives                                                       Tectonic Belts:
are well exposed in Namibia and hence their tectonic                              Hills:                        (1) Kheis Belt
evolution is mainly based on evidence from exposures in                           (a) Koras                     (2) Choma-Kalomo Block
                                                                                  (b) Sinclair                       (segment of Irumide Belt)
Namibia and a few outcrops in the near vicinity of the delta.                     (c) Rehoboth                  (3) Irumide Belt (Kibaran age)
                                                                                  (d) Ghanzi Ridge              (4) Kibaran Belt (type area)
                                                                                  (e) Shinamba/Goha Hills       MD Mwembeshi Dislocation
Stratigraphic description                                                                                       LA Lufilian Arc
The geology below the Okavango Delta is virtually                                  International boundary       LMB Limpopo Mobile Belt
masked by a thick blanket of Cenozoic Kalahari sands                       Fig. 3 Regional tectonic setting of southern Africa (after Kam-
and recent Okavango Swamp sediments, grouped together                      punzu et al. 1998). The blue area is the Okavango Delta

Hydrogeology Journal (2009) 17: 1297–1328                                                                       DOI 10.1007/s10040-009-0436-0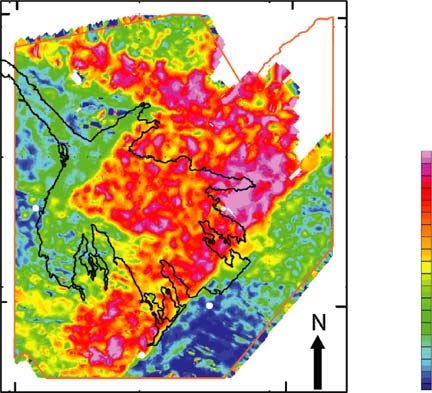
1300
   The geological units underlying the sand-cover are, in        with the greatest thickness occurring along the Kunyere
order from youngest to oldest:                                   Fault. Applying the same technique, Brunner et al. (2007)
                                                                 estimated the thickness of these sediments over the entire
1. Sedimentary and volcanic Carboniferous to Jurassic            Delta and determined an average of 150 m for the entire
   Karoo sequences                                               area, an average of about 250 m between the Gomare and
2. Neoproterozoic siliclastic and carbonate sequences of         the Kunyere faults, and a thickness of about 500 m in the
   the Ghanzi-Chobe/Damara rocks                                 near vicinity of the Kunyere Fault around Lake Ngami in
3. Mesoproterozoic metavolcanics and metarhyolites of            the southwest and the Mababe Depression in the northeast
   the Kgwebe Formation                                          (Fig. 4, see also Fig. 1 for the location of the faults).

Kalahari Beds                                                    Descriptive summary of spatial distribution
Overlying the bedrock are vast expanses of deltaic and           of basement rocks from airborne magnetic images
windborne, medium to fine-grained sands and silts of              Figure 5 shows total magnetic intensity (TMI) data that
Cenozoic age collectively known as the Kalahari Beds.            have been acquired over the Delta by the Department of
Hutchins et al. (1976) estimated the thickness of these          Geological Surveys, Botswana. Blue tones represent low
sediments to be of up to 300 m, but probably on average          magnetic rocks; red tones represent high magnetic rocks
considerably less. These mainly unconsolidated to semi-          while yellowish-green tones indicate rocks of intermediate
consolidated detritus deposits are associated with hard          magnetic strength. A swarm of closely spaced highly
concretionary lenses of calcrete and silcrete duricrusts.        magnetic northwest trending lineaments cutting the image
Duricrusts are mainly found in the distal parts of the delta     through the southwestern branch of the Delta are Karoo
and beyond. They occur both in the near subsurface               dolerite dikes. The lower southeastern edge of the Delta
(within an average of 20 m below surface) and as outcrops        consists mainly of the Kgwebe and Ghanzi rocks with the
along drainage channels and pools. The confinement of             elongated highly magnetic zones of the Kgwebe rocks
duricrusts to the distal parts is attributed to the enrichment   being flanked by low magnetic Ghanzi rocks. This is more
of silica and carbonates in the surface water down the flow       visible along the Okavango Rift Zone (ORZ) as referred to
gradient due to evapotranspiration processes (McCarthy           by Modisi et al. 2000 and Atekwana et al. 2003. The ORZ
and Ellery 1995; Shaw and Nash 1998). Surface duricrusts         is a fault bounded, northeast trending zone (∼55±5 km
form due to cementation of the host lithologies (sands) by       wide), clearly visible around Maun Village where the
silica and carbonate rich pore waters. However, subsurface       bounding faults cross cut the dolerite dike swarm. The
duricrusts form in the vadose zone very close to the water       area north of the ORZ is mainly occupied by foliated
table. Water table fluctuations lead to alternating saturated     metamorphic (high magnetic) and low to intermediate
and unsaturated conditions, which in turn lead to variation      magnetic rocks (quartzites and dolomitic marbles) of the
from relatively low to high pH values. Calcrete precip-          Damara Formation.
itates in the former conditions while silcrete precipitates in
the latter ones (Shaw and Nash 1998).
    The Kunyere Fault (Fig. 1) acts as an important lithologic
                                                                                                                18°S
divide in the Kalahari Beds (Department of Water Affairs,
DWA 2004). North of the fault, the sediments are pri-              Mohembo
marily deltaic and consist of sands and clays associated                                                               Thickness
with the Okavango Alluvial Fan. To the south of this                                                                   of Kalahari
divide (between the Kunyere and the Thamalakane faults),                                                               Sediments
the lithologic character of the sediments is more variable
and originates from deltaic, aeolian and pan type deposits.                                                     19°S       400 m
The older non-deltaic deposits are often diagenetically
altered through the precipitation of silica to form silcrete              Gumare
beds, which are well exposed along the Thamalakane
River bed. Calcretes are a common sight around the
vicinity of Maun Village and occur either as continuous                                                                    200 m
beds or disseminated nodules within the predominantly                                          Maun             20°S
sandy lithologies.
    Reeves (1978) found that the Kalahari Beds are around                   Toteng
500 m thick towards the northeastern part of the Kunyere                                                                   70 m
Fault on the down-dip side (northwest). By using a three-          22°E              23°E            24°E
dimensional Euler Deconvolution Technique on aero-                           0km            100km
magnetic data, Modisi et al. (2000) and Atekwana et al.
(2003), working mainly on the Okavango Rift Basin,               Fig. 4 Spatial distribution of Kalahari Beds’ thickness as
found an average thickness of 300 m along the graben             estimated from airborne magnetic data (after Brunner et al. 2007)

Hydrogeology Journal (2009) 17: 1297–1328                                                        DOI 10.1007/s10040-009-0436-0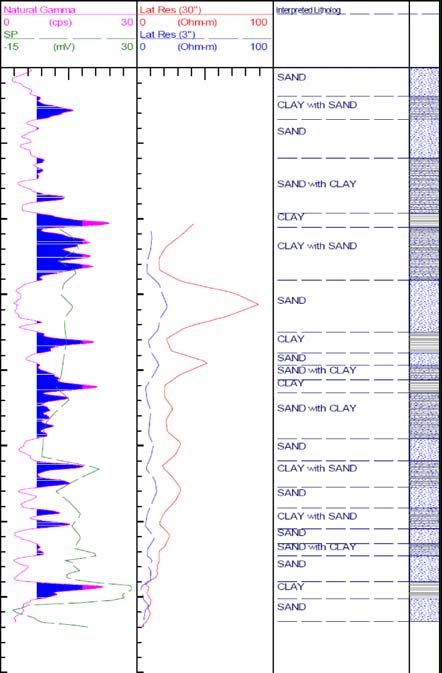
1301
solution by Scholtz et al. (1976) to these events indicated
normal faulting with the nodal plane dipping 60° to the
18°20’S
northwest. Scholtz et al. (1976) propose a NW–SE crustal
extension. McCarthy et al. (1993b) suggest that rifting in
the NW–SE directions was inconsistent with the northwest
striking lineaments in the Okavango, which are more
compatible with the E–W extension. The E–W extension
implies a component of strike-slip in the NW–SE
19°10’S
directions. Reeves (1978) suggests that the apparent lack
of strike-slip motions in the NW–SE direction along the
Thamalakane and Kunyere faults in the aeromagnetic data
is not a contradiction to this view but rather that the total
movement along these faults is on the order of a few
hundreds of metres. This E–W extension has reactivated
20°00’S
the north-easterly basement fabric to form oblique-slip
faults, producing a divergent strike-slip system (McCarthy
et al. 1993b). Experiments have shown that antithetic
faults develop in such systems (Wilcox et al. 1973, in
McCarthy et al. 1993b). The antithetic faults are dominat-
Village
ed by the formation of grabens due to the overall
Delta outline
extensional nature of the tectonic regime. In the Okavango
20°50’S
Rift zone Delta area, these fault systems correspond to the northeast
25 0 75 striking faults such as the Kunyere, Thamalakane, Gomare
km and others. The apparent increase of the sediment
22°30’E 23°20’E 24°10’E thickness in a southeasterly direction towards the
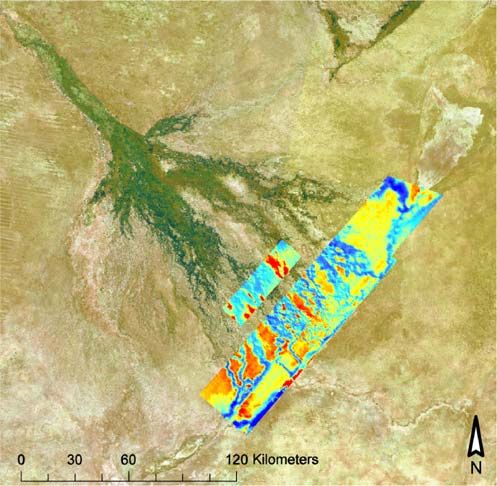
Fig. 5 Total magnetic intensity (TMI) image. Blue tones represent Kunyere-Thamalakane fault pair (Reeves 1978) implies a
low magnetic rocks, red tones represent high magnetic rocks while half-graben system (McCarthy et al. 1993b). Figure 6
yellowish-green tones indicate rocks of intermediate magnetic illustrates the proposed tectonic setting of the Delta as
strength (data provided by Department of Geological Surveys, postulated by DWA (2004).
Botswana, 2000)
High resolution airborne magnetic data (collected at
250 m line spacing) has added more evidence to the
postulations by different authors that indeed there is rifting
Okavango rifting below the Delta. Modisi et al. (2000) and Atekwana et al.
Du Toit (in Hutchins et al. 1976) was the first investigator (2003) used these data to reveal an unprecedented view of
to suggest that the Okavango Delta had a tectonic the rifting. This is shown by the cross cutting between the
connection to the East African Rift System (EARS). The Karoo Dike Swarm and the reactivated Proterozoic
tectonically active nature of the region was realised from northeasterly fault systems.
the high incidence of earthquakes (McConnell 1959, in
Hutchins et al. 1976). Large earthquake events were
recorded during the May 1952–May 1953 period, with Main Fault Set
magnitudes ranging between 5.0 and 6.7 on the Richter (i.e. Kunyere, Thamalakane)
scale. The 6.7 magnitude earthquake on 11 October 1952
was reported to have caused considerable damage to
buildings in Maun Village (Hutchins et al. 1976). Reeves
Secondary
(1972) plotted 38 earthquake events within Botswana for Fault Set
the period from September 1965 to August 1971, 28 of
which clustered below the Delta swamps in a narrow
northeast-southwest trending zone bounded by the Tha- N
malakane and Gomare faults to the southeast and Principal
Graben
northwest respectively. The spatial distribution pattern of
these seismic events led Reeves (1972), Scholtz et al. Gomare
(1976), and Hutchins et al. (1976) to postulate that rifting Fault
was occurring below the Delta.
A micro-earthquake investigation carried out by the
Department of Geological Surveys (Botswana) in 1974
showed that the Maun-Toteng area was the most seismi-
cally active, with most activity associated with the north- Fig. 6 A schematic diagram of the Okavango Graben (modified
easterly trending Kunyere and Thamalakane faults at the after DWA 2004). The blue line shows the approximate outline of
distal end of the Delta (Hutchins et al. 1976). A fault plane the Delta
Hydrogeology Journal (2009) 17: 1297–1328 DOI 10.1007/s10040-009-0436-0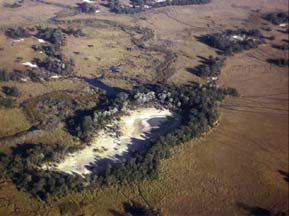
1302
   Clearly, the tectonic activity did not only influence the        influenced the course and endpoint of the river several
position of the Delta but continues to influence flow by the         times (McCarthy et al. 1992). At present, 870,000 tonnes
resulting fault lines. The NE–SW trending Kunyere and              of sediment are deposited on the fan annually (Garstang et
Thamalakane faults in the distal part of the Delta are two         al. 1998). This sediment deposit consists of approximately
prominent examples. The Okavango waters pond against               50% from solutes contained in the inflowing water, 22%
their scarps and are redirected to flow parallel to them. At        from particle sediment (mainly bedload and some sus-
some locations, a fault induced break along the lengths of         pended load), and 28% from aeolian inputs. The amount
these major faults allows flow across them. This occurs for         of solutes entering the delta can be assessed using
instance where the Shashe and Boronyane rivers cross the           laboratory analyses of water samples and thus is known
Kunyere Fault. The Gomare Fault governs the lateral                precisely. The situation is different for bedload. Laborious
expansion of the wetlands where the river flows out of the          sampling has been undertaken with pressure difference
Panhandle. With faults acting as guides for flow, seismic           samplers but given the uncertainty of the method, derived
events and consecutive tectonic movement can therefore             amounts remain approximate. The very low suspended
also play a major role in the shifting of flow paths within         load has been estimated using turbidimeters. A source of
the Delta. This is further discussed in a later section.           error is the varying organic content of the water. The
                                                                   estimations on the aeolian input cannot be considered to
                                                                   give more than the order of magnitude of the input.
Processes driving the hydrology                                        Both particle and solute sediments (200,000 and
of the Okavango Delta                                              420,000 tonnes/year respectively, Garstang et al. 1998)
                                                                   enter the wetlands through the inflow channel but because
The hydrology of the Okavango wetlands is governed by a            of the different transport processes, the locations where
series of drivers which influence the hydrologic system             they are deposited are different. Channels are typically
over different time scales. As a result, the flooding               flanked by dense aquatic vegetation (reeds or Cyperus
patterns are highly seasonal and differ from year to year.         papyrus) through which water filtrates to the surrounding
In the long term, these drivers include sedimentation              floodplains. Flow velocities in the channels are in the
which is responsible for the formation of the fan over             range of 0.5–1.5 m/s and only on the order of a few cm/s
geological timescales, sedimentological and biological             in the floodplains. As a result, bedload is transported in
processes maintaining the roughness of the fan surface             the channels only and the small suspended fraction in the
and driving the positioning of channels, and the climate.          channels is filtered by the flanking vegetation. Solutes are
    In the short term (i.e. in periods on the order of a decade,   deposited as calcretes and silcretes in places where water
time scales relevant for water-management actions) the fan-        evaporates or is transpired by vegetation, i.e. on islands
shaped surface overlain by small- and large-scale topograph-       and drying floodplains. Even though with 35 mg/l of total
ic features can be considered a fixed setting. Also, vegetation     dissolved solids (Dincer et al. 1978), the water is
cover which, given the flat topography, has a strong                relatively fresh at its inflow to the Delta, one has to keep
influence on the hydraulic roughness in floodplains takes            in mind that the Okavango wetlands are a terminal system
several years to adapt to new conditions. The set of processes     where most of the solute inputs are deposited (with a small
driving the short-term variability of the flooding patterns are     amount leaving the system by a limited flux towards the
meteorological processes and anthropogenic impacts.                regional groundwater system). Solutes account for as
    Tectonics movements are difficult to classify as short- or      much as 50% of deposited sediments. The importance of
long-term drivers. Tectonic movements occur in the short           dissolved salts and their implication in biological process-
term, while it takes quite a long time for the erosional           es is discussed in the section Salt transport and deposition.
processes to counter balance the effects of their displacement.        Particulate sediments represent less than a quarter of the
    Variations in the hydrology of the wetlands are best           sediment input but because of their concentrated deposition
documented for the eastern branches of the wetlands—the            on channel bottoms, they play an important role in the
Nqoga, Maunachira, and Khwai systems—with discharge                geomorphology of the Delta. Aggradation of channels is
and water level data available since 1970 (Wolski and              faster than morphological change in floodplains and the
Murray-Hudson (2006b). In these systems, important                 resulting channel shifting determines which floodplains are
recent changes have occurred which are due partly to               going to be inundated (e.g. McCarthy et al. 1992).
human interventions and partly to the natural fluctuations              The third component of sediment input, aeolian sedi-
of the wetlands.                                                   ments, differs from the two others as deposition is more or
                                                                   less uniform over the Delta regardless of the short-term
                                                                   water distribution. The long-term water distribution,
Sediment inputs and transfers                                      however, is important as it is a driver for the distribution
The massive alluvial fan, on top of which the Okavango             of vegetation, which then acts as a filter removing aerosols
wetlands lie, consists of riverine and aeolian sediments.          from the air. Vegetation cover also diminishes remobilisa-
As McCarthy et al. (1991b) note, the date of initiation of         tion of aerosols thus ensuring a net accumulation.
the fan is still unknown. The Okavango River system may            Garstang et al. (1998) estimate the yearly input of aerosols
have flown already at pre-Cretaceous times (Thomas and              to be 250,000 tonnes/year. The amount results from an
Shaw 1988, in McCarthy et al. 1992), but tectonics have            average anticyclonic circulation transporting aerosols with

Hydrogeology Journal (2009) 17: 1297–1328                                                         DOI 10.1007/s10040-009-0436-0
1303
a rate of 38.0 kg/ha/day (Tyson et al. 1996). It can be          topographic roughness is of great hydrological and
assumed that a constant fraction is continuously deposited       ecological importance. It is the key parameter for the
on the wetlands while the near surface aerosol layer is          small-scale distribution of dry and wet areas, of islands
recharged from higher layers. By comparison with                 and lagoons. The topographic roughness originates from
measurements by Swap (1996), the fraction or deposi-             and is preserved by several transport processes usually
tional rate is estimated to be 1.5% of the transport by          combining physical and biological mechanisms.
anticyclonic circulation. This leads to a deposited load of          Starting from a flat surface, islands are initiated by two
0.57 kg/ha/day, which considering a wetland area of              different mechanisms. Termites (Macrotermes michaeleni)
12,000 km2, amounts to an input of 250,000 tonnes/year.          accumulate fine-grained material to build termitaria which
    An export of particles from the Delta occurs through fires    are often several metres in height. Termitaria constructed
which are a common process in the wetlands. Most frequent        in seasonal floodplains will generally be tall enough to
are fires on dry floodplains, followed in frequency by fires        stick out of the water during seasonal flooding and
on drylands where biomass production is lower (Heinl et al.      vegetation types differing from those of the floodplain
2006). Less frequent are peat fires along abandoned channel       can eventually colonise the termitaria. (Dangerfield et al.
reaches. To date, no studies have been carried out to quantify   1998; McCarthy et al. 1998c). The second type of island
the related losses of mass from the system.                      initiation is related to bedload transport in channels of the
    On a smaller scale, Krah et al. (2004) examined the          fan. Infiltration to floodplains and evapotranspiration
importance of airborne transfer of locally generated dust        cause a decrease of channel discharges in the downstream
inside the Okavango wetlands. Passive wet dust collectors        direction as well as an associated decrease of the bedload
were installed along cross sections ranging from flood-           transport capacity. Bedload is thus deposited on the
plains to islands. Measurements at different elevations          channel bottoms, leading to aggradation. Channels are
above ground showed a rapid decrease of dust transport           flanked by a thick layer of peat and vegetation, which
with height. The major part of the dust transport occurs in      stabilises the bed and filters suspended sediment. These
the lowest 3 m. The amount of dust collected decreases           stable side walls allow the channels to rise to a higher
towards the islands. Simultaneous measurements showed            level than the surrounding floodplains. At some point the
that wind speeds also decrease towards the islands.              elevation difference is such that the channel dries out by
Therefore it is argued that dust is produced on the open         leakage through the peat layer or a new channel develops,
floodplains by relatively strong winds that can develop           leading towards the lower lying floodplains. The peat that
there. As the wind reaches the vegetated fringes of the          was flanking the channel dries, contracts and can
islands, its velocity decreases and dust is deposited. The       eventually burn (Ellery et al. 1989). What remains are
islands’ centres are composed of open grasslands or salt         elongated topographic enhancements which just like the
pans but are shielded by the surrounding vegetation              termitaria are above the seasonal flood level and can host
fringe. The amount of dust collected in the island centres       dryland vegetation types. This mechanism of channel
was even smaller than at the fringes. Krah et al. (2004)         aggradation and eventually topographic inversion was first
therefore concluded that island growth through dust              described by McCarthy et al. (1986a). The conceptual
accumulation occurs laterally, not vertically.                   model of the life cycle of channels was later revised by
                                                                 McCarthy et al. (1992) and Ellery et al. (1993b).
                                                                     The growth process of islands is identical regardless of
Topographic roughness                                            the initiation type. Matter is accumulated preferentially on
On a large scale, the Delta is a regular fan with a low          the shores of the islands leading to a lateral rather than a
gradient of about 1:3550 (Gumbricht et al. 2001).                vertical expansion. Due to the high salinity on island
However, deviations from a perfect conical surface exist         centres (described in the section on salt transport),
on various scales. Large-scale deviations over horizontal        vegetation is limited to the fringes. Transpiration of local
distances of tens of kilometres lie in a range of plus to        groundwater by plants accumulates solutes and favours
minus two meters in the vertical. It is remarkable that the      precipitation at the fringes. In addition, airborne particles
distribution of water is not clearly correlated with these       preferentially settle in the vegetated fringe. During the
deviations. Gumbricht et al. (2001) show that some               growth process several islands can coalesce. Which
channels flow in topographic lows, whereas others lie on          mechanism initiated an island is apparent because islands
topographic highs. Channels can remain in a topograph-           tend to preserve their elongated or circular shape when
ically unstable location because of stabilising vegetation       growing. Also, past termitaria can be detected—even
flanking the channels. The authors further note that the          when abandoned and eroded—as an accumulation of fine
most sensitive zone for water distribution is the floodplain      grained material (McCarthy 1992).
area at the end of the Panhandle where minor topographic
differences and vegetation growth may have a significant
impact in directing the flows.                                    Channel type and positioning
   A small-scale micro-topography with a standard devi-          The life span of channels in the fan is governed by
ation of typically around 50 cm along kilometre-long             sediment transport, whereas the exact positioning of the
transects is superimposed on the large-scale structures          onset of new channels depends on minor characteristics
(Gumbricht et al. 2005). Although of low amplitude, this         and is often influenced by hippopotamus paths (McCarthy

Hydrogeology Journal (2009) 17: 1297–1328                                                      DOI 10.1007/s10040-009-0436-0
1304
et al. 1998b). Historical records show that the switching of    shorelines of Lake Ngami at the south-western end of
water distribution from the Thaoge to the Nqoga and finally      the wetland system (see Fig. 1) reveals the presence of a
to the Maunachira took place over a period of approxi-          large lake along the Thamalakane Fault during the second
mately 100 years (McCarthy et al. 1986a, 1988). However         wet period and also around 2,000 BP (Shaw 1985). Shaw
one must be cautious in drawing conclusions regarding the       calculates that to maintain such a lake under present
life span of channels in the entire system based on findings     climatic conditions (except for a change in precipitation)
on a single channel. Underlying topography in the range of      and with present inflow to the wetlands through the
decimetres may have a significant impact on the life span        Okavango River, annual precipitation would need to
and thus it should not be expected that similar channel         increase by 160–225%, depending on the assumed outflow
systems necessarily have similar life spans.                    from the lake. Because changes in the flows generated in
    Channels of the Panhandle region upstream of the            the catchment are neglected, these figures represent absolute
Gomare Fault differ considerably in type from those of the      maximum values of necessary precipitation increase. Proof
fan region downstream of the fault (Tooth and McCarthy          of wetter conditions is also found in the presence of
2004). On the Fan, where the overall gradient of 0.00029        stromatolites 1–1.5 m above the present level of Ukhwi Pan
is noticeably steeper than in the Panhandle (0.00018),          in the central Kalahari of southern Botswana dated 17,000–
channels tend to be of straight (P10)              100 and 200 m3/s) and high flows in April–May (between
present active meandering because scouring of unconsol-         400 and 1,000 m3/s). The mean flow for the period of
idated sediment at the bank base is strong enough to            1933–2006 was 292 m3/s. The strong inter-annual
undermine the flanking vegetation, thus enhancing mean-          variation of peak flows contributes to the yearly variability
dering, whereas in relatively narrower channels (w/d
1305

                                     1000                                                       Monthly average
                                                                                                Yearly average

                                      800

                 Discharge [m 3/s]
                                      600

                                      400

                                      200

                                        0
                                            1940   1950   1960   1970        1980        1990          2000
                                                                 Year
Fig. 7 Monthly and annual averages of discharge measured at Mohembo (data acquired by the Department of Water Affairs, Botswana,
2007)

esis that a regional tilting may have shifted flows from the      promote flow to specific areas. Intensive dredging of the
western Thaoge system which received the major part of           lower Boro was carried out from June 1971 to December
flows in the middle of the nineteenth century, when David         1974 to ensure water availability for the Orapa Diamond
Livingstone visited the Delta, towards more easterly             Mine situated 200 km southeast of the Delta along the
located flow systems. They note that given the character-         Boteti channel. Its repercussions over two decades were
istics of channels to remain stable on relative topographic      studied in detail by Ellery and McCarthy (1998) at the
highs, tilting with elevation changes on the order of tens       request of Debswana Diamond Company. During the 3.5-
of metres over the whole Delta would be required to              year period, the last 17.5 km of the Boro River (upstream
change channel positions. What is overlooked is that             of its junction with the Thamalakane River) were
already changes of much smaller amplitude could have a           deepened by approximately 1 m. In the lowest 4.5 km,
significant impact on the water distribution within the           the deepening was up to 3.5 m and the channel was
existing channel network without changing the channels’          partially straightened. Low earth dikes were constructed at
position. In a sensitivity analysis, Bauer et al. (2006a)        various locations over the entire 17.5 km to prevent flows
tilted the topography of their distributed hydrological          to the floodplains. The impact on vegetation was large.
model by an angle of 0.00014° along an axis running              Floodplains isolated by earth dikes were colonised by
through the centre of the Panhandle. Over the approximate        terrestrial communities. Aquatic vegetation in the channels
30 km of width of the end of the Panhandle this                  was destroyed by excavation and was unable to recover as
corresponds to an elevation change of 0.075 m. Over the          a result of increased flow velocities. Due to increased
entire width of 300 km of the conical surface an elevation       sediment transport towards the deeply dredged reach,
change of 0.75 m is created. These 0.75 m would hardly           channel beds in sections upstream of the dredged reach
have been detected as anomalous on the diverse profiles as        were consecutively eroded and aquatic vegetation was
shown by Gumbricht et al. (2001). Still, they induce a           destroyed. Over the two decades between the dredging
noticeable change in the flood distribution. However, the         and the study by Ellery and McCarthy (1998), a 10.5 km
study by Bauer et al. (2006a) remains a sensitivity              long section of the channel upstream of the deeply
analysis and does not try to quantify changes in flooding         dredged reach was affected by erosion.
patterns resulting from specific tectonic events. McCarthy
et al. (1993b) demonstrated that tectonic movements are at
least on a small scale responsible for initiating water          Groundwater-surface water interactions
diversions. On a SPOT 2 satellite image showing the flood         in the Okavango Delta
of 1991 in the Maunachira area, it can clearly be observed
that the shoreline of the flood is linear over long distances.    The important role that local groundwater flows play in
These lineaments are aligned with known fault systems.           the hydrology of the Okavango Delta wetlands has been
However the question whether and to what extent tectonic         pointed out and studied increasingly over the last 30 years.
movements have contributed to the large-scale shifting of        The generally accepted theory is that, as the flood front
the flows away from the Thaoge system until now remains           advances into the Delta, a large fraction of the surface
open.                                                            water infiltrates through the highly permeable soil and the
                                                                 groundwater level rises to the surface before flooding is
                                                                 possible. Hydraulic conductivity of the soils has been
Anthropogenic impact                                             estimated in the range of 1.2·10−4–3.5·10−4 m/s and porosity
The anthropogenic impact on the flow distribution is              at 0.30 by Obakeng and Gieske (1997, in McCarthy 2006).
significant and cannot be neglected. It consists mainly of        The propagation of the flood therefore strongly depends on
dredging of channels and clearing of papyrus blockages to        the depth to groundwater, which itself depends on floods of

Hydrogeology Journal (2009) 17: 1297–1328                                                         DOI 10.1007/s10040-009-0436-0
1306
previous years and rainfall events. A high water table allows rise. The overall relation between infiltration, direct
for less infiltration and causes the flood to proceed further evaporation and evapotranspiration on the islands can be
downstream. This leads to a more extensive flooding and a studied with simple mass balances using the solute
higher outflow from the Delta. Storage of groundwater thus concentrations of different waters.
causes a memory effect. No continuous and consistent long-term time series of the
On a large scale, groundwater flows seem to be mainly total dissolved solid (TDS) concentration of the water flowing
vertical and the connection of the swamp water to regional into the Okavango Delta at Mohembo is available. Occasion-
groundwater appears to be very limited. Studies on stable al measurements and estimates by various authors indicate
isotopes (Dincer et al. 1978; McCarthy et al. 1998a) showed that the average TDS concentration is around 40 mg/l.
that the outflow from the wetlands to regional groundwater Assuming a constant TDS concentration of 40 mg/l and an
is spatially limited and of a small quantity. Nevertheless, average inflow of 300 m3/s at Mohembo, one can calculate
McCarthy (2006) notes that due to faulting, the basement the total amount of solutes entering the Okavango Delta
rocks beneath the Delta are highly fractured and that through the inflow as 3.8·109 kg/year. Typical rainfall TDS in
groundwater could possibly leave the area along these the region is around 5 mg/l (Gieske 1992). The average
discrete pathways. McCarthy (2006) also gives a summary wetland surface area is about 5,000 km2 (McCarthy et al.
of numerous studies on the near surface and regional 2003) and average rainfall, as recorded by Botswana Govern-
groundwater of the Okavango Delta. ment’s Meteorological Services, is about 480 mm/year. The
If one looks at the water balance of the Okavango resulting dissolved solute input by rainfall of about
Delta, evapotranspiration by far exceeds precipitation in 1.2·107 kg/year is negligible compared to the solute input by
yearly and monthly means. Groundwater recharge in the inflow. If the Boteti River, which conducts small
nonflooded areas is therefore quantitatively and temporal- ephemeral outflows over some tens of kilometres before also
ly limited. Regional groundwater was shown to originate drying, is included in the salt-balance calculation, the surface
from ephemeral strong rainfall events (Mazor et al. 1977). outflow of water and solutes from the balance volume is zero.
High tritium concentrations and temporal head variations Dincer et al. (1987) published an analysis of stable
in the shallow Kalahari Beds aquifer give proof of isotope and salinity data from different locations in the
recharge. An increase of tritium concentrations was Okavango Delta. Differences in the degree of accumula-
observed after the rainy season of 1970. Isotopic compo- tion of salinity and heavier stable isotopes were used to
sitions of water with respect to oxygen and hydrogen were infer the relative contributions of transpiration and
found to be on the light side of the southern African evaporation to the total water loss. Evaporation accumu-
meteoric water line. This also supports the hypothesis that lates both salinity and heavier stable isotopes (due to the
regional groundwater recharge occurs during strong rainfall fractionation occurring with the phase change of water),
events when only a small proportion is lost to evaporation. while transpiration accumulates salinity only, with no
Surface waters in the channels of the wetlands are isotope fractionation occurring in the roots where water is
isotopically heavier. Groundwater samples from within taken up from the source. Dincer et al. (1987) explained
the wetlands lie on the evaporation line, suggesting their salinity and isotope data with a simple plug flow
recharge from surface water. These results show that to a model and demonstrated high ratios of evaporation to
large extent the swamp system is hydrologically isolated transpiration in winter (vegetation is less active) versus
from the regional groundwater. Only at the western margin low ratios in summer (transpiration dominates).
of the wetlands, does the isotopic composition suggest Despite the significant salt mass input, surface waters
some mixing with regional groundwater. in the Okavango Delta are generally fresh. This indicates
Reflecting the low population density, the central part that a significant amount of surface water is not removed
and the eastern margins of the wetlands are poorly by evaporation from the water surfaces but by infiltration
equipped with boreholes. McCarthy et al. (1998a) derived to the shallow alluvial aquifers and subsequent evapo-
a long-term depth to the groundwater map from 167 transpiration. A simple mass-balance box model for the
boreholes in the Okavango region. The boreholes being surface water component reads
for the most part situated on the southern fringes of the
wetlands, the high information density in this area makes D
ðVcÞ ¼ Qin cin QGW c ð1Þ
it possible to map reasonably well the gradient of the Dt
piezometric surface. The water table is generally close to
the surface in the central wetlands and at the margins where V is the volume of the surface water component, c
drops with steep gradients to levels around 40 m below its concentration, Qin the inflow, cin the concentration in
surface. The mound shape of the piezometric surface the inflow and QGW the infiltration flow. Assuming steady
could be interpreted as leading to regional groundwater state in volume and concentration, one gets
recharge which would be in contradiction to the isotopic
studies. The likely explanation therefore is that the Qin cin
csteady ¼ ð2Þ
spreading groundwater lens is consumed through transpi- QGW
ration by deep-rooted vegetation. Direct evaporation is
limited to areas of very shallow water tables as the coarse where csteady indicates the steady state surface water con-
texture of the sandy soils does not allow a strong capillary centration. Surface water concentrations in the Okavango
Hydrogeology Journal (2009) 17: 1297–1328 DOI 10.1007/s10040-009-0436-01307
2
Delta are rarely higher than about 100–200 mg/l, and a about 1 m /day with typical Okavango parameters of T=
value of about 100 mg/l is a representative average. This 10−4 m2/s, ETmax =5 mm/day and dex =20 m. The large
implies that the infiltration flow is approximately 40% of extinction depth reflects significant transpiration fluxes
the total inflow. Note that infiltration takes away 40% of caused by deep-rooted vegetation. Multiplying this result
the water together with the solute mass contained in it. by 6,900 km of shoreline (island sizes larger or equal to
The concentration of the water remaining in the channels 100 m) results in an estimated total infiltration flux of
is not affected by the process. All the dissolved solutes 110 m3/s, which is equal to 37% of the inflow and of the
removed from the surface water by infiltration are same order of magnitude as the result of the box mass
accumulated in the shallow groundwater. balance calculation. In terms of system management, it is
Hydraulic gradients are steepest on the wetland/dryland thus important to preserve the long shoreline of the
interface. The infiltration water flux is thus concentrated Okavango Delta, to ensure high surface water quality.
along the shoreline of the Delta, where a fringe of riverine The ratio of infiltration and inflow has also been
vegetation and the associated transpirative demand estab- investigated in more local settings in the seasonally
lish large differences in water tables. Inside the permanent flooded areas where the largest annual variation in depth
wetlands, hydraulic gradients are much smaller and to groundwater is found. Boreholes which can be used to
consequently infiltration fluxes are minor. The specific quantify the infiltrating volume are still limited to a few
infiltration flux I per unit length of shoreline can be study sites. As expected, in these sites outside of the
estimated as (Bauer 2004) permanent swamp, the ratio of infiltration to evaporation
pffiffiffiffiffiffiffiffiffiffiffiffiffiffiffiffiffiffiffiffiffi is larger than the average value for the Delta as a whole.
I ¼ ETmax dex T ð3Þ This ratio further varies considerably during flooding.
A first attempt to quantify the locally infiltrating water
where T is the transmissivity of the aquifer, and the depth- is the field study by Dincer et al. (1976). A pool structure
to-groundwater dependence of the evapotranspiration is of 5.8 km2 in the seasonal swamps (adjacent to Beacon
assumed to obey the relationship Island in the Xudum area) was isolated in a way that in-
and outflow could be measured. Precipitation and evapo-
Sh ration were recorded on site. The water balance over two
ETðhÞ ¼ ETmax 1 : ð4Þ consecutive years showed that infiltration to the ground-
dex
water amounted to 4–5 times the losses by evaporation.
As shown by the stable isotope studies, the overall
In Eq. 4, ET is the actual phreatic evapotranspiration
wetlands do not act as a regional groundwater recharge
rate, h is the piezometric head in the aquifer, ETmax is the
system. This means that the important flows infiltrating
potential evapotranspiration rate, S is the elevation of the
locally in swamps are leaving the system by evapotrans-
topographic surface and dex is the so-called extinction
piration from adjacent islands.
depth of evapotranspiration.
A second local study by Ramberg et al. (2006a)
The shoreline length of the Okavango Delta was
focuses on a 0.4 km2 floodplain (Phelo’s floodplain)
estimated from an island database derived from satellite
which is also located in the seasonal swamps but adjacent
imagery (Gumbricht et al. 2004). Depending on the
to the 10 km wide Chief’s Island. Its inflow is limited to a
threshold island size, shoreline lengths are on the order
20–30 m wide channel. There is no outflow. Inflow was
of several thousand kilometres (Fig. 8). The specific
measured through a constructed flume for the floods of
infiltration flux I (Eq. 3), corresponding to the infiltrating
1997–1999. Calculations of changes in storage were based
volume per day and per meter of shoreline, is calculated as
on a local 10 m resolution digital elevation model. No
precipitation occurred during the studied flood seasons
and evapotranspiration was calculated using the Penman
formula with coefficients adjusted to reflect climatic
conditions of Botswana (these coefficients were derived
greater than island size [km]
10000 by SMEC 1987). Meteorological data were taken from the
Total shoreline of islands
station at Maun, some 53 km away. In addition to solving
5000 the water balance, point infiltration rates were directly
measured in several transects arranged perpendicularly to
the shore. Direct evaporation from the water surface was
calculated to amount to 9–12% of the annual inflows,
2000
leaving approximately 90% of the inflow for infiltration.
Extrapolation of the direct infiltration measurements to the
1000
10 100 250 500 1000 2500
entire floodplain yielded an infiltration rate between 40
Island size [m]
and 50% of the inflow. Several piezometers installed in the
floodplain revealed rises in groundwater levels of 1.5 m/
Fig. 8 The shoreline of the Okavango Delta expressed as the total
shoreline of permanent and seasonal islands with an equivalent day and higher immediately after the onset of inundation.
diameter greater than a given size (Gumbricht et al. 2004; Bauer et An important finding was that the groundwater rise
al. 2006c) diminishes quickly with distance from the flood front. A
Hydrogeology Journal (2009) 17: 1297–1328 DOI 10.1007/s10040-009-0436-01308
rise of 3 m was recorded in a piezometer located 20 m 1 year, whereas for the larger islands, an effect was
away from the maximum inundation perimeter of 1997, observed for the following 5 years. This means that after a
whereas in 1998 the flood stopped at a distance of 250 m prolonged drought, the groundwater levels underneath a
from the same piezometer, generating a rise of only 0.4 m. small island can be reset to normal in one single flood
Based on their results, Ramberg et al. (2006a) describe the season, whereas for a large island—where the ratio of
infiltration process in two phases. In the first phase, perimeter to area is much smaller—several flood seasons
vertical infiltration occurs through the vadose zone limited are necessary to raise the water levels back to normal.
only by vertical hydraulic conductivity. The entire soil Islands of less than 500 m in width are expected to display
column is not yet saturated at that point. In the second no memory effects, whereas long-term effects are
phase, once the groundwater level has reached the surface, expected on larger islands and on the fringes of the
a process which took 1–3 days at the studied site, lateral wetlands. Island vegetation is not sensitive to a few years
infiltration towards island areas takes place and is limited of drought as it continues to extract water from the deeper
by horizontal hydraulic conductivity and gradients to- water storage.
wards the island. High infiltration capacities of 4.6·10−4– On an island, at the limit between the seasonal and the
1.2·10−3 m/s found by Boring and Björkvald (1999) permanent swamp, McCarthy and Ellery (1994) detected
confirm the very intensive first infiltration phase. diurnal fluctuations of the water table in piezometers
Wolski and Savenije (2006) present the results of located in the densely vegetated fringes of the island.
further studies on the same (Phelo’s) floodplain as well as Fluctuations did not exceed 1.5 cm in the island centre
on a nearby location comprising a regularly flooded area and amounted to a maximum of 7 cm towards the island
(Boro channel floodplain) and the adjacent island (Camp edge. The fluctuations could be ascribed to the daily
Island). Two series of piezometers are installed in trans- transpiration cycle. Bauer et al. (2004) measured similar
ects reaching from the floodplains to the dry land side. diurnal fluctuations on Thata Island and used these
Evaluation of the time series of piezometric heads reveals fluctuations to estimate evapotranspiration rates. They
that at both locations the gradient is always directing interpreted the measurements with a conceptual model of
groundwater flow towards the island. Reversal of the local an island, with fixed heads at the shores and time
groundwater flow back to the swamp has never been dependent uniform evapotranspiration from the surface,
observed either during or after recession of the flood level. neglecting spatial variation of ET due to non-uniform
This is in agreement with findings from the Okavango landcover and salinity gradients. A comparison with the
Research Group of the University of Witwatersrand, South isotope profile method to estimate evaporation showed
Africa: McCarthy et al. (1991a) studying an island in the good agreement for the centre of the island. Because of
north-eastern part of the wetlands (north of Maunachira the very sparse vegetation in the centre of Thata Island,
Lediba), McCarthy and Ellery (1994) for an island transpiration can be neglected there.
situated in the central wetlands at the limit between At large scales, surface-water groundwater interactions
permanent and seasonal swamps (island at Xaxaba), and in the Okavango Delta are mainly characterised by vertical
McCarthy and Ellery (1995) for the Camp and Atoll flows. Despite the high infiltration rates, no regional
Islands close to a main channel in the seasonal swamps groundwater recharge occurs and the aquifer serves as a
(see Fig. 1 for location of the islands). The constant flow buffering reservoir between highly seasonal flooding and
direction plays a key role for solute transport character- more regular evapotranspiration. On a small scale,
istics of the wetlands. however, lateral groundwater flow towards islands is one
Wolski and Savenije (2006) built simple numerical of the main mechanisms regulating the hydrology of the
models of their two study sites. They conceptualised the Okavango Delta wetlands. The size and distribution of the
underground in two zones: highly permeable floodplain multitude of islands covering the wetlands determine,
deposits and island soils of low permeability. Time together with antecedent conditions and precipitation,
dependent constant head boundaries were defined at the which portion of the annual flood infiltrates to local
floodplain side of the models. The calibrated models groundwater. The difference between regional and local
succeed in reproducing the observed water levels at the flows is underlined by the groundwater level gradients
piezometric transects over several years. Evaluation of which are on the order of ∼1:4000 at the regional scale but
the model results shows that the highest groundwater as high as 1:200–1:100 at the local scale (Wolski and
flows of 0.55–0.6 m2/day) occur during flood rise, but Savenije 2006). With the strong linkage between flood-
even before the flood arrives, flows are also substantial water and island groundwater, not only the floodplain
at 0.4–0.5 m2/day. The gradient towards the island stays vegetation but also the adjacent riparian vegetation is
high as a result of the sizable evapotranspiration losses strongly dependent on frequency and length of flooding.
from the island throughout the year.
The importance of antecedent conditions on the
infiltrating volume is studied by changing the initial The upstream catchment area
hydraulic heads in the model. Initial conditions for 1, 2,
3 and 10 years without flooding were simulated and fed The division between the Okavango catchment and the
into the models. For the floodplain linked to the smaller distributary system of the Okavango Delta is geomorpho-
island, the effect of antecedent conditions vanished within logically defined by the entrance of the Okavango River
Hydrogeology Journal (2009) 17: 1297–1328 DOI 10.1007/s10040-009-0436-0You can also read