HEALTHY CHICAGO 2.0 PARTNERING TO IMPROVE HEALTH EQUITY 2016 - 2020 - City of Chicago
←
→
Page content transcription
If your browser does not render page correctly, please read the page content below
HEALTHY CHICAGO 2.0
PA R T N E R I N G T O I M P R O V E H E A LT H E Q U I T Y
                         2016 - 2020
HEALTHY CHICAGO 2.0

                      Dear Fellow Chicagoans,

                      Four years ago, I joined the Chicago Department of Public Health (CDPH) to
                      launch Healthy Chicago, the first public health agenda designed to improve the
                      health of all Chicagoans. Since that time, we have made historic strides: tobacco
                      rates for youth have reached an all-time low and life expectancy for Chicagoans
                      has reached an all-time high. These are accomplishments to celebrate. But at
                      the same time, our work is not yet done. Too many Chicagoans continue to be
                      affected by preventable diseases, too many continue to be burdened by and
                      endure the effects of violence and too many do not have access to resources
                      and opportunities that allow them to lead healthy lives. Data show that health
                      inequities are wide and we must do more to eliminate the unjust differences
                      in health that exist among Chicago communities and across the lines of race,
                      ethnicity, socioeconomic status, age, gender identity and sexual orientation.

                      Healthy Chicago 2.0 is the next step in our ongoing effort to ensure that every
                      resident of Chicago has the opportunity to live a healthy life. Focusing on areas
                      where health disparities remain, this plan provides over 200 actionable strategies
                      to reduce inequities and improve the health and vitality of our residents and our
                      city. By addressing both traditional health issues such as chronic disease and the
                      root causes of poor health such as transportation and housing, Healthy Chicago
                      2.0 aims to ensure that every child raised in Chicago, regardless of neighborhood
                      and background, has the resources and opportunities to live a healthy life.

                      I invite you to join our more than 130 partner organizations to put this plan into
                      action as we work to make Chicago the healthiest city in the nation.

                      Rahm Emanuel
                      Mayor, City of Chicago
HEALTHY CHICAGO 2.0

Dear Partners,

Chicago is my home. My parents came to Chicago after being relocated from the
west coast during World War II. With the support of community organizations,
churches and extended family, they were able to create a safe, stable and
supportive environment for my brothers and me. As a result, we have been able to
lead healthy and productive lives and my husband and I have been able to do the
same for our two children. My vision is for all Chicago residents to have the same
opportunities that have allowed my family and me to thrive. As Commissioner for
the Chicago Department of Public Health (CDPH), I have the unique opportunity
to lead a department that has the responsibility to do just that.

CDPH is responsible for maximizing the health and well-being of every Chicago
resident, but our department alone can’t accomplish that goal. We know that
good health depends on numerous factors, including many that are outside of
the traditional public health sphere. The availability of economic resources, the
conditions of the homes in which we live, our educational opportunities and the
degree to which we feel safe and connected in our neighborhoods play critical roles
in improving our health. That is why the development of Healthy Chicago 2.0 is an
important milestone for Chicago.

Healthy Chicago 2.0 is a plan for the entire city. As part of the planning process,
we convened representatives from more than 130 organizations across a broad
range of sectors to review data and then identify actionable strategies to address
our city’s most pressing health issues and their root causes.

The plan is a result of a collaborative effort. Its implementation, similar to its
development, is dependent on partners across the city working together to make
the changes necessary to improve health. I am grateful for the businesses, non-
profit organizations, philanthropic agencies, faith-based networks, advocacy
groups, other government agencies and residents who devoted a great deal of time
and energy to create this plan and who have committed resources and human
capital to see that the goals in this plan are realized.

Achieving health equity will take time, resources and dedication. I look forward to
working together to create a Chicago where every resident has the opportunities,
resources and information necessary to live a healthy life.
Julie Morita, M.D.
Commissioner, Chicago Department of Public Health
HEALTHY CHICAGO 2.0

TABLE OF CONTENTS

                                                           HEALTHY CHICAGO 2.0
               TABLE OF CONTENTS
Introduction............................................................................. 1       Chapter 3: Increasing Access to Health Care &
           Healthy Chicago 2.0 Vision........................................ 1                   Human Services...................................................................29
           Process: Assessment & Action Teams................... 2                                           Components of Access........................................ 32
           Framework....................................................................... 3
           Overarching Outcomes............................................... 7                  Chapter 4: Improving Health Outcomes..............35
           Health in All Policies..................................................... 8                     Promoting Behavioral Health................................ 38
           Trauma-Informed City................................................. 9                           Strengthening Child & Adolescent Health........ 42
                                                                                                             Preventing & Controlling Chronic Disease....... 46
Chapter 1: Expanding Partnerships &                                                                          Reducing the Burden of Infectious Disease .... 52
Community Engagement..............................................11                                         Reducing Violence .................................................... 56
           Components of Community Engagement...... 12
                                                                                                  Chapter 5: Utilizing and Maximizing Data
Chapter 2: Addressing the Root Causes                                                             and Research.........................................................................61
of Health...................................................................................15
                                                                                                  Chapter 6: Taking the Next Step...............................65
           The Built Environment............................................. 16
           Economic Development.......................................... 18                      Healthy Chicago 2.0 Indicators..................................68
           Housing.......................................................................... 20
           Education...................................................................... 24     Acknowledgments.............................................................72

                                                                                                  References...............................................................................76
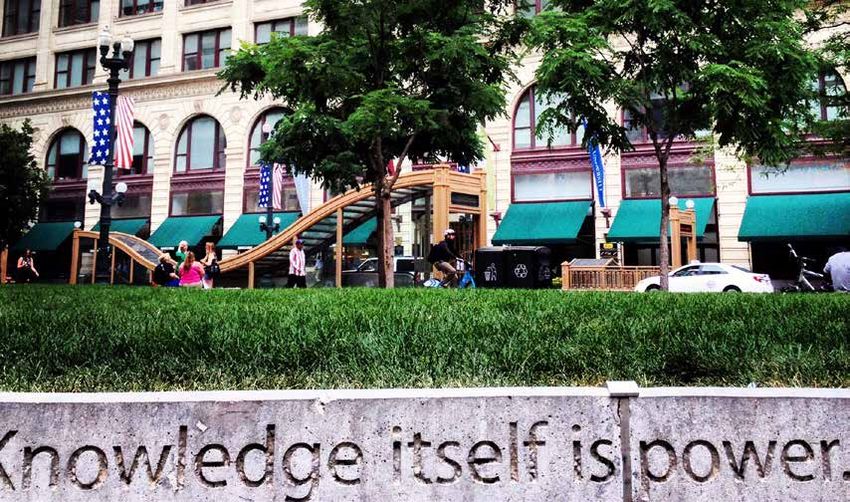
Health equity is achieved when
every person has the opportunity to
attain his or her full health potential.1

HEALTHY CHICAGO 2.0 VISION
  A city with strong communities and collaborative
  stakeholders, where all residents enjoy equitable
  access to resources, opportunities and environments
  that maximize their health and well-being.
  Healthy Chicago 2.0 has an underlying goal of achieving health equity and a commitment to reducing
  health inequities in our city. This vision will be achieved when Chicago’s public health system, a
  multi-sector network of organizations such as health care providers, government agencies, social
  service providers, advocates, academic institutions, businesses and faith-based organizations, works
  collectively to improve the health of the population.

                                                                                                         1
INTRODUCTION

PROCESS:
ASSESSMENT & ACTION TEAMS
In September 2014, the Chicago Department       Action Areas:
of Public Health (CDPH), in collaboration                                                        The Partnership for Healthy
                                                1. Expanding Partnerships and Community
with the Partnership for Healthy Chicago,
                                                   Engagement                                    Chicago is a public-private
launched a comprehensive community
health assessment to collect and analyze        2. Improving Social, Economic and                partnership of multi-sector
health data and, from those findings,              Community Conditions
                                                                                                 stakeholders, convened by
identify strategic issues to improve health     3. Improving Education
equity in Chicago. We used the National                                                          the Chicago Department
Association for County and City Health          4. Increasing Access to Health Care and          of Public Health, who
Officials (NACCHO) Mobilizing for Action           Human Services
                                                                                                 are working together to
through Planning and Partnerships (MAPP)        5. Promoting Behavioral Health
to conduct this assessment.2 As part of the                                                      strengthen the public
community health assessment, nearly 1,000       6. Strengthening Child and Adolescent            health system.
public health stakeholders and residents           Health
participated in reviewing more than ten         7. Preventing and Controlling Chronic
million data elements to identify health           Disease
                                                                                              At the beginning of the process, all
gaps.
                                                8. Preventing Infectious Diseases             action team members received training
Public health stakeholders and residents                                                      on developing the plan and then spent
                                                9. Reducing Violence
reviewed data and then identified 10 priority                                                 five months formulating specific goals,
action areas. The priority areas include both   10. Utilizing and Maximizing Data and         objectives and strategies. These actionable
health outcomes as well as the root causes          Research                                  strategies form Healthy Chicago 2.0,
of health.                                                                                    Chicago’s four-year community health
                                                After completing the community health
                                                                                              improvement plan. Each strategy is focused
                                                assessment, CDPH convened action teams
                                                                                              on closing or eliminating health inequities.
                                                focused on the 10 priority areas. These
                                                action teams, each co-chaired by a CDPH
                                                staff person and a community partner,
                                                engaged over 200 public health stakeholders
                                                including community members, non-profit
                                                leaders, health care workers, city agency
                                                leaders and others.

2
INTRODUCTION
FRAMEWORK
This plan is organized into six chapters: Objectives of Healthy Chicago 2.0
Goals: The vision to be are to be achieved by 2020. There
1. Expanding Partnerships and Community
are 82 objectives in total; 42 focus on
achieved within each Engagement
making changes citywide and 25 focus
action area 2. Addressing the Root Causes of Health specifically on a population subgroup, such
3. Improving Access to Health Care and as residents living in economic hardship or
Strategies: Evidence-based/ Human Services youth living in areas with low opportunity
informed or innovative for healthy development. Other factors
4. Improving Health Outcomes examined include a specific race-ethnicity,
approaches to achieve the age, housing status, sexual orientation and/
5. Utilizing and Maximizing Data and
goal Research or gender identity group. Included in the 82
objectives are 11 objectives, indicated by ,
Objectives: Specific, 6. Taking the Next Steps that were identified by stakeholders to
measurable, achievable, Each chapter includes a brief background address data gaps. Additionally, there are
relevant and time-bound with data and maps to help visualize the four novel objectives, indicated by , that
issue, as well as the goals, objectives and were determined to be vitally important
indicators to measure the to the plan despite the fact that baseline
strategies that will guide the implementation
success of our strategy of this plan. and target data do not currently exist for
implementation the specific measure. It remains an overall
strategy of this plan to explore new ways
of reliably and accurately measuring these
novel objectives by 2020.
3
Low
                                                                                                                                 Medium
 INTRODUCTION                                                                                                                    High

                                                                                                                       Economic
                                                                                                                       Hardship Index
                                                                                                                             Low
                                                                                                                             Medium

               835,249
                                                                       A
                                                                               B                                             High

                                                                                       D

             Chicagoans were living in                                     C

                                                                                               F

     HIGH ECONOMIC HARDSHIP                                                        E

                           in 2014                                                         G

                                                                                                       I

                                                                                           H                   J

                  COMMUNITY AREAS                                                                                  O

                    most impacted                                                  K
                                                                                                   L
                                                                                                           M
                                                                                                               N

         A   Belmont-Cragin           N Fuller Park
         B Hermosa                    O Oakland                                 Q                      U

             835,249
                                                                           P

         C Austin                     P West Elsdon                                           T
                                                                                      S
         D Humboldt Park              Q Gage Park                               R

                                                                                                         V
          E West Garfield Park        R Chicago Lawn
         Chicagoans
         F                   were living
             East Garfield Park       S West inEnglewood                                W

HIGH ECONOMIC HARDSHIP
                                                                                                                                      Y
         G North Lawndale             T Englewood
         H South Lawndale             U Washington Park
                         in
          I Lower West Side
                            2014      V Greater Grand Crossing
                                                                                                                 X

          J Armour Square             W Auburn Gresham
         K Archer Heights             X Burnside
               COMMUNITY AREAS
         L Brigthton Park
                   most impactedZ South Chicago
                                      Y
         M New City                      Riverdale
 A       Belmont-Cragin            N Fuller Park
                                                                                                               Z
 B       Hermosa                   O Oakland
C        Austin                    P West Elsdon                                          US Census, American Community Survey, 2014 5-Year Estimate

D        Humboldt Park             Q Gage Park
 E       West Garfield Park        R Chicago Lawn
 F       East Garfield Park        S West Englewood
 G         TheLawndale
         North   Economic Hardship        Index
                                   T Englewood           of persons over the age of 16                 individual measures such as
 H         compares
         South  Lawndale  social and economicPark years who are unemployed);
                                   U Washington                                                        income or employment alone. A
 I       Lower  West  Side
           conditions between Chicago
                                   V Greater Grand  Crossing
                                                         (iv) education (percentage of                 community with a high hardship
 J       Armour  Square
           communities.            W Auburn Gresham persons over the age of 25 years
                              The hardship                                                             score has worse social and/
 K       Archer Heights            X Burnside
           index is a relative composite                 without a high school education;              or economic conditions than
 L       Brigthton Park            Y South Chicago
           index of six indicators:     (i)              (v) dependency (percentage                    a community with a low or
M        New City                  Z Riverdale
           crowded housing (percentage                   of the population under 18 or                 medium hardship score.
           occupied by housing units                     over 64 years of age) and (vi)
           with more than one person per                 income (per capita income). The
           room); (ii) poverty (percentage               hardship index provides a more
           of persons living below the                   complete, multidimensional
           federal poverty level); (iii)                 measure of community
           unemployment (percentage                      socioeconomic conditions than

     4
INTRODUCTION
Child Opportunity
Index
Very High
High
Child Opportunity
Moderate
Index Low
Very HighVery Low
High
48%
Moderate
Low
Very Low
of children in Chicago are living in A
LOW CHILD OPPORTUNITY AREAS
48%
B
C
of children in Chicago are living in D
LOW CHILD OPPORTUNITY AREAS
COMMUNITY AREAS
with lowest child opportunity
F
E
G H
A Austin I West Englewood
K
B West Garfield Park J Englewood
C North Lawndale K Washington Park
COMMUNITY AREAS L West Pullman
J
I
D South Lawndale
with lowest child opportunity
E Archer Heights M Riverdale
A AustinF Brigthton Park I West Englewood
N South Deering
B West Garfield Park
G New City
J Englewood
O East Side
ex C North HLawndale
Fuller Park K Washington Park
P Hegewisch
D South Lawndale L West Pullman
E Archer Heights M Riverdale O
F Brigthton Park N South Deering
N
G New City O East Side
H Fuller Park1 in 2 AfricanP Hegewisch
American and L
Hispanic children live in M
P
low child opportunity areas diversitydatakids.org and Kirwan Institute, 2014
compared to 1 in 50 white children
1 in 2 African American and
Hispanic children live in
The Child Opportunity Components of the Child Health & Environmental
lowIndex
child opportunity
measures communityareas Opportunity Index • Retail healthy food index
compared to 1 in 50that
characteristics white children
influence a Educational • Proximity to toxic waste release
sites
child’s health and development. • Adult educational attainment
• Volume of nearby toxic release
These features are organized into • Student (school) poverty rate
• Proximity to parks and open spaces
• Reading proficiency rate
three overarching domains of • Housing vacancy rates
• Math proficiency rate
opportunity: educational, health • Early childhood education
• Proximity to health care facilities
and environmental, and social neighborhood participation patterns Social & Economic
and economic. All of these factors • High school graduation rate • Neighborhood foreclosure rate
are combined into a relative, • Proximity to high-quality early • Poverty rate
childhood education centers • Unemployment rate
composite measure of overall
• Proximity to early childhood • Public assistance rate
opportunity for children living education centers of any type • Proximity to employment
within a particular community.
5INTRODUCTION 6
INTRODUCTION

OVERARCHING OUTCOMES
   Healthy Chicago 2.0 outlines 30 goals,        Through our combined efforts, Healthy
   82 objectives and over 200 strategies         Chicago 2.0 will result in a number of
   across 10 action areas. Many strategies are   overall health and system improvements for
   cross cutting, and employ policy, systems     Chicago residents, including:
   and environmental change. If all are
                                                  1. Increasing life expectancy
   implemented in concert, we will achieve
   even greater success.                          2. Reducing obesity
                                                  3. Reducing preventable hospitalizations
                                                  4. Reducing discrimination
                                                  5. Improving overall health
                                                  6. Reducing economic hardship
                                                  7. Increasing opportunities for children to
                                                     live healthy lives
                                                  8. Institutionalizing a Health in All Policies
                                                     approach
                                                  9. Becoming a Trauma-Informed City

                                                                                              7
INTRODUCTION
HEALTH IN ALL POLICIES
Healthy Chicago 2.0 was developed and Healthy Chicago 2.0 will formalize a
will be implemented by a diverse group Health in All Policies approach for the City “Root causes of health
of individuals and organizations, as every of Chicago government, ensuring every
sector and individual is responsible for city agency approaches its work using a [social determinants of
improving and maintaining the health health equity lens. By collaborating directly health] are life-enhancing
of our city. This collaboration is guided with other agencies, we will not only meet resources, such as food
by the Health in All Policies approach, the goals outlined in this plan but also
which encourages institutions to consider lay the foundation for ongoing health supply, housing, economics,
the health impacts of their policy and improvements across Chicago. social relationships,
programming decisions.3 At its core, transportation, education
Health in All Policies addresses the social
determinants of health—the root causes of and health care, whose
health outcomes and health inequities— distribution across
through five key elements: 1) promoting populations effectively
health and equity, 2) supporting multi-
sector collaboration, 3) creating benefits for
determines length and
multiple partners, 4) engaging stakeholders quality of life.”4
and 5) creating structural or process change.
“When it’s better for
everyone ... it’s better
for everyone.”
—Eleanor Roosevelt
8INTRODUCTION
TRAUMA-INFORMED CITY
To further improve health outcomes that A Trauma-Informed City utilizes this
Becoming a Trauma- are often worsened by exposure to violence, knowledge to develop policies and system
we must work toward making Chicago a improvements that ensure effective
Informed City will require Trauma-Informed City. Trauma-Informed responses to recovery from trauma and
significant changes in is grounded in service delivery, and to prevent individuals from being re-
attitude, knowledge and directed by a thorough understanding of traumatized by individuals, schools,
the neurological, biological, psychological churches, organizations and government
practice. and social effects of trauma and violence agencies with which they interact. Chicago
on humans and groups.4 Functioning as a will strengthen efforts by collecting
Trauma-Informed City requires significant new data on the impacts of trauma,
changes in attitude, knowledge and practice, discrimination and racism. Chicago will
with all of our city agencies and community- also work toward a shared understanding
based organizations becoming trained in of how trauma impacts communities and
the impact that trauma has on our residents. will develop approaches to remediate and
Many organizations have already begun this build resiliency among those most impacted
effort by training their staff and community across Chicago.
members in the areas of Trauma 101, Mental
Health First Aid and Psychological First Aid.
9CHAPTER 1
EXPANDING PARTNERSHIPS
& COMMUNITY ENGAGEMENT
Healthy Chicago 2.0 was developed through direct engagement with community members and part-
ner organizations. Along with CDPH, organizations across many sectors have been involved throughout
the assessment and planning phases and will be involved with implementation and evaluation. Over
200 individuals from more than 130 agencies helped design this health improvement plan. Healthy
Chicago 2.0 is four-year collaborative plan; as such, the goals and objectives outlined in this report will
be met only through ongoing, collaborative engagement in the strategies outlined.
11PARTNERSHIPS &
COMMUNITY ENGAGEMENT
This chapter outlines strategies to expand To maximize impact, we must also harness
partnerships and community engagement. the skills and talents of Chicago’s most
COMPONENTS By aligning efforts, Chicago will be better important asset: its people. By engaging
positioned to apply for new and existing residents in implementation and evaluation,
OF COMMUNITY funding opportunities. In addition, by
working collaboratively across sectors, there
we will build individual capacity, multiply
effectiveness and improve sustainability of
ENGAGEMENT is an opportunity to identify new partners in
the private and philanthropic communities
the plan.1 This plan ensures that community
voices and perspectives are continually
who could invest in public health. engaged through strategy implementation
Leverage Partnerships for and evaluation efforts. CDPH and partners
Healthy Chicago 2.0 can also strengthen
Promoting Health Equity will periodically assess partner composition
partnerships across sectors to align co-
Build trust, support and and participation and will evaluate decision-
occurring efforts, including hospital
making to ensure we have an inclusive
rapport by building multi- community health needs assessments,
process.
sector awareness and focusing local and state policy agendas for non-
community mobilization on profit organizations and emerging grant
opportunities. By better coordinating efforts,
health equity we will maximize our impact.
Funding Opportunities
Align and expand funding through
collaborative funding models with
“Alone
both private and public entities
Educate Community on we can do so little;
”
Public Health Issues
Connect Healthy Chicago 2.0
messages about health education
together we can do so much
—Helen Keller
and community engagement
12PARTNERSHIPS &
COMMUNITY ENGAGEMENT
GOAL Public health funding will be coordinated and expanded across philanthropic agencies, the
1 public sector and the private sector
Strategies
• Establish a public health funding • Make new investments in communities • Invest hospital community benefit dollars
collaborative that will inspire shared and in interventions that address health in jointly prioritized areas from hospitals
and coordinated investments among inequities and local public health systems
philanthropy, business and the public
sector
GOAL Community residents will be active champions for health equity
2 Strategies
• Provide consistent communication to
community residents regarding developing
• Improve the cultural appropriateness of
public health messaging to ensure that all
• Support, develop and implement public
health policies that are driven by the
efforts at the city level to ensure a Health residents receive health information they community
in All Policies approach to community understand and can act on
engagement • Offer trainings for community residents
• Diversify and develop innovative so they can be champions of policies that
• Leverage the media to educate and engage communication methods utilized by the promote health and quality of care
community members on public health public health system
issues
13“When it comes to health,
your zip code matters more
than your genetic code.”
—Tony Iton, MD, JDCHAPTER 2
ADDRESSING THE ROOT
CAUSES OF HEALTH
Health is defined as a state of complete physical, mental and social well-being.1 In Chicago, residents do not
have equitable access to the systems and opportunities that contribute to good health. More than our individual
behaviors, it is our homes, schools, workplaces and communities that most impact our health. Income, housing
quality, community conditions and education quality are root causes–that is, the things in our environment that
support or prevent us from being healthy.
The root causes of health include both the social determinants of health and structural inequities, or societal
systems that unjustly benefit one population more than another. Health inequities are perpetuated in policies
and organizational systems through structural racism, sexism, homophobia, transphobia, discrimination and
stigma. The strategies outlined throughout this plan aim to reduce discrimination and structural inequities.
By improving social and structural determinants of health, a significant impact can be achieved for our community’s
health. As such, Healthy Chicago 2.0 provides actionable strategies to create the necessary policy, systems and
environmental changes (PSE) to impact health. PSE emphasizes strategies that impact entire organizations or
communities, or that involve physical or material changes to the economic, social or physical environment.
Economic development and community improvement efforts will require policy and planning approaches that
safeguard against the displacement of families and communities. As conditions are improved in high-need
communities, it is essential that those who can benefit most from such improvements are able to remain in their
homes and communities. Honoring Chicago’s diversity and ensuring inclusiveness of the city are both essential
to health equity.
Though there are numerous social determinants that impact the health of our communities, four key areas are
included in this plan: the built environment, economic development, housing, and education.
15ADDRESSING ROOT CAUSES
THE BUILT ENVIRONMENT
Sidewalks and streets, public transit, sewers, parks, Climate change also impacts public health. Overall
community centers and landscaping are part of the built temperatures in Chicago are expected to increase, with
environment. The built environment influences health by severe heat waves projected to occur two to five times
providing or preventing opportunities for physical activity, per decade by mid-century. There is a trend for increased
adequate transportation and social connectedness. precipitation during storms, leading to an increased
potential for flooding; the timing of precipitation may
Inadequate infrastructure for active transportation exists
change, as well.3 Both heat waves and flooding cause
in many low-income communities and communities of
stress on households, with lower income households
color, which are more likely to have poorly maintained
having fewer resources to recover from such disasters.
sidewalks and streets and increased dangers from traffic.
Healthy Chicago 2.0 will work to minimize the negative
Fatalities from traffic crashes disproportionately impact
effects of climate change.
African American communities.1 In addition, street design
neglects the needs of older adults, people with disabilities
“The
and children. Even when physical activity resources
are available, some residents may limit the use of these
resources due to community safety concerns, lack of
transportation or user fees.2
environment is not well-
Chicago is working to end these inequities. The Chicago
Department of Transportation (CDOT) recently expanded
protected or regulated. We
its Divvy bike share program to more communities, north
must think about the impact
”
to south from Touhy Avenue to 76th Street and east to
west from Lake Michigan to Pulaski. The Chicago Transit
Authority (CTA) recently renovated the south branch on our health.
of the Red Line, improving an integral transportation —Community Conversation Participant
corridor through several economically disadvantaged
communities. Healthy Chicago 2.0 builds on these
successes with additional strategies to ensure the built
environment can support and promote health.
16ADDRESSING ROOT CAUSES
Chicagoans who
B
walk, bike or take
public transit to work
C
E 42.1 - 66.8 %
A D
31.6 - 42.0 %
21.2 - 31.5%
9.6 - 21.1 %
G
F
H I
Only 37%
of Chicagoans use
ACTIVE TRANSPORTATION
to get to work
K
COMMUNITY AREAS J L
with the lowest rate of
active transportation M
A O’Hare K Archer Heights N
B Edison Park L West Elsdon
C Norwood Park M Clearing
D Jefferson Park N West Lawn O
E Forest Glen O Ashburn
F Dunning P Beverly
G Portage Park Q Mount Greenwood
H Montclaire R Morgan Park P
I Belmont Cragin S East Side
S
J Garfield Ridge T Hegewisch
Q
R
T
US Census, American Community Survey, 2010-2014 5-Year Estimate
17ADDRESSING ROOT CAUSES
ECONOMIC DEVELOPMENT
Income inequality in the United States is greater today There has been positive momentum in addressing some
than at any point since 1928. The top 1% of families have of these issues. In 2014, the Chicago City Council passed
22.5% of total annual income, while the bottom 90% of Mayor Emanuel's minimum wage ordinance that applies
families share only 49.6%.1 The median African American incremental raises starting in July 2015 and reaching
household income in 2014 was only 39.5% of the median $13 per hour by 2019, which will lift an estimated70,000
white household income.2 Wealth inequities are even workers out of poverty.6
greater, with the richest 20% of US families holding 88.9%
of all wealth.3 This inequity affects not only the health of
those with lower incomes and wealth, but also decreases
“The
life span and increases illness across the income spectrum,
including for those at the very top.4
As of November 2015, Chicago had an unemployment rate
cost of living
of 8.4% compared to 4.8% nationwide. African Americans
increases but wages
remain the same.”
in Chicago are more than 2.6 times more likely to be
unemployed than whites, 14.7% to 5.7% respectively.
Some community areas have unemployment rates as
high as 40.4% (Riverdale) and 37.1% (Englewood). Many
of those employed do not have jobs that provide a living —Community Conversation Participant
wage, benefits, safe working conditions, predictable hours
and earned sick and family leave. In 2012, only 68% of
men and 57% of women in Chicago earned at least $15
an hour.5 These statistics show that both historical and
current patterns of inequities in pay disproportionately
disadvantage people of color and women.
18ADDRESSING ROOT CAUSES
Unemployment Rate
4.2 - 9.3%
9.4 - 13.9%
14.0 - 22.1%
22.2% - 40.4%
A
African Americans are
2.6X
MORE LIKELY E
to be unemployed than whites
D
B C
I
H K
G
F
COMMUNITY AREAS J
most impacted L
by unemployment
A North Lawndale K Woodlawn
M
B New City L South Shore N
C Fuller Park M Auburn Gresham
D Grand Boulevard N Chatham
E Oakland O Washington Heights O
F Chicago Lawn P Roseland P
Q
G West Englewood Q Pullman
H Englewood R West Pullman
I Washington Park S Riverdale
J Greater Grand Crossing
R
S
US Census Bureau, American Community Survey, 2010-2014 5-Year Estimates
19ADDRESSING ROOT CAUSES
HOUSING
Access to affordable, safe and healthy housing is crucial Almost 40% of households in Chicago spend more than
for supporting people’s health. Poor housing conditions one-third of their monthly income on either rent or
are associated with infectious diseases, chronic diseases, their mortgage. In the Hermosa community, 52% of all
injuries, poor child development and mental illness. households experienced this housing cost burden. Severe
Specific examples include respiratory infections and housing cost burden, meaning 50% of income is spent on
conditions like asthma, cardiovascular disease, cancer, housing, is related to higher incidence of death from heart
lead poisoning and psychological distress. Lack of disease and other chronic diseases.6
affordable housing can restrict where people live and the
Stable housing is recognized as an important and effective
quality of the places in which they live; it can also impact
intervention for individuals with chronic health problems.
the proportion of household income spent on housing.1,2
In a recent study, 96% of individuals in permanent
Chicago’s housing stock is old, with 54% of homes built supportive housing were still permanently housed at
before 1950. Many of the buildings that have not been the end of a year, compared to only 34% of those in an
appropriately maintained, renovated or repaired have emergency shelter and 66% of those in interim housing.7
“Healthy
home-based hazards that put families at risk of serious
health problems. A significant housing-related health
threat in some homes is childhood lead poisoning, often
caused by ingesting and breathing in lead-based paint
people are those
dust.
Housing hazards are often related to poverty. Families
who live in healthy homes
living in or near poverty have fewer affordable options and
can end up in housing that is less likely to be maintained,
on a healthy diet; in an
with poor insulation, broken windows and inefficient
wiring. This leads to higher utility costs, which make it environment equally fit
for birth, growth, work,
even harder to afford remediation of the health hazards.
healing and dying. ” —Ivan Illich
20ADDRESSING ROOT CAUSES
Children under 3 years
with elevated
blood lead levels
(>6mcg/dl)
0.0 - 1.2 %
1.3 - 2.4 %
2.5 - 4.0 %
4.1 - 10.1%
A
Community Areas
with Very Low
Child Opportunity
C
B
D E
3.5%
of Chicago children under 3 have
F
G
ELEVATED BLOOD LEAD LEVELS
H I
K L
J
COMMUNITY AREAS
where more young children M
have elevated blood lead levels
A Hermosa K West Englewood
N O P
B Austin L Englewood
C Humboldt Park M Greater Grand Crossing
D West Garfield Park N Auburn Gresham Q
E East Garfield Park O Avalon Park
F North Lawndale P South Chicago
G South Lawndale Q Burnside
R S
H New City R Roseland
I Fuller Park S Pullman
J Chicago Lawn
Chicago Department of Public Health, 2014
21ADDRESSING ROOT CAUSES
GOAL Improve Chicago’s built environment and transportation so that residents can live and age
1 well in healthy communities
Objectives
• Increase the percentage of
Strategies
• Continue implementation of Chicago’s
adults who walk, bike or take Pedestrian Plan and institutionalize Chicago’s
Complete Streets Policy and CDOT’s Pedestrian
82% 74%
public transportation to work
by 10% First modal hierarchy by prioritizing pedestrians
in the planning, design, operations and
• Increase percentage of maintenance of the built environment CHICAGO AMONG PEOPLE
LIVING IN POVERTY
people who feel safe in their • Continue to implement the Streets for Cycling
community Plan 2020, Chicago’s bikeway network plan, and
adopt an updated, policy-based, citywide bike People who feel safe
plan that includes equity, health and economic using parks, playgrounds & walking paths
development in their neighborhoods
• Foster partnerships between bike share and HCS, 2014
public health providers to identify local needs
and health inequities in support of equitable
planning and increased use of the Divvy program
• Improve the public transit system by
investing in CTA and Metra commuter railroad
modernization that ensures full accessibility for
riders of all ages and abilities
• Promote the Make Way for People program and
encourage art and programmed activities in
public spaces
• Continue the Large Lot Program to make city-owned
vacant land available to current property owners
• Examine ways to encourage and fund development
near transit that includes mixed land use
• Implement the Age Friendly Chicago plan, which
incorporates emerging Aging in Community
policies and guidelines
GOAL Realize Chicago’s Vision Zero initiative by eliminating all pedestrian, bicycle and motor vehicle
2 traffic crash fatalities in Chicago
118
Objective Strategies Traffic Crash Fatalities
• Reduce the number of serious • Form an inter-agency committee to foster new
injuries resulting from traffic partnerships and productive strategies around
crashes by 10% annually crash reduction
• Support the creation of a Vision Zero action plan
focused on inter-agency partnerships and national
best practices for enforcement, education,
infrastructure design and data analysis
in 2014
GOAL Minimize the negative effects of climate change
3 Strategies
• Coordinate with partner organizations to collect
data that can inform education, advocacy,
resource development and planning efforts related
to minimizing and responding to climate change
• Launch public education campaigns to address
the response to climate change
• Ensure emergency response plans address the
health impacts of climate change on vulnerable
populations and assure essential health services
for these populations in an emergency
• Expand efforts to support local, community-
specific systems and strategies to prevent and
respond to climate change
22ADDRESSING ROOT CAUSES
GOAL Improve the economic vibrancy, diversity and financial security of communities to reduce
4 economic inequity
Objectives Strategies
•
•
Reduce the unemployment rate
Increase the percentage of
• Provide additional opportunities for
communities to give input on major capital
projects and institutional expansions to ensure
In 2014, 8.4%
Chicagoans were unemployed
low income people who have the projects are responsive to community needs
savings and assets
• Support the Working Families Task Force’s
among African Americans,
recommendation that paid sick leave be provided
•
to employees
Expand affordable, accessible childcare services
14.7%
were unemployed
for workers at all hours needed
• Expand access to college, job training and trade
school
• Develop measures for jobs and a guide for
employers on how to affordably add value and
benefits for their workforce
• Support the creation of community-level
business incubators and cooperatives to
support small business development
• Expand the availability of counseling services
in personal finance, access to credit and
homeownership financing
• Expand the Illinois Earned Income Tax Credit
• Create 4,000 job opportunities for opportunity
youth, i.e., youth between the ages of 18 and 24
who are out of school or out of work
GOAL Create and maintain affordable, safe, healthy, accessible and supportive housing
5 Objectives
• Decrease the number of
households with high housing
Strategies
• Preserve affordable and supportive housing units In 2014, 1,197 children under 3 years of age
tested positive for
cost burden by 5%
• Create a structure to develop a more balanced
portfolio of housing that is safe, healthy,
accessible and affordable
LEAD POISONING
(>6mcg/dl)
• Increase permanent supportive
housing by 5% • Encourage use of managed care entities and
hospital community benefit funds to establish a
• Adopt model healthy homes fund to build and sustain permanent supportive
code by 2020 housing
• Reduce the percentage of lead- • Develop a comprehensive, proactive home 39% of Chicago households
inspection program spend more than 1/3 of their monthly income
poisoned young children living
in very low child opportunity on housing costs
• Explore ways to understand and address the
communities by 10% annually health implications of housing policies and
projects
23ADDRESSING ROOT CAUSES
EDUCATION
Early childhood education programs increase school Additionally, homelessness impacts school mobility
performance and high school graduation rates. They and attendance rates for students. During the 2014-2015
are associated with decreases in crime rates and teen school year, 20,250 CPS students were in a temporary
birth rates. When provided to low-income or racial and living situation. While CPS provides supports to ensure
ethnic minority communities, early childhood education students in such situations have transportation and other
programs are likely to reduce educational achievement resources to keep attending class, lack of stable housing
gaps, improve the health of these student populations significantly impacts the homeless students success.
and promote health equity.1
In 2014, 18.4% of Chicago adults did not have a high school
diploma; among Hispanics that rate is 40.5%.2 Inequities
are also seen geographically, as adults in community
areas on the West and South Sides are less likely to have a
college degree.
Quality of education can also vary across community
areas. Level 1+ schools, or the highest performing schools
in the Chicago Public Schools (CPS) system, represent 22%
of all CPS schools but their locations do not match those
“You can’t educate a child
who isn’t healthy, and you
areas with large populations of children. Most children
lack access to the highest performing CPS schools and
can’t keep a child healthy
”
must attend the 78% of CPS schools that are not the
highest performing schools.3
School environments can also decrease educational who isn’t educated.
opportunity. For example, many lesbian, gay, bisexual, —M. Jocelyn Elders, MD
transgender and queer (LGBTQ) youth report hostile school
environments, which may lead to increased dropout rates.
Nationally, 86% of LGB high school students experience
harassment at school on the basis of their actual or
perceived sexual orientation, with 61% of students feeling
unsafe because of their sexual orientation.4
24ADDRESSING ROOT CAUSES
Chicagoans who
have not graduated
High School
4.6 - 12.7 %
12.8 - 21.1 %
21.2 - 27.2 %
27.3 - 32.6 %
32.7 - 40.9 %
A
B Low & Very Low Child
Opportunity Areas
Chicago rate: 18.4%
COMMUNITY AREAS C
where one-third or more of adults
do not have a
high school diploma D E
A Dunning K McKinley Park
F
B Avondale L New City
C Austin M Chicago Lawn
D West Garfield Park N West Englewood
E East Garfield Park O Englewood
K
F North Lawndale P Auburn Gresham
G Garfield Ridge Q Riverdale
H Clearing R South Deering
I L
I Archer Heights S East Side
J West Elsdon
G
J
H
N O
M
P
S
R
Q
US Census, American Community Survey, 2010-2014 5-Year Estimate
25ADDRESSING ROOT CAUSES
GOAL Ensure all Chicago children participate in early childhood education
1 Objective
• Increase early childhood
Strategies
• Launch a single application and process for
all early childhood education programs and
Eligible 3 and 4 year olds enrolled in
EARLY CARE AND EDUCATION
enrollment for eligible three and
four year olds by 10% expand sites where applications are available
• Conduct awareness campaigns around the
73%
importance of early childcare and education,
from birth until age five
• Promote Ready to Learn via CTA and city digitals
in the five most under-enrolled communities
• Build partnerships with non-traditional
systems and organizations, such as faith-based
organizations, park districts and aldermanic 12,000 eligible children
offices, to build awareness and provide
information on early childhood education are not in early education
• Encourage health care providers to share early
childhood enrollment and programmatic
information with their patients and families
• Support outreach teams in communities
of focus as identified by the Mayor’s Office,
Department of Family and Support Services
(DFSS) and CPS
• Create messaging and materials to inform
grandparents raising grandchildren about early
childhood supportive services through providers
and local government resources
26ADDRESSING ROOT CAUSES
GOAL Ensure Education Equity
2 Objective Strategies Homeless
students miss
3X
• Increase school attendance • Implement restorative practice Tier II
among homeless and LGBTQ interventions that provide support to students
youth to the district-wide with chronic truancy and poor attendance
attendance rate of 93% • Deliver trauma-informed training to educators
more school
• Invest in strengthening community schools to days than
ensure they have high quality options for priority students
populations and ensure those students have
access to community school programmatic
with stable
opportunities such as International housing
Baccalaureate (IB); Science, Technology,
Engineering, and Math (STEM); Dual Credit and
Dual Enrollment
• Implement evidence-based, school-based
interventions that enhance positive peer
relationships, violence prevention and early
intervention in CPS schools, e.g., Becoming
a Man, Working on Womanhood and Match
Tutoring
• Create a more robust data collection
mechanism to inform practice for the LGBTQ
community
• Partner with CPS to increase training for
teachers, administrators and other school
personnel on diversity, inclusion and trauma
• Promote and support Gay Straight Alliances
(GSAs) at schools and other youth-serving
organizations
• Engage community organizations to raise
awareness of CPS school options through events
that focus on high hardship communities
• Utilize aldermanic offices, aldermanic staff and
community leaders to promote CPS school
options and assist with the enrollment process
GOAL Ensure youth are aware of and enroll in post-secondary opportunities
3 Objective
• Increase CPS student
enrollment in post-secondary
Strategies
• Promote Star Scholarship opportunity among
students who have an ACT score of at least 17
programs and GPA of 3.0
• Provide Star Scholarship outreach in
community areas that have high percentages of
undocumented CPS students
• Create a cohort of students who have a GPA
below 2.0 and a score of 18 or higher on the ACT
to assist them with accessing model programs
for such students who aspire to attend college
• Promote post-secondary opportunities,
including college, university and vocational
programs, and coordinate learning and job
skills with City Colleges of Chicago certification
programs
27CHAPTER 3
INCREASING ACCESS TO HEALTH
CARE & HUMAN SERVICES
Access to health care and human services improves both individual and community health. This
includes prevention and treatment services for physical, behavioral and oral health as well as support
services, such as transportation, food assistance, childcare and assistance enrolling in and using health
insurance. Health departments and other members of the public health system link people to needed
personal health services and assure provision of health care and a competent workforce and evaluate
the effectiveness, accessibility and quality of these services.
29INCREASING ACCESS
Being insured is a major component of access to care. In addition to health insurance status, many other factors
Adults who lack health insurance have less access to influence a person’s access to and use of health care
clinical care and preventive services.1 Health insurance is services. Healthy Chicago 2.0 addresses the following
essential for the half of all adults who have at least one interrelated components: availability, affordability,
chronic disease and need ongoing care to manage and appropriateness, effectiveness, equitability and consumer
control their conditions.2 With health insurance, children involvement and use of the health system. Human
are much more likely to have medical homes and obtain services are an integral component of this system,
well-child and developmental services to prevent health as they provide assistance with daily needs such as
problems; insured children are more likely to have fewer housing, food, transportation, jobs and dependent care. A
unmet health needs.3 Given the rise of children at risk culturally-effective approach integrates knowledge about
for chronic health problems (e.g., obesity, diabetes and populations into specific standards, policies and practices
asthma), health insurance coverage improves their ability to improve the quality of care, thereby producing better
to obtain care to address these problems early. health outcomes.
Many public health system agencies are involved in
helping individuals and families enroll in Marketplace and
“People
Medicaid health plans. Even more organizations monitor
have a choice of
the implementation of the Affordable Care Act and Illinois
Medicaid health reform and advocate for comprehensive
benefits. These services expand the number of residents
with insurance improving health outcomes across the city.
health plans, but care
varies and there is a lot of
confusion about the plans. ”
—Community Conversation Participant
30INCREASING ACCESS
CURRENT STATE
Since the implementation of the Affordable Care Act and Medicaid ex- (21.5%) or a bachelor’s degree (9.5%).6 The more education you have,
pansion in 2014, more people have access to health insurance. Over the more likely you are to have health insurance and access to quality
75,000 Chicagoans enrolled in Marketplace health plans for 2015 and health care.
over 206,000 are enrolled in Medicaid expansion plans for adults (19-64
Other factors influence access but are more difficult to measure. One of
years of age).4,5
these factors is the quality of health care services. Although health and
Data show variations in 2014 Chicago health insurance coverage rates human service providers recognize the importance of high quality care
based on demographic characteristics.6 Some of the largest inequities and regularly adjust their systems to improve it, few data indicators are
occur by race/ethnicity; whites have the lowest uninsured rates (10.4%) available to measure the following areas: culturally-effective care, the
compared to African Americans (18.6 %), Asians (19%) and Hispanics provision of evidence-based treatments and interventions, and consum-
(28.1 %).6 Individuals living below 138% of the federal poverty level ers’ ability to navigate the health and human service system.
(FPL) have the highest uninsured rate at 27.1%, compared to individ-
To address these concerns, Healthy Chicago 2.0 calls for adding specific
People with no
uals earning between 138% and 199% FPL (26.8%) and those living at health insurance
quality and access questions to the annual Healthy Chicago Survey to
or above 200% FPL (12.3%).6 Education levels show similar patterns to
document some of these measures. As these3.9 - 14.0%
data become avail-
health insurance coverage. Individuals without a high
able, the action team will identify populations
14.1 - 18.4% in
school diploma have the highest rate of be-
need and implement evidence-based/
ing uninsured (35.4%), compared to 18.5 - 22.3%
informed strategies to reduce in-
high school graduates (29.2%),
equities.22.4 - 34.8%
those with some college
B Community Areas
A
with High Economic
Hardship
C
People with no
D
health insurance
E 3.9 - 14.0%
F
G 14.1 - 18.4%
18.5 - 22.3%
H 22.4 - 34.8%
18.7%
Community Areas
with High Economic
Hardship
of Chicagoans have
J
I O
NO HEALTH INSURANCE
N
M
L
K P
COMMUNITY AREAS Q
most impacted S
AWest Ridge K Archer Heights
R
B Rogers Park L Brighton Park
18.7%
C Albany Park M McKinley Park
D Irving Park N Bridgeport
E Avondale O Armour Square
of Chicagoans haveP New City
F Belmont Cragin
G Hermosa Q Gage Park
NO HEALTH INSURANCE
H Humboldt Park R Chicago Lawn
I South Lawndale S West Englewood
J Lower West Side
COMMUNITY AREAS
most impacted US Census, American Community Survey, 2010-2014 5-Year Estimate
A West Ridge K Archer Heights
31
B Rogers Park L Brighton Park
CINCREASING ACCESS
COMPONENTS OF ACCESS
Availability of Services
Proximity, hours, correct array of services, appropriate capacity
Affordability of Services
Insurance, payment, coverage, charity care
Appropriate, Effective and Equitable Services
Socially, culturally and linguistically effective; evidence-based or informed; performed to consumer satisfaction
Partnerships Between Providers and Community
Timeliness of services, health homes, prevention and supportive services
GOAL Increase capacity and availability of health and human services and maximize impact of
1 existing resources
Objectives Strategies
• Increase percentage of Hispanic • Establish a comprehensive health and human
adults who have a regular services resource system
•
doctor by 10%
Decrease percentage of
• Analyze geographic access to health and human
services and address gaps in care
28%
Hispanic adults without health • Expand provider capacity by promoting access
insurance by 20% to community-level data to support successful
of HISPANICS
service expansion grants
• Advocate for sustainability of school-based
health centers
are without health insurance
• Facilitate the use of waivers to allow individuals
convicted of certain felonies to work in the
health care and human service professions;
expand the list of jobs for which waivers can be
requested
• Advocate that the State of Illinois develop State
Workforce Scope of Practice Acts that allow
1 in 3 Hispanic adults does not have a
health care providers to work at the top of their PRIMARY CARE PROVIDER
professional scope of practice and training
• Ensure that high hardship communities have
certified application counselors located in their
area to assist with Marketplace and Medicaid
enrollment
• Develop an outreach and enrollment
sustainability plan to ensure ongoing
engagement and education on health insurance
enrollment and use, including for individuals
access to behavioral health care
• Join efforts to create affordable health insurance
options for people who are not eligible for
government or Marketplace plans
32INCREASING ACCESS
GOAL Improve quality of health and human services
2 Objective
• Increase client satisfaction with
health care
Strategies
• Facilitate Chicago Federally Qualified Health
Centers (FQHC) in obtaining Primary Care
People who report their health as
good, very good or excellent
Medical Home recognition NATIONAL
CHICAGO
• Facilitate the inclusion of human service
CHICAGO HIGH POVERTY AREAS
agencies in hospital Community Health Needs
Assessment processes and in health care 90%
provider quality improvement efforts
82%
• Encourage and support providers in high
hardship communities to improve their quality 66%
of care, based on national performance
measurements
• Foster under-represented populations’ entrance
into the health and human services workforce
through partnerships with pipeline and college
readiness programs, and provide support for
these populations to succeed in studies and
work environments
• Ensure health care providers follow best
practices when referring clients for specialty
care and care coordination
• Promote the use of the U.S. Department of
Health and Human Services' Guide to Providing
Effective Communication and Language
Assistance Services to improve cultural
competency within organizations and with their
clients
GOAL Increase consumers’ effective and efficient use of the health system, including services and
3 supports
Objectives Strategies
• Increase the percentage of • Provide affordable health promotion programs,
adults who receive health care e.g., exercise classes, wellness programs and
they need from their health disease management education
insurance • Advocate for Marketplace plans and Medicaid
Managed Care Plans to conduct ongoing,
77%
• Increase percentage of adults in-person education with their plan holders to
who have had a routine of Chicagoans have
communicate the importance of prevention and visited a doctor for
checkup in the past year by 5% regular care a routine checkup
within the past year
• Increase the percentage of • Strengthen the community health worker and
adults who have routine annual health navigator workforce to enroll people in
dental cleanings Medicaid and Marketplace health plans and
ensure people understand how to use insurance
• Decrease the rate of dental and access health care and human services
emergency room visits among
people living in high economic • Facilitate connection between child care centers
and oral health providers to improve oral health
hardship by 5%
in children
• Ensure children with tooth decay have follow-up Chicagoans living in high economic hardship
treatment have 40% MORE DENTAL-RELATED
• Foster collaboration between hospitals and emergency room visits than the city average
FQHCs that provide adult dental care
• Advocate for adult dental coverage for Medicaid
clients
33You can also read