2018 BIODIVERSITY REPORT - City of Los Angeles Measurement of the Singapore Index of Cities' Biodiversity and Recommendations for a Customized Los ...
←
→
Page content transcription
If your browser does not render page correctly, please read the page content below
2018 BIODIVERSITY REPORT
City of Los Angeles
Measurement of the Singapore Index of Cities' Biodiversity
and Recommendations for a Customized Los Angeles Index

Prepared by:

Isaac Brown Ecology Studio and
LA Sanitation & Environment
LA Sanitation and Environment

          1149 South Broadway, 9th Floor
              Los Angeles CA 90015
Enrique C. Zaldivar, Director and General Manager
Traci J. Minamide, Chief Operating Officer
Lisa B. Mowery, Chief Financial Officer
Mas Dojiri, Assistant General Manager
Adel H. Hagekhalil, Assistant General Manager
Alexander E. Helou, Assistant General Manager

      Board of Public Works Commission
        200 North Spring Street, 3rd Floor
             Los Angeles, CA 90012
Kevin James, President
Heather M. Repenning, Vice President
Michael R. Davis, President Pro Tempore
Aura Garcia, Commissioner
Joel Jacinto, Commissioner

                        Mayor
Eric Garcetti

                      City Council
Council District 1       Gilbert Cedillo
Council District 2       Paul Krekorian
Council District 3       Bob Blumenfield
Council District 4       David E. Ryu
Council District 5       Paul Koretz
Council District 6       Nury Martinez
Council District 7       Monica Rodriguez
Council District 8       Marqueece Harris-Dawson
Council District 9       Curren D. Price, Jr.
Council District 10      Herb J. Wesson, Jr.
Council District 11      Mike Bonin
Council District 12      Mitchell Englander
Council District 13      Mitch O’Farrell
Council District 14      Jose Huizar
Council District 15      Joe Buscaino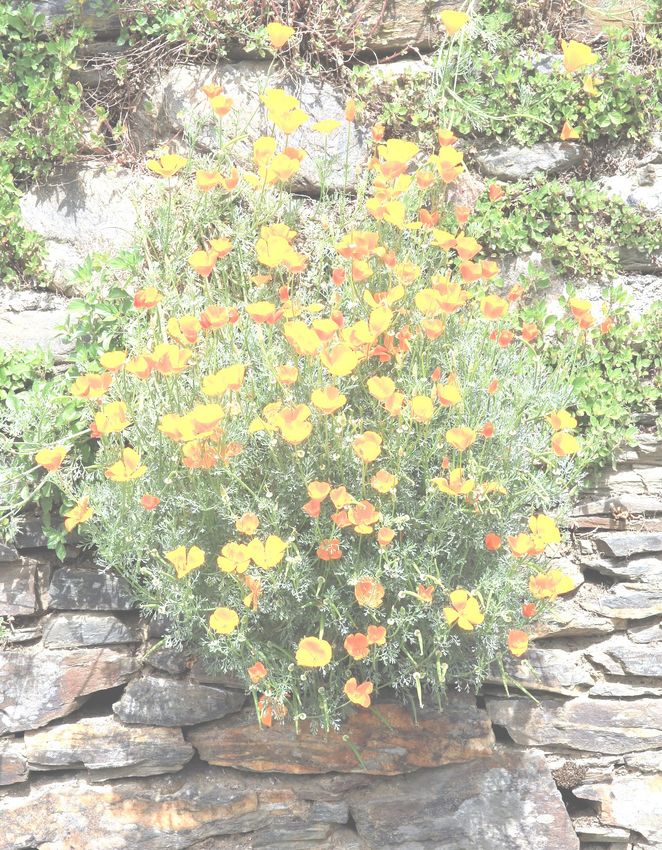
Preface
The City of Los Angeles lies within the California Floristic Province, which is globally recognized as a hotspot of
native biodiversity across many groups of organisms. What this designation also means is that the biodiversity
is threatened, and innovative strategies are needed to ensure its resilience. The survival and well-being of the
City’s residents also depend on ecosystem services provided by biodiversity, including air pollution reduction,
strongly and rapidly mitigating and adapting to climate change, mental health and educational opportunities,
water cleansing, and aesthetic benefits. These services are built directly from an integrated ecosystem of nat-
ural biodiversity and sustainable urban landscapes.
In line with the Mayor’s goal of a “no net loss” biodiversity strategy identified in the City’s 2015 Sustainability
pLAn, Councilmember Paul Koretz of the 5th Council District introduced the Los Angeles Biodiversity Motion.
On May 10, 2017, the Los Angeles City Council adopted the amended motion (Motion 25A, Council File No.
15-0499 ) unanimously, and directed the Bureau of Sanitation (LASAN) to oversee efforts to evaluate biodiver-
sity in the City and develop an index to measure no net loss going forward. The original Motion was the cul-
mination of more than a year of groundwork with a public Biodiversity Stakeholder group led by Andy Shrader
of the 5th Council District, Tony Tucci (Citizens for Los Angeles Wildlife), and Dr. Travis Longcore (USC). On
recommendation of Dr. Longcore, and with the support of the Stakeholder Group, LASAN chose to measure
the Singapore Index on Cities’ Biodiversity as the first step in implementing the Motion. Los Angeles is the first
City in the U.S. to perform this measurement, joining Helsinki, Montreal, Lisbon, and other global cities. LA-
SAN enthusiastically embarked on this journey and brought together interested individuals to form an Expert
Council and an Interdepartmental Biodiversity Team. The collective knowledge and data resources from these
esteemed individuals were tapped to measure the Singapore Index and provide the recommendations present-
ed throughout this document.
The exceptional level of passion among stakeholders, the esteemed Expert Council, and Interdepartmental
Biodiversity Team became apparent early in the outreach process. The breadth and complexity of the topic,
and long struggle of many stakeholders to advance biodiversity in the City, was also clear. What those early
meetings and work since continue to reveal is that biodiversity in Los Angeles is globally significant, is a source
of great pride for Angelenos fortunate enough to have access to and awareness of it, and is central to the sus-
tainability and resilience of the City. Virtually every City Department has a role in protecting, enhancing, and
benefiting from biodiversity, and LASAN is thrilled to continue advancing this important topic for the benefit of
the public and the nature we jointly steward.
LASAN Biodiversity Team
Mas Dojiri
Doug Walters
Melinda Bartlett
Isaac Brown
Peggy Nguyen
Deborah Deets
Michelle Barton
Hubertus Cox
Andy Shrader, 5th Council District
Mayor’s Sustainability Office
Liz Crosson
Kathryn Mika

Acknowledgments
This report was prepared by Isaac Brown Ecology Studio and the Los Angeles Bureau of Sanitation (LASAN)
Biodiversity Team. LASAN team members Peggy Nguyen and Michelle Barton led the documentation process
under the direction of Dr. Mas Dojiri, Assistant General Manager of LASAN. LASAN team members Doug
Walters (LASAN Chief Sustainability Officer), Melinda Bartlett, Deborah Deets, and Hubertus Cox were integral
in shaping this document and process. Additional document contributors include: Oscar Figueroa (City of LA),
Elizabeth Reid-Wainscoat (Mayor’s Office), Dr. Ryan Harrigan (UCLA), Dr. Brad Schaffer (UCLA), Dr. Jing Liu,
Natalie Farnham, and class (Santa Monica College), Wendy Katagi (Stillwater Sciences), Karin Wisenbaker
(Aquatic Bioassay & Consulting Laboratories), Dan Cooper (UCLA/Cooper Ecological), and Dr. Travis Long-
core (USC).
We would also like to thank iNaturalist, and its network of users, who generously made their data and imagery
available for public use.
Expert Council Members
The following Expert Council members provided guidance on this effort: Arlene Hopkins (Arlene Hopkins &
Associates), Bill Neill (California Native Plant Society), Brad Rumble (LAUSD), Dr. Brad Shaffer (UCLA), Dr.
Bruce Orr (Stillwater Sciences), Dr. Casandra Rauser (UCLA), Daniel Cooper (UCLA/Cooper Ecological), Dr.
Eric Strauss (LMU), Dr. Eric Wood (CSULA), Ileene Anderson (Center for Biological Diversity), Jessica Arriens
(UCLA), Dr. John Fleming (Center for Biological Diversity), Johnathan Perisho (The River Project), Kai Craig
(California EcoDesign), Kat Superfisky (Mia Lehrer Associates/Grown in LA), Dr. Katherine Pease (Heal the
Bay), Dr. Katy Delaney (National Park Service), Leon Boroditsky (City of LA), Lila Higgins (LA County Natural
History Museum), Paolo Perrone (Trust for Public Lands), Dr. Ryan Harrigan (UCLA), Dr. Seth Riley (National
Park Service), Dr. Sophie Parker (The Nature Conservancy), Tony Tucci (CLAW), Dr. Travis Longcore (USC),
Wendy Katagi (Stillwater Sciences), Dr. Yareli Sanchez (Council for Watershed Health), Dr. Karen Martin (Pep-
perdine University).
City of Los Angeles Interdepartmental Biodiversity Team
The following City staff also provided guidance on this effort: Liz Crosson (Mayor’s Sustainability Office), Andy
Shrader (CD5), Aaron Gross (LADWP), Oscar Figueroa (City of LA), Chris Pina (Planning), Claire Bowin
(Planning), Diana Kitching (Planning), Michelle Levy (Planning), Beth Schaefer (LA Zoo and Botanical Gar-
dens), Catherine Cox (LA Zoo and Botanical Gardens), Darryl Pon (LA Zoo and Botanical Gardens), Jane
Adrian (BOE), Emily Moos (CD5), Julia Epstein (CD5), Lauren Faber (Mayor’s Sustainability Office), Richard
Fisher (BOE), Sabrina Bornstein (Mayor’s Office), Scott Cher (Mayor’s Office), Shana Bonstin (Planning), Tami
McCrossen-Orr (LAWA), Carolyn Lin (LAWA), Charles Holloway (LADWP), Chris Cannon (POLA), Christo-
pher Adams (BOE), Daniel Hackney (LASAN), Debbie House (LADWP), Greg Spotts (BOSS), Kathie Hirata
(LADWP), Marissa Aho (Mayor’s Office), Mahmood Karimzadeh (BOE), Matthew Rudnick (RAP), Nancy Sutley
(LADWP), Paul Davis (RAP), Rachel McPherson (POLA), Rafael Prieto (CLA), Timothy Tyson (Bureau of
Street Services Urban Forestry Division), Tom Gibson (RAP), William Jones (BOE).
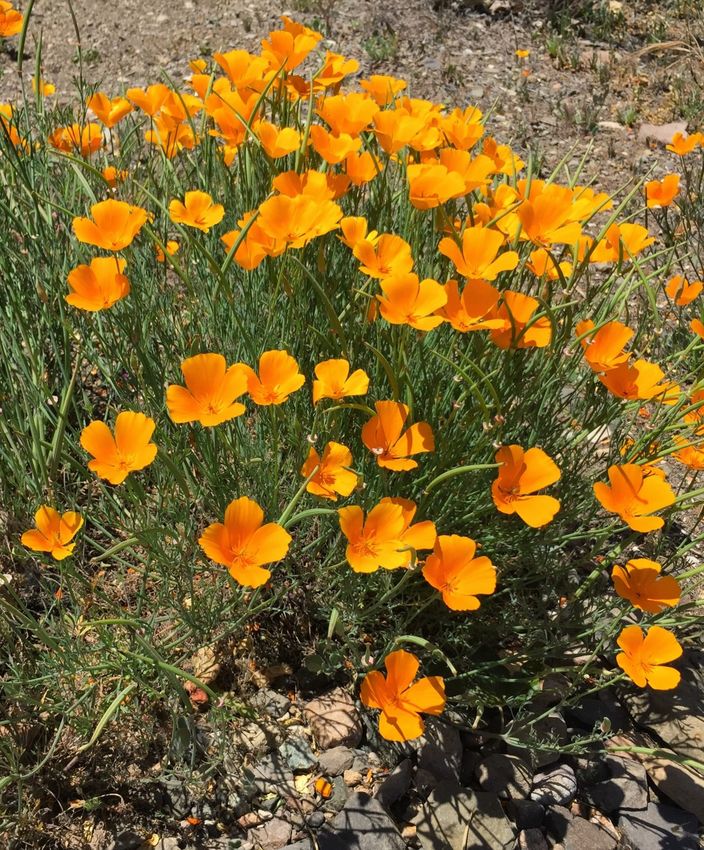
Table of Contents
01 02 03 04
Executive Summary Profile of the City Native Ecosystem Services
Biodiversity Indicators
Indicators
08 12 24 48
Summary Introduction #1: Natural Areas #11: Pervious
Surfaces
09 14 26
Singapore Index Location and Climate #2: Connectivity 50
Score Summary #12: Tree Canopy
28
14
#3: Birds in Built
Physical Features of 52
Areas
the City #13: Access to
30 Natural Areas
16 #4: Plants
Demographics and 54
Economic Parameters 34 #14: Educational
#5: Birds Visits to Natural Areas
16
Drivers and 36
Pressures on #6: Butterflies / Moths
Biodiversity
38
18 #7: Freshwater Fish /
Biodiversity Features Benthic
Macroinvertebrates
21
Administration of 40
Biodiversity #8: Reptiles /
Amphibians
42
#9: Protected Natural
Areas
44
#10: Invasive Species
05 06 07 Appendix A
Governance and Synthesis: References A1: Los Angeles
Management of Recommendations Ecological Subsec-
Biodiversity for the LA Index & City tions Description
Indicators Biodiversity Practices
A2: Los Angeles
58 70 82 Sensitive Species List
#15: Biodiversity A. General References
Budget Recommendations A3: Los Angeles
85 Vegetation Alliances
59 72 List of Abbreviations Descriptions
#16: Biodiversity B. Native Biodiversity
Projects A4: Profile of the City
73 Supplement / Links to
60
C. Access, Biodiversity
#17: Biodiversity
Policies Perception, Behavior Resources
62 74 A5: LA Sunset
#18: Biodiversity D. Ecosystem Climate Zones
Functions Services Description
63 74
#19: Interagency E. Pollution/Hazards
Cooperation
75
64 F. Education, Appendix B
#20: Public Awareness, Advocacy
Consultation
76 B1: Indicator
65 G. Governance and Measurement
#21: Biodiversity Management Technical Methods
Partnerships
79
66 Next Steps
#22: School Curricula
67
#23: Public Outreach
01   Executive Summary

                   photo: Isaac Brown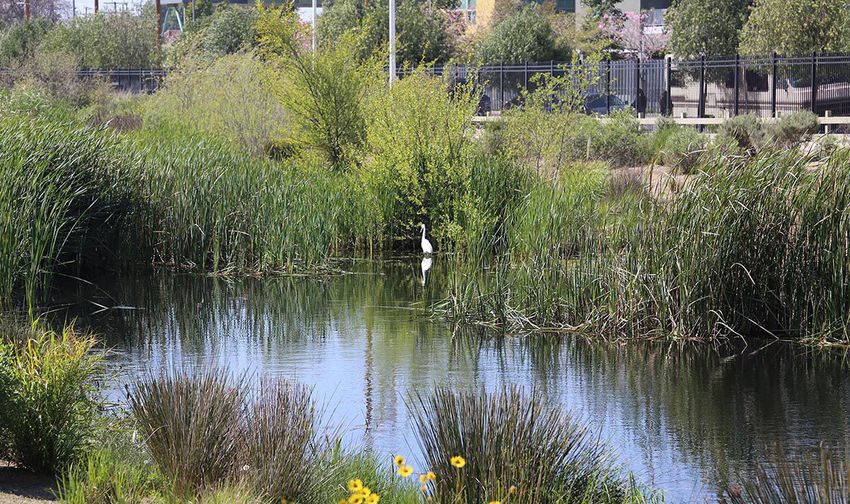
01 Executive Summary Biodiversity in Los Angeles is truly unique. On one hand, LA includes the highest population density of all major U.S. cities according to the 2010 U.S. Census, and is known to be one of the most “park poor” cities in the country1, 2. On the other hand, LA falls within a “Global Biodiversity Hotspot” and the City includes an exemplary range of biodiversity and large natural areas. This study documents approximately 1,200 different native species recorded within the City, and perhaps more than double that are present, but unrecorded. This richness is driven by diverse ecosystems and microclimates spanning 5,000 feet in elevation from the coast to mountains, and over 61,000 acres of natural areas comprising more than 20% of the City footprint. The terri- tory is home to mountain lions, the occasional steelhead trout, uniquely diverse herbaceous and shrub plant communities, picturesque oak savannas, and over 150 threatened and endangered species and ecosystems. In urban areas, biodiversity can be thought of as the variety of flora, fauna, and ecosystems that help maintain the balance of nature and sustain cities. Urban natural areas provide habitat connectivity and support conser- vation of numerous sensitive species. Urban biodiversity includes both native and non-native species, includ- ing LA’s urban forest, which provide many ecosystem services that enhance the City’s resilience to climate change. Native and non-native urban landscapes contribute to improved mental and physical health, and can be the primary means by which urban dwellers connect with nature. Even in the densest areas of the City, this initial analysis reveals unusually high levels of native biodiversity and opportunities for enhancing the urban ecosystem. This report provides a summary of LA’s biodiversity based on a set of indicators that make up the “Singapore Index of Cities’ Biodiversity” (Singapore Index or SI). The Singapore Index is being applied in at least 40 cities worldwide and this is the first measurement that we know of in the U.S.; Los Angeles received a preliminary score of 48 out of 72 possible points (see Table 1). This score is “preliminary” because five of the indicators (indicators 4-8) measure change in the number of recorded species over time. Therefore, the score for these indicators is determined during a second measurement of the SI using the preliminary measurement as the baseline. The indicator measurement process for LA has helped put our high biodiversity relative to other cities into context. LA receives the highest scores possible for a number of indicators including the percentage of natural areas, number of native bird species in the City, and protection of sensitive species and ecosystems. However, other indicators reveal opportunities for improvement, such as our relatively low urban tree canopy and limited formal education programs addressing local biodiversity. Current City biodiversity management practices mostly fall within the somewhat narrow focus of the California Environmental Quality Act-mandated (CEQA) conservation framework to protect sensitive species on a project-by-project basis, rather than a com- prehensive approach aimed at enhancing overall biodiversity. Other indicators also do not do a good job at accounting for unique contextual factors, such as the City’s large footprint, very large, but concentrated natu- ral areas, and unique governance structures. For example, the City receives the highest score for “access to nature”, yet a large segment of the population has relatively limited access to natural areas in proximity to their residence. Therefore, we see the Singapore Index as the first step in developing a customized index for LA to support a comprehensive management strategy for biodiversity per the requirements of the City’s Biodiversity Motion. This measurement of the Singapore Index is part of Los Angeles Bureau of Sanitation’s (LASAN) response to the City’s Biodiversity Motion, passed on May 10, 2017. The Motion includes three main objectives: 1) develop an index to measure protection, enhancement, and mitigation of impacts to biodiversity; 2) develop policies and projects to enhance biodiversity, including improving access for communities that lack access and contrib- uting toward broader ecosystem functions and sustainability; and 3) develop options for community outreach and engagement. Under direction from City Council, and the guidance of the City of LA Biodiversity Interde- partmental Team, Biodiversity Stakeholder Group, and Expert Council, the measurement of the SI was per- formed as a first step in implementing the Motion. This report includes recommendations for a customized Los Angeles Index, and general recommendations for addressing the requirements of the Motion (see Section 6). | 01 Executive Summary
Table 1: Singapore Index of Cities’ Biodiversity score summary for Los Angeles
Index Score
Indicator Numeric Result Total
0 1 2 3 4
1. Natural Areas 20.5% of City (~62,000 acres) 4 4
2. Connectivity Measures 738 ha. effective mesh 2 2
3. Native Birds in Built Areas 292 native species recorded 4 4
4. Native Vascular Plants Change 449 native species recorded Baseline in year 1
5. Native Birds Change 325 native species recorded Baseline in year 1
6. Native Butterflies/Moths Change 215 total species* recorded Baseline in year 1
7. Native Freshwater Fish /
Benthic Macroinvertebrates Change
6 fish/291 BMI native spp. recorded Baseline in year 1
8. Native Reptiles/Amphibians Chg. 39 total species recorded Baseline in year 1
9. Protected Natural Areas 12.2% of City (~36,800 acres) 3 3
10. Invasive Species ~20% invasive plant species 2 2
11. Pervious Surfaces ~62% pervious surfaces 2 2
12. Urban Forest Canopy ~19% tree canopy 1 1
13. Access to Natural Areas 3.33 ha/1000 population 4 4
14. Natural Area Educational Visits 0.09 visits/student/year 0 0
15. Biodiversity Budget 1.2% of budget ($110M) 1 1
16. # Biodiversity Projects 117 projects/programs 4 4
17. Biodiversity Strategy/Action Plan no Biodiversity Action Plan 0 0
18. # Biodiversity Related Institutions >3 functions 4 4
19. Interagency Cooperation 5 agencies cooperate on bio. 3 3
20. Public Consultation Process proposed as routine process 2 2
21. # City Biodiversity Partnerships 40+ partners 4 4
22. School Curricula included 4 4
23. Public Outreach Events 660+ events per year 4 4
Total (72 potential points in year 1) average = 2.67 48
* native vs. non-native species of butterflies/moths to be determined
02     Profile of the City
       Los Angeles

                                                                                                   photo: Phil Needy
 https://www.ucdavis.edu/sites/default/files/news/general-news/2017/may/phil_reedy_spawning_rainbowcaltrout2015-4.jpg
02 Profile of the City Introduction On May 10, 2017, the Los Angeles City Council passed the Biodiversity Motion (Motion 25A), which directed the Bureau of Sanitation (LASAN) to oversee efforts to calculate the Singapore Index for the City of Los Angeles and develop a unique biodiversity index customized for the City of Los Angeles. More specifically, LASAN was tasked with developing an index that quantifies biodiversity and identifies strategies to enhance and protect biodiversity and associated ecosystem services, to develop policies and projects that enhance biodiversity, particularly in ar- eas that lack access to open space, and to engage the larger Los Angeles community in its efforts.The following report contains information regarding the calculation of the Singapore Index, an existing framework developed by international experts in urban biodiversity to quantify existing biodiversity and the resources allocated to protect it within a city, for the City of Los Angeles (LA). The Singapore Index has been measured, or is in the process of being measured, for approximately 40 cities, counties, or metro regions worldwide. To our knowledge, this is the first complete measurement of the Singapore Index by a U.S. city. It was determined that measuring the Singapore Index would be a useful first step in developing a customized Los Angeles Index by: 1) helping stakeholders and local experts begin a dialog around indicators for City biodiver- sity; 2) providing an initial measurement based on an established index that can be used to summarize LA biodi- versity early in the process and which can be used as a point of comparison between LA and other cities; and 3) determining appropriate indicators and identifying key management issues unique to LA that can be incorporated into a customized index for the City, biodiversity strategy, and action plan. In order to measure the Singapore Index for the City of Los Angeles, and develop recommendations for a cus- tomized Los Angeles Index and biodiversity practices, LASAN’s Internal Biodiversity Team received input from City staff and local experts via three main partnerships: 1) an Interdepartmental Team composed of representa- tives from various City Departments that perform work related to biodiversity, 2) a Stakeholder Group composed of individuals from City Departments, non-governmental non-profit organizations (NGOs), regulatory agencies, academics, and subject matter experts, and 3) an Expert Council composed of experts on various aspects of biodiversity who volunteered to lend their expertise and data to the endeavor. The Interdepartmental Team met on July 18, 2017 and October 12, 2017. We met with the Stakeholder Group to solicit input from them early in the process on July 20, 2017. An Expert Council workshop, to gather the data and input needed to calculate the Singapore Index for Los Angeles, was held on August 30 and 31, 2017. The final section of this report, titled “Recommendations for the Customized Los Angeles Biodiversity Index and City Biodiversity Practices”, contains valuable information on each of the 23 indicators of the Singapore Index, as well as general suggestions that the City can employ as it continues work on this Biodiversity Project. The information presented is a valuable resource from which an effective biodiversity strategy, action plan, and index, unique to the City, can be developed that appropriately values biodiversity and helps to create equitable access to natural places while protecting and conserving biodiversity, maximizing the ecosystem services associated with biodiversity, and making the City of Los Angeles a better place to live. According to recommendations made by stakeholders and experts involved in this preliminary Singapore Index measurement, continuing biodiversity efforts will need to focus on improvement in the following areas: species conservation, public access to biodiversity, invasive species control, habitat quality, habitat connectivity, envi- ronmental stewardship, and climate change resilience (e.g., genetic diversity and habitat connectivity, including distribution and climate-driven migration of habitat and species across the City and protection of corridors). Location and Climate Los Angeles is located along the coast of the Pacific Ocean in the Northern hemisphere, with City Hall positioned at 34.0522 N Latitude, 118.2437 W Longitude3. According to the US Forest Service’s ecological mapping hierar- chy of the United States, Los Angeles (LA or City) falls in the Humid Temperate Domain, Mediterranean Division4. LA has exceptionally diverse microclimates and topography, with strong coastal influence in areas within a few | 02 Profile of the City
San Fernando Valley
Griffith Park
Downtown
Los Angeles
LAX
Santa Monica Bay
Pacific Ocean
Port of Los Angeles
Figure 1a: Ecological Sections
San Pedro Bay
Figure 1: US Forest Service Ecological Sections and Subsections of Los Angeles4
These major ecological features are useful in large-scale ecological planning and management frameworks (see Appendix A1).
miles of the Pacific Ocean, to more climate variability and continental influence in the San Fernando Valley/San Gabriel Mountains5. It is not uncommon for temperature differences across the City to exceed 30 °F from coast to mountains. Rainfall occurs predominantly in winter, except for occasional summer monsoons that are more frequent in montane and adjacent valley areas. Annual rainfall ranges from about 15 inches downtown to over 30 inches at 7,000’ elevation in the upper Los Angeles River watershed just outside of the City borders3,6,7. Eleva- tions within the City range from sea level to over 5,000’ at Mt. Lukens, which receives measurable snow in most winters. While droughts are common, intensive rainfall periodically occurs during so-called “atmospheric river” events, which can produce some of the heaviest and most concentrated rain in the country. Orographic enhance- ment of precipitation due to the dramatic elevation change is also an important feature shaping biodiversity and the character of local watersheds. This effect can result in more than double the rainfall rates between coast and mountains. Los Angeles also exhibits an urban heat island effect. In LA, this has been referred to as an urban heat “archipelago” since heat is produced throughout the City, especially within extensive areas of impermeable surfaces; but, the effect is most pronounced in inland areas where heat is generally transported, especially adja- cent to the San Gabriel Mountains (see CalEPA’s recent Urban Heat Island Index Report for more information8). Physical Features of the City LA covers approximately 469 square miles, or 301,000 acres (121,000 hectares). The City contains four ecolog- ical “subsections” according to the US Forest Service’s (USFS) national ecological typology system (Figure 1). Subsections are defined by similar climate, landform, and vegetation characteristics. In LA, subsections range from the flat alluvial plains and coastal terraces of the Los Angeles Plain that are naturally dominated by scrub, savanna, and riparian woodland vegetation types, to chaparral and coniferous forests on very steep rocky slopes in montane areas of the Santa Monica Mountains and San Gabriel Mountains (see Appendix A1 for more informa- tion). Along with microclimates, the variety and extent of these major physical features, along with the predom- inantly north-south oriented aspect of the San Gabriel and Santa Monica Mountains, are the foundation for the high natural biodiversity in the City. It also is notable that the City and surrounding metropolitan region completely bisect the Southern California Coast Section, which may have implications for climate change adaptation and species migration (see Figure 1a). Many regionally endemic species ranges are exclusively contained within this narrow coastal Section, and therefore, any shifts in species range north or south due to climate change may be impacted by the ability of species to migrate through the City over time9. Most flat areas in the City have been built upon and development has spread to the foothills, including very steep slopes10. The periodically dry climate, combined with steep terrain and fire-adapted native vegetation, results in an extreme fire regime that frequently causes catastrophic damage to communities near the urban- wildland interface. Frequent landslides and mud and debris flows, which are often triggered by rain events in the seasons following wildfires, are also a major impact in interface areas. Extreme runoff rates caused by orographically enhanced rainfall, erosive soils, and the very steep slopes of some of the fastest-rising mountains in the world have driven radical engineering of lower watersheds to mitigate urban flooding, sediment transport, and landslide hazards. Consequently, most urban streams now flow in concrete-lined channels protected by massive debris catch-basins in the foothills that are increasingly challenging to maintain11,12. Riparian flooding may be isolated, as most of the City falls outside of the FEMA-designated 100-year flood zone. However, large areas of the City and surrounding metropolis occur within the designated 500-year flood zone, and climate change may alter future flood regimes potentially leading to more frequent strong storms impacting these areas. The City also includes estuaries and low-elevation coastal areas susceptible to sea-level rise. Intensive urbanization has led to low soil permeability across the plain and reduced water tables. Extensive areas of soil and groundwater contamination, including many brownfield sites, are also present within City limits (see Appendix A4 for EPA Superfund Database and brownfields)13. Demographics & Economic Parameters In July 2016, the estimated population of the City of Los Angeles was 3,976,322, with a population density of 8092.3 people per square mile (13.2 per acre)14. The Los Angeles metropolitan region had a population of 17.8 million. The gross domestic product (GDP) for the Los Angeles-Long Beach-Anaheim, CA metropolitan area was just over one trillion dollars, the second highest GDP in the country. Per capita income in the City of Los Angeles was $28,761 per year15,16. Major economic drivers in the City include the Port of Los Angeles, which captures about 40% of containerized goods entering the U.S. and the entertainment industry. LA County also has the largest manufacturing center in the country (see Appendix A4 for additional demographic and economic informa- tion)14,17. | 02 Profile of the City
Figure 2: Sensitive Species of Los Angeles (See Appendix A1)
TL: Palos Verdes blue butterfly; © Travis Longcore; https://www.inaturalist.org/taxa/236268-Glaucopsyche-lygdamus-palosverdesensis
TR: Engelmann oak; Los Angeles photo by Rodger: http://www.laspilitas.com/images/grid24_24/12803/images/native-plants/quercus-engelmannii.jpg
BL: Southern California steelhead (photo of northern variety); Phil Needy; https://www.ucdavis.edu/sites/default/files/news/general-news/2017/may/phil_reedy_spawning_rainbowcaltrout2015-4.jpg
BRT: Western snowy plover; © Mike Baird; http://www.flickr.com/photos/mikebaird/324187595/
BRB: Two-striped garter snake; © Bill Bouton. https://www.inaturalist.org/taxa/28396-Thamnophis-hammondii
Drivers & Pressures on Biodiversity
Dense development, imperviousness, and high
population growth are key pressures on biodi-
versity. Over the years, development along the
Southern California Coast has been intense,
reducing habitat and negatively impacting native
species. Further, as many species in the region
are endemic, and rely on unique habitats that are
only located regionally, habitat loss has dimin-
ished many native populations, and in certain
cases led to extirpation. Over 150 sensitive
species and plant communities associated with
the City have protections under various envi-
ronmental laws including the California Environ-
mental Quality Act (CEQA), the Migratory Bird
Treaty Act, the California Endangered Species
Act, and the federal Endangered Species Act
(see Figure 2 and Appendix A1)9. Impacts from
development can be caused by direct loss from
land conversion, but also from ”edge effects” from
development, light and noise pollution, cats and
dogs, and changes to natural processes such as
wildfire intensity and frequency, hydrology, and
habitat fragmentation. Invasive species introduc-
tions are often associated with ports, agriculture,
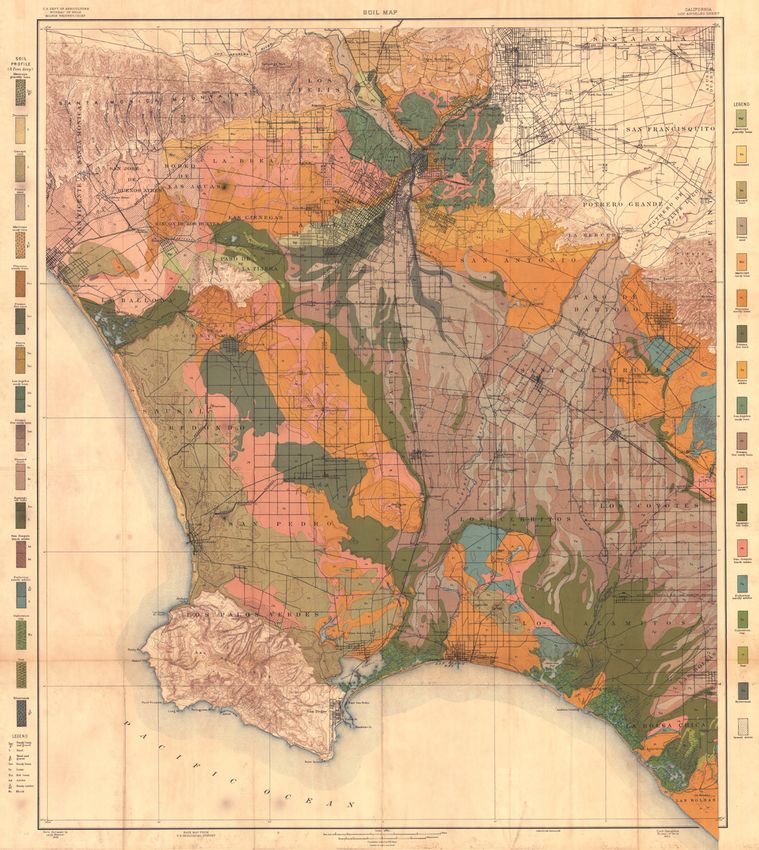
and diverse population centers. High housing Figure 3a: 1903 Los Angeles Soils.
demand, land shortages, and a sales-tax-based This soil and landform information is an indicator of the historic pattern
of biodiversity and ecosystems31.
municipal funding structure (California Proposi-
tion 13) have also lead to increased infill devel-
opment. Ongoing conversion of urban landscape
areas into high density development may further
reduce urban biodiversity and habitat connectivity
over time.
Climate change is also predicted to have pro-
found negative effects on biodiversity in Los
Angeles, and some effects will likely be complex
and unpredictable. The State of California has
released reports such as the Climate Change
Vulnerability Assessment of California’s Terrestrial
Vegetation and Safeguarding California Plan: Cal-
ifornia’s Climate Adaptation Strategy that discuss
threats to local biodiversity18,19,20. Species’ pro-
cesses of migrating to future favorable climates
will likely be impacted by habitat fragmentation,
and new models of conservation design are
needed (often considering the need for species
to move either upwards in elevation, northward,
toward the coast, or toward more northerly as-
pects of hillsides)21. Susceptibility of low-lying
ecosystems to sea-level rise occurs along the
coast near the Port of Los Angeles, Venice, Playa
del Rey, and Ballona Creek, with limited land area
available for inland/upland migration. Species Figure 3b: Sunset Climate Zones for Los Angeles.
currently at the southern edge of their ranges This map produced by the gardening industry provides the most de-
tailed map of microclimates in LA, a key driver of biodiversity5.
in Southern California, including the Southern
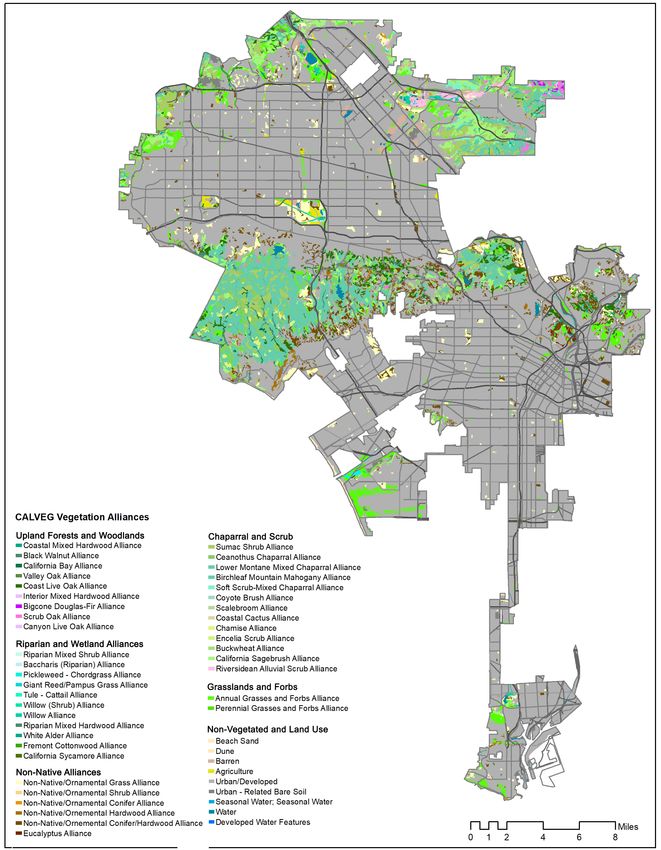
| 02 Profile of the CityFigure 4: USFS CALVEG Vegetation Alliances 2000-201037
Alliances are useful for understanding species distribution, habitat quality, and species conservation priorities (See Appendix A3).
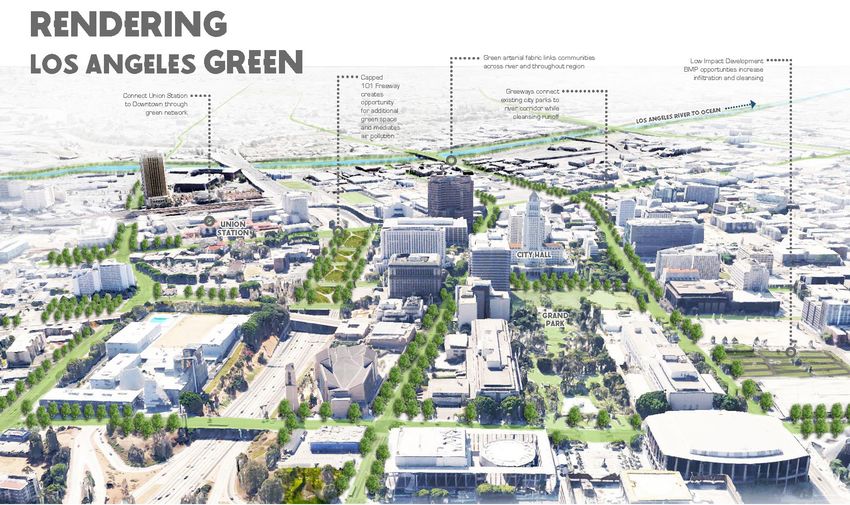
California steelhead and the California red-legged frog, may be more vulnerable to climate change22,23. However, these southern genotypes are also thought to possess important genetics that may help more northerly popula- tions adapt to warmer temperatures; therefore, their conservation is believed to be of high importance to overall conservation of the species24. In these cases, Southern California conservation activities may be important to broader species survival. Climate change may also push species from Baja California northward, or from the desert toward the coast, which will have implications for habitat restoration, conservation design, and species’ native “status” within the City. Warmer temperatures may also impact public health and the value of urban eco- system services, such as tree canopy shade25. Biodiversity Features Los Angeles falls within the California Floristic Province, which has been designated as a global biodiversity hotspot26. Characterized by high species richness and endemism (species only occur in a specific area), bio- diversity hotspots are globally significant conservation priorities. Due to rainfall patterns, the natural growing season in Los Angeles occurs in the winter and spring, when abundant wildflower blooms are important biological and cultural events, including the superbloom of 2017. The California poppy, the State Flower of California, and other wildflowers occur on many of the foothills in the City (a list of other officially designated State species in Los Angeles is included in Appendix A4)27. Many native plant species enter seasonal states of dormancy to survive high temperatures and low soil moisture. Native biodiversity in LA is strongly driven by abiotic factors, including high variability in microclimates and phys- iography (soil, topography, hydrology, etc.). These factors and other natural processes support LA’s 37 native vegetation “alliances”, the USFS’s most detailed level of its ecological classification hierarchy (see Figure 4 and Appendix A3)28. These alliances provide unique habitat conditions for many of our rarest native species. The City also contains many additional, more altered, vegetation alliances comprised of both native and non-native biota that also provide important habitat for native biodiversity, especially in urban areas. Los Angeles boasts a variety of coastal and riparian habitats. Coastal habitats in the region include shorelines and estuaries around the mouth of Ballona Creek, which includes diverse intertidal and closed wetland ecosys- tems. The Los Angeles River estuary and adjacent wetlands are largely altered, but patches of restored habitat Figure 5a: Los Angeles Green Infrastructure (provides beneficial habitat and connectivity for urban biodiversity) TL/BL: Los Angeles Zoo: Green Parking Lot and Vegetated Bioswale TR: Ed P. Reyes River Greenway BM: Avalon Green Alley, South Los Angeles BR: South Los Angeles Wetland Park | 02 Profile of the City
Figure 5: USFS CALVEG Vegetation Types37
Vegetation types are useful for understanding general habitat structure and ecosystems services relationships.
occur in adjacent Long Beach and at Machado Lake. Riparian habitat is found along the LA River, which sup- ports high diversity of resident and migratory bird species across its length, despite being mostly concrete-lined11. Unlined sections through the Elysian Valley and Big Tujunga Wash include some of the highest riparian species diversity. Remnant “old growth” coast live oaks, California sycamores (including one that still marks the boundary of LA and Compton), and endemic Engelmann oaks are still scattered across the Los Angeles Plain, however, most natural vegetation has been lost from the vast alluvial plains that comprise most developed areas of the City29. These areas once likely contained coastal sage scrub, oak savanna, and grassland complexes interspersed with flood- plains, riparian woodlands, alluvial riversidean scrub, and extensive seasonal freshwater wetlands30. An historic 1903 soil map (see Figure 3a) provides a good approximation of past hydrology, vegetation, and location of his- toric wetlands; these soils and landforms also have important implications for future enhancement of biodiversity and ecosystem services31. Diverse microclimates are also key drivers of past and present biodiversity in LA, and Figure 3b presents a detailed classification scheme that combines considerations of growing season, timing and amount of rainfall, winter low and summer high temperatures, wind, humidity, and topography (see Appendix A5 for more information)5. The highest concentration of biodiversity in the City occurs within the foothills of the Santa Monica, San Gabriel, and Santa Susana Mountains. Large intact tracts of coastal sage scrub, chaparral, alluvial scrub, and evergreen oak woodland types persist here. Tracts are large enough to provide habitat for large mammals including moun- tain lions, mule deer, and black bears. The famous mountain lion, P-22, resides in Griffith Park (LA’s “central park”), and has captured the imagination of the City32. The highest terrain in the City occurs in the San Gabriel Mountains, reaching over 5000’, and is home to a few native conifer tree species including the bigcone Doug- las-fir and gray pine28,30,33. With the exception of large patches of major vegetation alliances, distributions of populations of flora and fauna species across the entire City have not been well documented. Most detailed studies address smaller areas such as Griffith Park, Ballona Wetlands, El Segundo Dunes, and the Santa Monica Mountains. Species composition Figure 6: The Greenways to Rivers Arterial Stormwater System (GRASS) GRASS is a nationally recognized (NACTO, 2017) and award winning (ASLA, 2017) tool developed by LASAN and California State Polytechnic University, Pomona for building increasingly self-regulating and sustainable projects that support greater biodiversity, public health, and equity within the existing street tributary system38,39. | 02 Profile of the City
and distribution within more urban areas and landscapes are not well understood or mapped. However, citizen
scientist apps, like iNaturalist, provide large amounts of data across the City and are just beginning to be evaluat-
ed. Further citizen data gathering and processing may eventually help determine distribution and abundance of
species across the City, and should be aggressively promoted. Comprehensive mapping of key urban biodiversi-
ty hotspots and coolspots across the more developed areas of the City is needed.
The City of Los Angeles is also associated with two additional major biodiversity areas, (1) Santa Monica and
San Pedro Bays and (2) the Owens Valley. The Hyperion Water Reclamation Plant releases recycled water and
permitted discharges into the Santa Monica Bay, and the D.C. Tillman and Los Angeles-Glendale Water Recla-
mation Plants release to San Pedro Bay via the Los Angeles River. The Terminal Island Water Reclamation Plant
discharges its tertiary-treated effluent into the Los Angeles Outer Harbor. Advances in wastewater treatment
and increasing water reuse are reducing impacts of this infrastructure on biodiversity over time. Stormwater
discharges, predominantly by way of the LA River and Ballona Creek, also impact marine and riparian biodiversi-
ty. Increased City initiative to achieve compliance with the federal Clean Water Act is helping to reduce negative
impacts to biodiversity. Los Angeles also receives a portion of its water supply from City-owned infrastructure in
the Owens Valley, on the eastern slope of the Sierra Nevada Mountains north of the City. This water diversion
impacts biodiversity and ecosystems there, and will be addressed in future City biodiversity initiatives.
Administration of Biodiversity
The following City Departments have a role in administration of biodiversity in the City:
• Animal Services (wildlife, feral cats, etc.)
• City Planning (land use, open space, and conservation planning)
• Los Angeles Zoo (biodiversity education, conservation, research)
• Department of Water and Power
• Los Angeles World Airports (LAX El Segundo Dunes Nature Preserve)
• Port of Los Angeles (manages marine zone of Los Angeles Harbor)
• Recreation & Parks (parks, natural areas, Cabrillo Marine Aquarium)
• Public Works
o Bureau of Sanitation (manages streets, stormwater, wastewater, solid waste, environmental moni-
toring)
o Bureau of Street Services (streets, urban forestry)
o Bureau of Engineering (urban design, landscape guidelines, major development projects, new
parks, CEQA/NEPA, regulatory compliance)
Other government agencies responsible for biodiversity:
• Los Angeles County
o Planning
o Department of Parks and Recreation
o Museum of Natural History (education, conservation, research)
• State of California
o California Department of Fish and Wildlife (threatened and endangered species, habitat conserva-
tion, Fishing in the City program)
o California Department of Parks and Recreation (LA has 10 State Parks)
o California Coastal Commission (coastal wetlands, marine and terrestrial biological resources)
• Federal Agencies
o U.S. Army Corps of Engineers (Los Angeles River, flood control, stream impacts)
o United States Forest Service (urban initiatives, research stations, Angeles National Forest, San
Gabriel Mountains National Monument)
o National Park Service (Rim of the Valley Initiative, Santa Monica Mountains National Recreation
Area)
See Appendix A4 for additional links, references, and City profile data.
03   Indicators 1-10
     Native Biodiversity in the City

                                       photo: Nurit Katz, UCLA
Indicator 1: Proportion of Natural Areas Singapore Index Score
4/4
Isaac Brown Ecology Studio provided data analysis for this indicator, and Dr. Travis Long-
core, Faculty Member at USC, provided guidance.
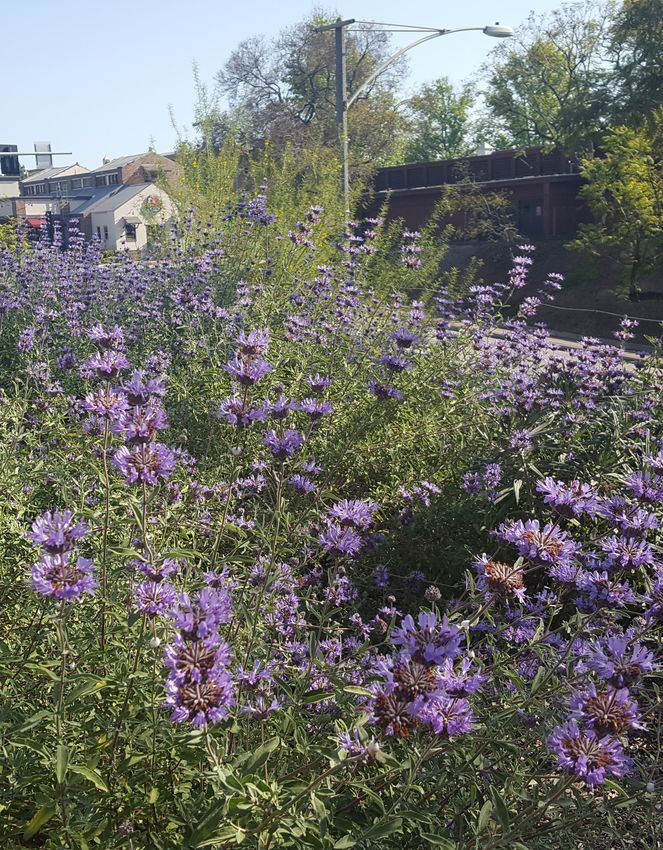
CALVEG 2000-2010 dataset (see Figure 4) was used to estimate natural areas
in the City. The dataset relies on satellite remote sensing to estimate vegeta-
tion alliances and is the only complete, uniformly sampled dataset covering the 20.55% natural areas
entire city area. Alliances were classified as “natural” based on consensus of (61,931 acres natural areas of
the Expert Council (see Appendix B1, Table 1.2). See Appendix B1 for addition- 301,345 acres measured)
al detailed methods and data discussion.
0 points: 20%
LA has a relatively high proportion of natural areas according to the Index.
Most of these are in the large, high quality open spaces of the Santa Monica
and San Gabriel Mountains. Of the 55 vegetation alliances mapped in CALVEG, 34 have been classified as “nat-
ural”; three alliances as “degraded natural areas” comprised of mostly non-native annual grasses and forbs; five
as “non-native shrubs and trees”; five as agricultural; four as “water” that are mostly reservoirs and artificial lakes,
however, may include some more natural water bodies that require further investigation; two as urban; and one as
“non-native perennial grasses” (see Figure 7). This remotely sensed data is not able to capture smaller urban nat-
ural areas, and there is some level of error in the original classification. Fires, land development, and other distur-
bance events since around year 2000, when the data was collected, may have contributed to a reduction in vegetat-
ed lands and changes in land cover character that are not captured in this assessment. These impacts may have
also resulted in further degradation of natural areas. While tracking the total amount of natural areas is an important
indicator, measurement of the quality of natural areas and changes between alliance types is also important going
forward.
Management Implications and Recommendations for the LA Index
1. Quality and extent of natural vegetation is a key indicator for any city biodiversity index and should be incorpo-
rated and modified in the LA Index.
2. Since the CALVEG dataset is over 15-years old, updated data is needed to provide a more accurate character-
ization of the current vegetation conditions across the City. Additionally, higher resolution imagery is currently
available, which could greatly improve the quality of measurement.
3. An updated assessment should also attempt to map and classify smaller urban natural areas.
4. Numerous smaller-scale projects, such as vegetation mapping in Griffith Park and Ballona Wetlands, EIRs, and
other project areas, have been completed and may be assembled and processed to provide additional clarity on
existing conditions. Feasibility of such a compilation process should be evaluated.
5. Urban areas and non-natural areas should also be classified and evaluated for native biodiversity value. A pre-
liminary list of “areas of obvious biodiversity” has been collected by stakeholders in Council Districts across the
City and should be evaluated for biodiversity value.
6. A ranking system to better differentiate the gradient of natural to non-natural, and high to low biodiversity value
areas should be developed. This system should be capable of assessing all landscapes, parks, and open spac-
es and could become the basis for indicators.
7. Vegetation classification and mapping protocols should be identified for future project-specific (suitable site to
regional scale projects) to ensure that the quality of data continues to improve over time. The Survey of Cali-
fornia Vegetation Classification and Mapping Standards (June 30, 2015), produced by the CDFW Veg CAMP
should be referenced. Such mapping would help address the need to better differentiate the quality of natural
areas based on association and alliance-level classification at finer resolutions (i.e., smaller minimum map units
for natural and semi-natural vegetation types).
| 03 Singapore Index: Native BiodiversityNatural Areas Classification
Figure 7: Natural Areas Classification (see Appendix B1 for source data discussion)
Indicator 2: Connectivity Measures Singapore Index Score
2/4
Isaac Brown Ecology Studio provided data analysis for this indicator.
Measuring connectivity can be complex and approaches may address move-
ment of individual species or more basic measurements of the pattern of
natural areas and landscapes across a city. “Effective mesh size” is a measure
of the probability that two random points in the city would fall into the same 738.32 hectares
habitat “patch”. In the Singapore Index, patches are comprised of natural = effective mesh size
areas with gaps of less than 100 meters and not bisected by major transpor-
tation corridors. Methods and factors considered in measuring effective mesh 0 points: < 200 ha
size are mapped in Figure 8 and described in more detail in Appendix B2. 1 points: 201-500 ha
2 points: 501-1000 ha
3 points: 1001-1500 ha
Results Discussion 4 points: > 1500 ha
Effective mesh size is a useful measure of the overall pattern of natural areas
in the City without consideration of specific species movement characteristics.
It also emphasizes contiguous connections, such as corridors and relatively close habitat proximity (100-meter gap
distance). Yet many species, including many birds and “adapter” species may be willing to travel greater distances
between patches. Such species may benefit from “habitat stepping stones” that are not contiguous with other natu-
ral areas by this SI measure. Other indicators are needed to measure connectivity in this regard. Additionally, while
LA has a relatively moderate effective mesh size, many of the large natural areas around the northern and eastern
rim of the San Fernando Valley are in fact connected to much larger natural areas in the region, which if also mea-
sured, would increase this result dramatically. Regardless, increasing connectivity between patches within the City
could provide additional habitat benefits that would be reflected by improvement of this indicator over time.
Management Implications and Recommendations for the LA Index
1. Effective mesh size does not address configuration of ecological networks, only total connectivity. Identifying
priority areas for connectivity and areas where connectivity is being reduced by development are important con-
siderations. There are several notable connections within the City, and across the City border, that should be
evaluated further (see Section 6.4.b. for more information). Connections between smaller urban natural areas
should also be identified.
2. The impact of climate change on connectivity within LA’s narrow coastal Ecological Section should be assessed.
3. Existing “least cost paths” of connectivity between patches should be identified and evaluated for protection
and enhancement. Least cost paths should consider the role of habitat stepping stones and urban landscapes
in connectivity, in addition to contiguous corridors. The potential for an urban greenways initiative to enhance
connectivity, such as the Greenways to Rivers Arterial Stormwater Systems (GRASS - see Figure 6), to enhance
connectivity should be considered.
4. Use of indicator species to measure and plan for habitat connectivity should be assessed. “Adapter”, “avoid-
er”, and “wobbler” species have been suggested as potential indicator species guilds. Species associated with
different habitat types (e.g., wetlands/riparian, uplands, specific vegetation associations) should be considered
as indicator species. Additionally, the basic pattern of connectivity within and between habitat types should be
considered independent of indicator species. The dispersal of plant species by wind, animals, and water should
also be considered in connectivity design.
5. An important principle of connectivity planning is that patches should have at least two primary routes of connec-
tivity (i.e., least cost paths) to adjacent patches.
6. Urban habitat connectivity should be measured and modeled using the latest software (e.g., Circuitscape). Land
use, landscape/vegetation, and patterns of night lighting are useful “landcover” data layers to consider as a
basis for connectivity modeling. While some relationships between such landcover characteristics and the dis-
tribution and movement of wildlife are known, additional research to assess the distribution of wildlife should be
conducted in the City to improve the effectiveness and local “calibration” of this modeling. New genetic sampling
techniques are an especially promising method for understanding these relationships.
| 03 Singapore Index: Native BiodiversityConnectivity Analysis
City of LA Boundary
Figure 8: Effective Mesh Size Analysis (see Appendix B2 for source data discussion)
Indicator 3: Native Birds in Built Up Areas Singapore Index Score
4/4
Dr. Ryan Harrigan, Faculty Member at UCLA, provided data analysis for this indicator.
Data from the eBird citizen science data set was evaluated for 2011-2016 for
built areas. Natural areas per Indicator 1, plus all water bodies were excluded
and the remaining areas were classified as “built-up areas”. An additional 100’ 292 native bird species
buffer was added to natural areas and water to potentially reduce observations documented (of ~500+ total
recorded from outside natural areas or water looking in (see Figure 9). Na- species observed in LA)
tive species were classified using the County Bird List from the Los Angeles
0 points: < 19 native species
Audubon Society. See Appendix B3 for detailed methods and data discussion, 1 points: 19-27 native species
including results in Table 3.2. 2 points: 28-48 native species
3 points: 48-69 native species
4 points: >68 native species
Results Discussion
The number of native species in built LA far surpasses the Singapore Index score categories, a testament to the bird
diversity within the City. However, this is likely somewhat of an overestimate due to possible location error in citizen
observations. For example, many marine species are recorded as observed in built areas. Smaller water bodies or
natural areas may have also not been classified appropriately in the CALVEG dataset (used to map Indicator 1) and
observations may be from these areas. Regardless, the variety of habitats present from coastal to montane areas,
and the location along the Pacific Flyway for migratory birds are key drivers of such high bird richness in built areas.
Citizen science data provides a convenient way to measure bird occurrences across the entire city and efforts
should be made to better leverage this tool for expanding the characterization of bird species in built areas, including
addressing potential location error. Formal scientific sampling for the entire City through all seasons should also be
considered.
Management Implications and Recommendations for the LA Index
1. The presence of native bird species in built areas is key to understanding urban habitat connectivity, and further
research of this relationship is needed.
2. Species distribution and abundance are better indicators than total number of species (i.e., species richness)
because a few high-quality areas can result in high species richness. The Shannon Index and Simpson’s
Diversity Index may be useful tools to account for richness, abundance, and distribution across the entire City.
Citizen science programs can be leveraged to increase bird observations and improve understanding of these
indicators.
3. Improving understanding of the distribution and urban habitat suitability characteristics of rare and more com-
mon native bird species may lead to the identification of urban bird “hotspots” and “coolspots”. The potential
correlations between bird species and land use, landscape, and building density should be evaluated.
4. “Indicator species” to track the quality and location of urban bird habitat should be identified. Such indicator
species should be sensitive to environmental changes that result from management of City land uses and land-
scapes. Concentrating efforts on a selection indicator species (i.e., 12 or less, ideally) may be a more effective
and efficient way to measure change in the City than measuring total bird species richness. The Expert Council
has proposed considering “umbrella species”, “keystone species”, breeding birds, overwintering birds, “adapt-
ers”, “avoiders”, “wobblers”, and/or species associated with particular habitat types as indicator species.
5. Tree canopy is a good indicator of urban bird diversity, especially for wintering forest birds, and this relationship
should be evaluated further.
6. Migratory birds, both long distance migrants and species that move between the City and local mountains, are
also potentially important indicator species, since many rely on the LA River, foothill woodland patches, and
other sites proximate to the coast as migratory stopovers or wintering habitat.
7. Using birds as an indicator of equitable distribution of biodiversity across neighborhoods should be considered.
Council Districts, census tracts, census blocks, census block groups, land uses, landcover types, and neighbor-
hoods should be considered as units of measurement of distribution.
| 03 Singapore Index: Native BiodiversityBuilt Up Areas vs. Natural Areas and Water
Figure 9: Built vs. Natural Areas and Water.
Light green areas are considered as “built up”, and only bird records from these areas were analyzed.
Indicator 4: Change in Vascular Plant Species Singapore Index Score
Baseline
Natalie Farnham from Santa Monica College and Dan Cooper from UCLA/Cooper Ecologi-
cal assisted in data analysis for this indicator.
The Calflora dataset was used to assess native vascular plants observed
in the City. This dataset contains recorded observations from herbaria and 449 native plant species
iNaturalist, and was used to generate a list of recorded observations within a recorded, 67 are rare with
rectangular area based on the City boundary. Observation accuracy in this special protected status
dataset is considered high, but location precision varies, and the number of 0 points: maintaining or decreas-
observations within the City is limited. Therefore, this list is most likely an ing the number of native species
underestimate; however, some older observations may also include species no 1 points: 1 native species increase
longer present in the City. Also, observations are concentrated in wilder areas 2 points: 2 native species increase
of the City; therefore, this does not represent a complete inventory of urban 3 points: 3 native species increase
4 points: 4+ natv. species increase
areas or smaller natural areas.
CalScape is a database produced by the California Native Plant Society. It includes observations and estimates of
species’ native ranges by USGS Quads across California. This database was also used to generate a general list of
potential native species in the City. However, the coarse resolution of USGS Quads and the fact that estimates are
projections based on suitable environmental conditions mean that actual native status of species should be consid-
ered on a case-by-case basis. It is highly unlikely that all 1,127 species potentially present based on this dataset
occur or are native to the City. Expert Council member, Dan Cooper, has also assessed plant species reports from
iNaturalist and identified over 900 species that were not indicated as “introduced” within the City (i.e., potential na-
tive plant species). See Appendix B4 for detailed methods and data discussion.
Results Discussion
(Note: Change in vascular plant species is measured over time, therefore the initial Singapore Index measurement
is considered the “baseline”). Observations of 449 different native plant species have been recorded in Calflora (Ap-
pendix B4, Table 4.2), including 67 special status species (Appendix B4, Table 4.4), and 1,127 native plant species
are projected to have suitable range in the City in the Calscape database (Appendix B4, Table 4.3). While 1,127
is an overestimate, Calscape may be useful to help determine native plant species that may be present in the City
of Los Angeles, but have not been recorded in Calflora or iNaturalist (Appendix B4, Table 4.4). Initiatives, possibly
utilizing citizen science, to determine which species from this list are actually present within the City, including their
distribution and abundance, should be considered.
Management Implications and Recommendations for the LA Index
1. Measuring the total number of species within the entire City is difficult and may not be an effective metric to sup-
port management decisions. Total species richness does not reflect changes in the City well since a few high
quality natural areas may “dominate” the species count. As a result, only the addition of relatively rare species
to these areas may result in positive change of the indicator. Enhancements to degraded natural areas with
more common native species may not be reflected.
2. Considering the entire City-extent, species distribution and abundance are perhaps more useful indicators than
total species richness. Species richness metrics may be more useful to measure quality of specific focus areas
of interest, such as individual parks or habitat patches.
3. A citizen science program to locate native species not currently observed (Calflora list), but have the potential
to occur here (Calscape List), should be considered. Updating mapping of CALVEG alliances, which are good
indicators to track changes to natural areas, based on more recent vegetation data will improve the quality of
this indicator.
4. Focusing effort on the recovery of a smaller number of species that have been extirpated from the City, rather
than overall change in the number of vascular species present, may provide a more accurate measure of how
vascular plants are changing in the City over time. Areas in which native vascular plants do not occur should be
considered as a measure of poor access to native biodiversity.
| 03 Singapore Index: Native BiodiversityYou can also read