WHO Expert Committee on Drug Dependence Pre-Review Cannabis plant and cannabis resin - World Health Organization
←
→
Page content transcription
If your browser does not render page correctly, please read the page content below
WHO Expert Committee on Drug
               Dependence Pre-Review
                                             ……………..

           Cannabis plant and cannabis resin
                                  Section 5: Epidemiology

This report contains the views of an international group of experts, and does not necessarily represent the decisions
                                or the stated policy of the World Health Organization

                                                         1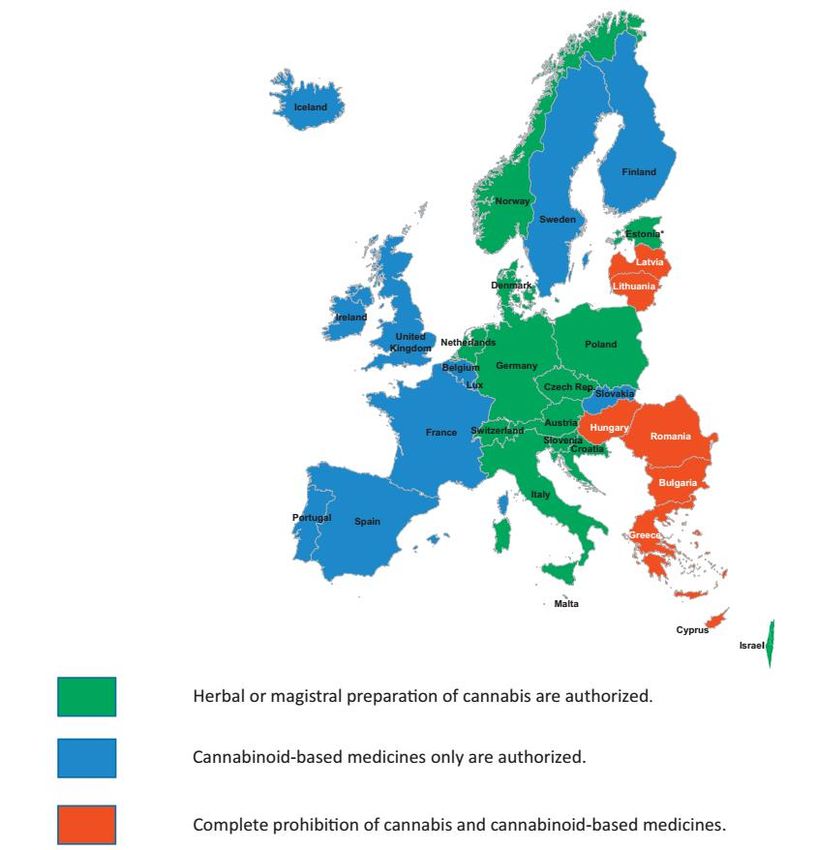
© World Health Organization 2018

                                               All rights reserved.

This is an advance copy distributed to the participants of the 40th Expert Committee on Drug
Dependence, before it has been formally published by the World Health Organization. The document
may not be reviewed, abstracted, quoted, reproduced, transmitted, distributed, translated or
adapted, in part or in whole, in any form or by any means without the permission of the World Health
Organization.

The designations employed and the presentation of the material in this publication do not imply the
expression of any opinion whatsoever on the part of the World Health Organization concerning the legal
status of any country, territory, city or area or of its authorities, or concerning the delimitation of its
frontiers or boundaries. Dotted and dashed lines on maps represent approximate border lines for which
there may not yet be full agreement.

The mention of specific companies or of certain manufacturers’ products does not imply that they are
endorsed or recommended by the World Health Organization in preference to others of a similar nature
that are not mentioned. Errors and omissions excepted, the names of proprietary products are
distinguished by initial capital letters.

The World Health Organization does not warrant that the information contained in this publication is
complete and correct and shall not be liable for any damages incurred as a result of its use.

                                                    2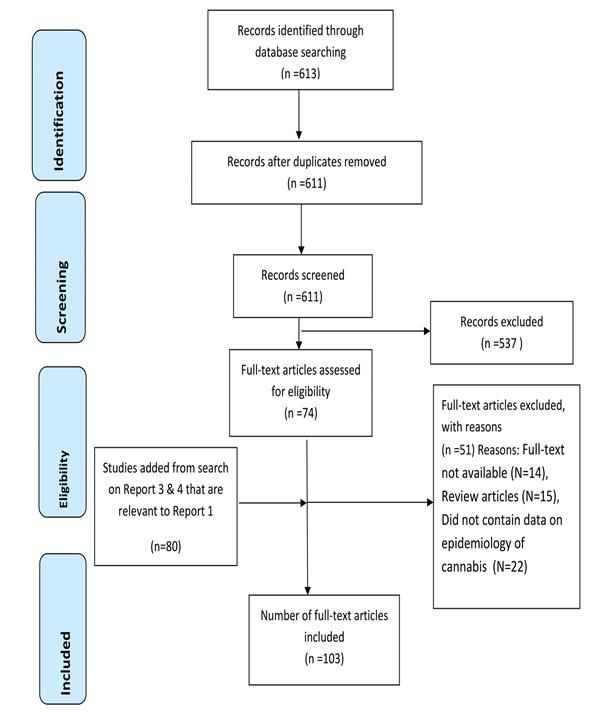
Acknowledgments
This report was prepared by the Secretariat of the Expert Committee on Drug Dependence (ECDD) within
the Department of Essential Medicines and Health Products (EMP) of the World Health Organization
(WHO), Geneva, Switzerland. The WHO staff involved in the production of this document, developed under
the overall guidance of Mariângela Simão (Assistant Director General, Access to Medicines, Vaccines, and
Pharmaceuticals), Suzanne Hill (Director, Essential Medicines and Health Products), Gilles Forte, (Secretary
of the Expert Committee on Drug Dependence) were Dilkushi Poovendran (Technical Officer, WHO
Essential Medicines and Health Products) and Wil De Zwart (Technical Officer, WHO Essential Medicines
and Health Products).

This report was commissioned as a background document for a preliminary review for the 40th Expert
Committee on Drug Dependence (ECDD). WHO would like to acknowledge the contributions of the
following individuals who authored this report:

Chemistry
Giuseppe Cannazza (University of Modena and Reggio Emilia), Italy
Cinzia Citti (University of Modena and Reggio Emilia), Italy

Pharmacology
Jenny Wiley (RTI International), USA

Epidemiology
Vidhi Thakkar (Centre for Addiction and Mental Health), Canada
Haya Fernandez (Centre for Addiction and Mental Health), Canada
Omer S.M. Hasan (Centre for Addiction and Mental Health), Canada
Jakob Manthey (Institute for Clinical Psychology and Psychotherapy), Germany
Jurgen Rehm (Centre for Addiction and Mental Health), Canada
Astrid Otto (Centre for Addiction and Mental Health), Canada
Charlotte Probst (Centre for Addiction and Mental Health), Canada
Julian Sauer (Centre for Addiction and Mental Health), Canada

Toxicology
Jonathon Arnold (University of Sydney), Australia

Therapeutic Use
Kevin P. Hill (Harvard Medical School), USA
Judith Spahr, (Thomas Jefferson University) USA
Charles V. Pollack. (Thomas Jefferson University) USA
Brock Bakewell (Thomas Jefferson University), USA

The Member State questionnaire report was prepared by Jurgen Rehm, Astrid Otto, and Jakob Manthey.
Technical editing was provided by Ann Morgan and Susan Kaplan.
Administrative support was provided by Afrah Vogel and Christine Berling.

                                                        3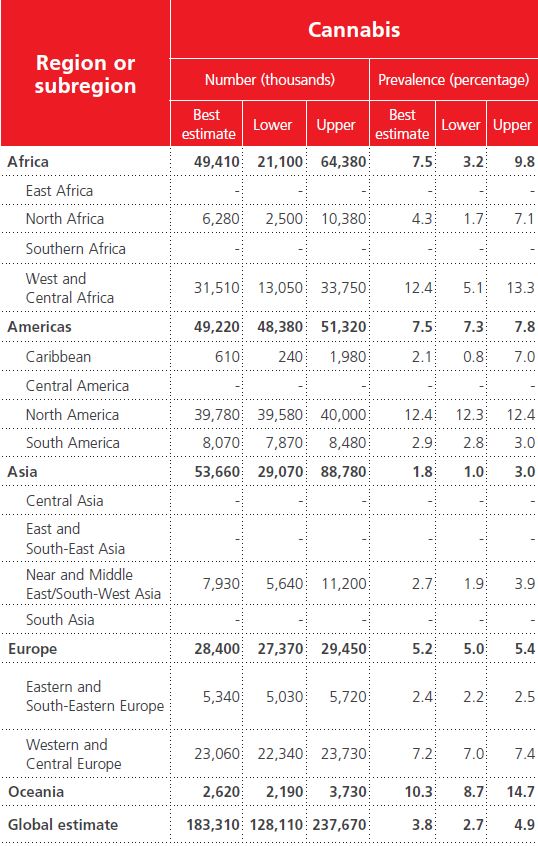
Contents
1.                  Industrial use ................................................................................................................ 5
2.            Non-medical use, abuse, and dependence ................................................................... 6
2.1 Non-medical cannabis use ......................................................................................................................7
   2.1.1 Global and regional prevalence of cannabis use ..............................................................................7
2.2 Global and regional trends in cannabis use prevalence ..........................................................................9
2.3 General population studies from the systematic search ......................................................................13
   2.3.1 Self-medication ...............................................................................................................................17
2.4 Epidemiological studies on THC content (cannabis potency) ...............................................................22
2.5 Trends in cannabis potency ..................................................................................................................23
   2.5.1 Wastewater analyses of cannabis potency.....................................................................................23
   2.5.2 Potency measured from cannabis samples (herbal, resin, extract, tinctures) .................................27
   2.5.3 THC in other populations ................................................................................................................30
2.6 Cannabis use disorders .........................................................................................................................33
   2.6.1 Global and regional prevalence of cannabis use disorders .............................................................33
   2.6.2 Global trends in prevalence for cannabis use disorders ..................................................................36
   2.6.3 Risk of cannabis use disorder among cannabis users .....................................................................36
   2.6.4 Data quality and consistency of epidemiological data ...................................................................37
3.              Nature and magnitude of public health problems related to misuse, abuse and dependence
                38
3.1     Overview of cannabis-attributable and cannabis-related harm............................................................38
3.2     Quantifying cannabis-attributable harm ...............................................................................................39
3.3     Harm to others......................................................................................................................................40
3.4     Cannabis exposure among public-health relevant vulnerable and special populations .......................41
3.5     THC concentration while driving under the influence of cannabis .......................................................44
4.             Licit production, consumption, international trade .................................................... 48
4.1     Medical cannabis programs ..................................................................................................................48
5.                  Illicit manufacture and traffic ..................................................................................... 53
6.                  References ................................................................................................................. 69

                                                                               4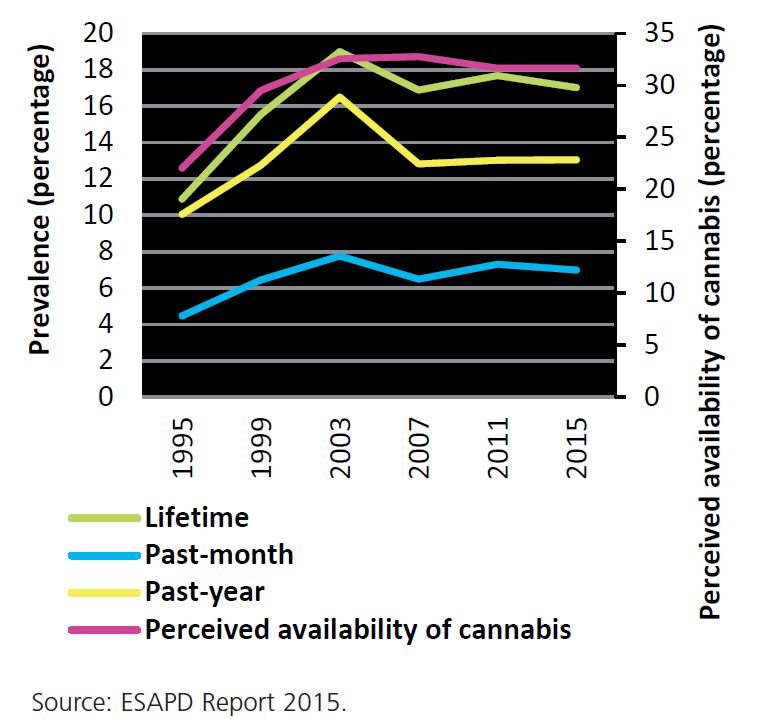
1. Industrial use
In our rapid systematic review, there were no articles that focused on industrial use of cannabis plant and
resin. There are two classes of industrial use: pharmaceutical industry and hemp-related industry. These
classes which will be discussed in the section on Licit Production, consumptions, and international trade
below.

                                                    5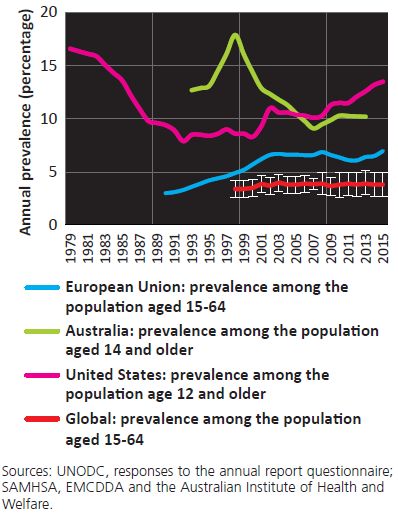
2. Non-medical use, abuse, and dependence
In this section, the global and regional distribution of a) non-medical cannabis use and b) cannabis use
disorders are presented and, if available, time trends are reported. Non-medical cannabis use (i.e., without
a valid prescription) implies various cannabis use motives, the majority of which can be distinguished using
the following two major categories:
Self-medication
Recreational/leisure use
For both categories, there is a risk of cannabis use disorders, which is a term that has been used differently
in different classification systems. In DSM-IV (3), the term “cannabis use disorders” was generally used for
the combined categories of “abuse” and “dependence”, and in DSM-5 (1) for the unidimensional concept
combining both former categories. However, in ICD-10 (2), the term is not defined, although it is
sometimes used to combine dependence and harmful use. We will use the term as used in the Global
Burden of Disease Study (GBD; http://www.healthdata.org/gbd), as most of our data on cannabis use
disorders were taken from this study (See legend of Table 7 for more details).
Thus, non-medical cannabis use as reported in this section involves a heterogeneous group of users with
different use motives and also includes those with a cannabis use disorder. On the other hand, cannabis
use disorder only involves persons meeting the diagnostic criteria of ICD-10 or DSM-IV or DSM-5
classifications, regardless of their motives. In the latter section, the risk of cannabis use disorder for
cannabis users is elaborated on the global as well as on the regional level.
Most of the data reported in this section has been obtained from the United Nations Office of Drugs and
Crime system (UNODC http://www.unodc.org/ (4); published in the annual World Drug Report; last
available report for the year 2017: https://www.unodc.org/wdr2017/index.html - (5)), by a variety of
regional agencies (for example the European Monitoring Centre for Drugs and Drug Addiction (EMCDDA);
published in the annual European Drug Reports; report for the last available year: (6)), and by the GBD ((7);
last annual report on illicit drug exposure and attributable burden (8)), all of which on routinely collect data
on illicit drug use and use disorders. The prevalence figures refer to at least one use occasion/meeting
diagnostic criteria within the past 12 months.
6
2.1 Non-medical cannabis use
2.1.1 Global and regional prevalence of cannabis use

We refer to the World Drug Report 2017 (5) for data on the prevalence of cannabis use. More than 183
million adults are estimated to have used cannabis in 2015 (lower estimate: 128 million; upper estimate:
238 million), with about the same absolute number of users in Africa, the Americas and Asia (see Table 1
for details). In terms of prevalence for the 15-64 age group (see (9) for methodology), estimates are
highest for North America and West and Central Africa (12.4%), followed by Oceania (10.3%) (for the
definition of regions used by UNODC see (10)).

These prevalence data are based on government surveys conducted by the UNODC, and other available
data, mainly from general population surveys. These data on country prevalence can be found on the
website of UNODC (11). This website also features data about cannabis use among young people
(adolescents) (12). Data on cannabis use seems to be spotty between countries and years. For all of the
years, there is data for 121 countries. However, for the year 2015, the last year where data was available,
data stems from only 21 countries.

A more inclusive data search for a shorter period of time was conducted for the GBD 2010 study (13-16).
Overall, the search identified national estimates of prevalence for cannabis use in the general population
for 56 countries for the time frame between 1990 and 2008. The overwhelming majority of data was
available for the time frame between 2005 and 2007.

In some instances, estimates may have been derived indirectly from treatment statistics using the
multiplier method. This method estimates the prevalence by adjusting the number of people receiving
cannabis treatment (from health registries) by the proportion of cannabis users who report receiving drug
treatment (from surveys).

All methodologies to estimate the prevalence of illicit drugs have weaknesses. For general population
surveys, major weaknesses relate to the sampling frame, which in most cases does not include high-risk
populations such as institutionalized people, and to the fact that participants may be reluctant to disclose
illicit drug use due to its illegality (16); for the multiplier method, the source for the multiplier is key (17).
As a consequence, bias cannot be excluded, and the amount of bias will depend on a number of factors not
the least on the stigmatization of cannabis in the respective culture (18).

                                                        7
Table 1: 12-month prevalence of cannabis use in the general population aged 15-64 by
region (5)
With respect to gender and cannabis use, women generally had a lower 12-month prevalence of cannabis
use, but these gender differences in prevalence seem to get smaller in recent cohorts (19, 20). In a meta-
analysis of studies by Chapman and colleagues (20), the gender-ratio decreased from 2:1 (i.e., cannabis use
prevalence of men twice as high as of women) in the 1941-1945 cohorts to 1.3:1 in the 1991-1995 cohort.
Even seemingly different results such a widening of the absolute gap in the United States do not necessarily
contradict this overall finding: for example, between 2007 and 2014, the gap between men and women
became wider (in terms of absolute prevalence difference), but the gender ratio decreased (i.e. ratio of %
male to % female; (21)).
Thus, while there are biological differences in cannabis use-related behaviours and the effects of cannabis
on the brain and other organs (22), the main determinants of cannabis use seem to be more social. This
may be different for cannabis use disorders, as other research has shown that the transition from use to
use disorders is more genetically determined than the transition between non-use and use (23, 24).
In a recent INCB report on women and drug use (25), the following additional points were raised:
8 While in general, women start using drugs later than men do, once women started, their rate of
cannabis use progresses more rapidly compared to men, and they tend to develop a substance use
disorder more quickly than men do.
The genetic disposition for problematic cannabis use impacts women to a greater extent than men.
Based on twin studies, for women, 59% of problematic cannabis use could be attributed to shared
genes, while 51% was attributed to shared genes among men.
2.2 Global and regional trends in cannabis use prevalence
Figure 1: Annual cannabis prevalence: United States, European Union, Australia, Global level (5)
Figure 1 gives the global and selected regional 12-month prevalence of cannabis use for the past decades
(not age-adjusted). The global numbers seem pretty stable for the last 15 years, but there is a lot of change
in the regional trends. For the US, the 12-month prevalence since 1980 decreased for more than 10 years
and began increasing in the late 1990s. In Europe, as defined by the European Union, there had been an
upward trend since the late 1990s, with more stability in since 2000. In Australia, trends were downward
9from the late 1990s to about 2007 and have been stable since. This indicates that regional trends in
cannabis use can be quite contrary to global patterns.
Regional time trends of cannabis use have been examined only in a handful of studies. The most
comprehensive assessment stems from international school surveys, such as the ‘European School Survey
Project on Alcohol and Other Drugs’ (ESPAD, see http://www.espad.org/) (26) and the WHO funded ‘Health
Behaviour in School-aged Children‘ (HBSC, (27)), as there are no multi-national general population surveys
on cannabis use conducted in comparable populations over time. The above-mentioned school surveys
provide data for high-income countries in Europe and North America. As cannabis use is largely
concentrated among 15 to 30-year-olds, school surveys can indicate relevant trends for the user
population.
Figure 2 provides select trends among 15 to 16-year-olds based on the ESPAD surveys, which provides
comparable data on student drug use every four years (28). Results show similar trends as for the EU
general population: increases between 1995 and 2003 (see Figure 1 above), and an almost flat line since
2007.
Figure 2: Cannabis prevalence among 15-16 year-olds, Europe (5)
The detailed results (not shown here but in (28)) show parallel temporal developments for boys and girls,
with boys having higher prevalence on all indicators for the entire time period. ESPAD also included
10measures on the perceived availability of cannabis, which follows a similar trend curve as use (for both
sexes combined and gender-specific with boys also showing higher perceived availability (28)).
In terms of sub-regions of Europe, ESPAD data on 28 European countries from five waves between 1999
and 2015 were used to assess temporal trends in monthly cannabis use prevalence among adolescents by
sex. The results indicate that cannabis use increased in Southern European countries (boys: 1999 = 7.9%;
2015 = 8.7%; girls: 1999 = 5.0%; 2015 = 5.9%) and on The Balkans (boys: 1999 = 7.7%; 2015 = 10.1%; girls:
1999 = 5.8%; 2015 = 7.4%), whereas decreases were observed among Western European boys (1999 =
21.3%; 2015 = 13.4%;(29)).
According to the HSBC data, a decrease in 12-month adolescent cannabis use between 2002 and 2006
could be observed in most of the 31 European and North American countries (30). Using the same data
and including the subsequent wave of 2010, another study examined trends of cannabis-only and co-use
with tobacco. For cannabis-only, a smaller number of adolescent users was found in Anglo-Saxon countries
(Ireland, UK) and North America (Canada, USA), whereas there was no significant change across all regions.
The 12-month prevalence of cannabis co-use with tobacco decreased in all observed regions with different
magnitude (strongest in Anglo-Saxon countries from 14.6 to 8.4%).
In Latin America, survey data in major cities from Brazilian students suggest that 12-month prevalence of
cannabis use among elementary and high school students from grade 6 and older has been increasing from
the late 1980s to 2004, with city specific trends between 2004 and 2010 (see Figure 3; (31)).
11Figure 3: Trends in 12-month prevalence (in %) of cannabis use in major Brazilian cities 1989 -2010
12.0
10.0
8.0
6.0
4.0 1989
1993
2.0
1997
0.0
2004
2010
For a few countries, repeated general population surveys provide trend data beyond adolescents. In North
American high-income countries, the decreasing prevalence of cannabis use among youths could be
reiterated in general population surveys. In the USA, data on youths from the annual ‘National Survey on
Drug Use and Health’ (NSDHU) suggest a decline of 12-month cannabis use prevalence between 15.8%
(2002) and 13.1% (2014), which mainly occurred during 2002 to 2007 (32). However, data from the same
survey suggest that cannabis use prevalence in the older population (50 years or older) increased between
2006/2007 (2.8%) and 2012/2013 (4.8%; (33)). Looking at NSDHU data for the entire adult population
(aged 12 years or older) confirms these trends: Overall, cannabis use increased significantly between 2002
(past-month: 6.2%; 12-month: 11.0%) and 2014 (past-month: 8.4%; 12-month: 13.2%) but not among 12 to
17-year-olds (34). In another general population survey, the rising 12-month prevalence between
2001/2002 (4.1%) and 2012/2013 (9.5%) was corroborated (35).
Similar trends were also seen in Canada between 2004 and 2015, where 12-month cannabis use increased
in the population aged 25 to 64, whereas use rates decreased among 15 to 24-year-olds (36).
For Europe, cannabis use over time constitutes a rather heterogeneous picture when considering national
or regional data. According to the 2017 EMCDDA Drug Report (37), recent national surveys show upward
(7 out of 15), stable (6 out of 15) or downward trends (2 out of 15) since 2014. Looking at data from the
last decade on adults aged 15 to 34, 12-month cannabis use decreased in Spain and the UK but increased in
12France, Denmark, Finland, Ireland, Germany, and Sweden, with some degree of stability in more recent
years. In France, the highest 12-month prevalence was recorded with 22% (38), which continues a rising
trend of lifetime use prevalence between 1992 and 2000 (39). In Germany, data from eight waves of a
general population survey were used to assess trends of cannabis use. For both men and women aged 18
to 59, 12-month cannabis use became more prevalent between 1995 (men: 6.5%, women: 2.3%) and 2015
(men: 8.7%, women: 5.3%; (40)). In Italy, one study compared data from population surveys and
wastewater samples collected across the country. Between 2010 (3.0%) and 2012 (1.8%), both data
sources point to a reduction of past-month cannabis use, followed by an increase in 2014 (3.7%; (41)).
In Australia, a general population survey conducted in nine waves between 1993 and 2016 indicates stable
lifetime use prevalence at around 35%. 12-month use decreased slightly from 12.7% (1993) to 10.4%
(2016). While pronounced declines were present in younger age groups (youths aged 14-19: 2001 = 27.7%;
2016 = 15.9%), cannabis use increased in the middle-aged population (persons aged 40-49: 2001 = 11.8%;
2016 = 16.2%; (42)).
2.3 General population studies from the systematic search
There are a number of prevalence studies in the peer-reviewed literature specifically related to cannabis
plant and resin use (for search and inclusion/exclusion criteria see Appendices 1 and 2). Interestingly, none
of these studies are classic household or telephone surveys of the general population. It is likely that most
general population surveys, are either in the grey literature, or they deal with so many specific topics that
cannabis is not one of their keywords. This means that from our peer-reviewed searches no additional data
can be added to the international and national monitoring mentioned above.
These peer-reviewed prevalence studies occurred in the Central African Republic, Canada, United States,
Germany, France, Spain, and Italy, among others, and varied widely in the study population (from toddlers
to school children to adults to drivers), methodology and, not surprisingly, also in the prevalence. As seen
in Table 2, the prevalence in these general population studies ranged from 0% to 38.6% (41, 43-65).
The highest prevalence of recent cannabis consumption (self-reports validated by urinalysis) of 38.6% was
reported in a cross-sectional study from the Lobaye district in the Central African Republic in 2016 (62).
The study was done in the Aka population, a population of foragers of the Congo Basin. Cannabis use was
high mainly in men (70.9%) and seemed to be associated with unconsciously1 self-medicating for
1
The authors of the paper explicitly mention “unconscious” self-medication. In this report, we only speak about self-
medication, as in many studies it is not empirically determined, whether the self-medication was made consciously or
not.
13helminthiasis (a parasitic worm infestation). Similar behaviours have been observed for other tribes and for
other drugs, supporting an evolutionary perspective on the origin of drug use (66, 67).
The lowest prevalence of 0 was reported from a wastewater study in four mega-cities in China in the year
2012, where no cannabis derivative above the threshold was detected, thus indicating no, or very minimal,
cannabis use (68). Another very small prevalence was reported in France relating to 29 cases of under
three-year-old children with cannabis ingestion over a time period of 10 years in a hospital with 42,000
patients annually (69).
Part of the prevalence variations was attributable to measurement bias (self-reported measures, urine,
blood, saliva, or wastewater testing; see Table 2). Most importantly, self-reported prevalence usually
reflects 12-month use, whereas biological testing usually refers to shorter time-periods, based on the
windows of detection. In Table 2, studies with self-reported prevalence have a superscript “a”; these
prevalence numbers are based on 12-month prevalence unless otherwise notified. Studies that reported
the prevalence based on biological testing have a superscript of “b”. Most tests are based on urine or saliva
samples, where cannabis use can be detected anywhere from a few days to up to one month or more in
the past, depending on the frequency of use (daily use can be detected the longest) (70). The window for
detection is shorter for blood and, in fact, so short that for some of the planned per se laws for cannabis
and traffic participation (71), detection via blood may become virtually impossible (72). Another method to
assess cannabis use prevalence is wastewater analysis, which requires a fair number of assumptions on
average cannabis consumption per occasion, and on average THC content per standard joint or per
standard use. The resulting prevalence ranged from 0.35-3.73% (41, 59, 61). Most of the wastewater
analysis studies focused on THC concentration and the prevalence and level of THC from these studies will
be further discussed in Report 3 (73).
It is important to note that twenty studies (out of N=103) conducted biological tests for cannabis use,
whereas the remaining studies relied on self-report measures, primarily through questionnaires (41, 43, 46,
48-52, 54-59, 61, 63-65, 74, 75). Most of the international monitoring efforts rely on studies using self-
report measures. The few studies which compared self-report with biological measures found a fair degree
of convergence, but by no means a perfect agreement (76, 77).
Obviously, the convergence of self-report and biological testing will depend on the context of assessment
(for instance, in treatment situations, where treatment continuation in some situations may be contingent
on use), on the perception of anonymity, and on the degree of stigma for cannabis use. Of note, one study
14used wastewater analysis to correct prevalence estimates based on self-report, concluding that self-reports
underestimate true prevalence by 52% (59).
Table 2: Epidemiological results from general population studies (representing a country or region)
Name of Country/ Sample
Study Type Median Year Prevalence % Keywords
Sub-region Size (N)
Germany (43) Primary, cross- 1999 964 9.8a,b University students,
sectional athletes
France/11 cities (74) Primary, case- 2000.5 1,800 7.5b Injured drivers,
control random roadside
testing
Denmark (75) Secondary, 2002 3,516 7.2b Blood analysis, driving
cross-sectional under the influence
Austria (46) Secondary, 2002 1,902 5.1b Urine analysis, males,
cohort illicit drug use
Thailand/ Southern Primary cohort 2003 30,011 2.3-3.4a Lifetime cannabis use,
region Songkhla, high school students
Pattani, Phuket and
Surat Thani (47)
Norway/ Oslo (48) Secondary, 2003.5 103 13.0b Acute, fatal
cross-sectional poisonings, autopsy
Netherlands (63) Primary, cohort 2004 7,610 2.3a&b Women who
delivered babies,
paternal and maternal
cannabis use, self-
report, urine testing
b
Switzerland (49) Secondary, cross- 2005 4,668 27.7 Blood analysis, driving
sectional under impairment
b
United States/ New Secondary, cross- 2005 416 17.2 inner city population at
Orleans (65) sectional delivery admission, urine
toxicology screen
a&b
France (50) Secondary 2006 3,493 16.1 Self-reported cannabis
use and urine analysis,
military staff
b
United States/ Secondary, cohort 2010 588 2.4% Unintentional ingestion
of cannabis by children
15Name of Country/ Sample
Study Type Median Year Prevalence % Keywords
Sub-region Size (N)
Colorado (51) up to age 12 visiting a
hospital
c b
Mexico/ Cuernavaca Primary, cross- 2008 174 1.2 Drug use among college
(52) sectional students
b
France/ Toulouse (69) Retrospective, 2009 Not clear; Very small Accidental cannabis resin
cross-sectional 42,000 poisoning, children up to
patients 3 years of age visiting
annually hospital
b
Finland (54) Secondary, cross- 2007 13,315 22.2 Driving under influence,
sectional blood analysis
b
Spain/Catalonia (55) Cohort study 2007 1,026,690 4.0 Wastewater analysis
b
Italy/ Northern region Secondary, cross- 2009.5 43,535 1.3 monthly Transport-related
(56) sectional study prevalence occupations; quasi-
random testing
a&b
Afghanistan/ 11 Secondary, cross- 2011 19,025 3.9 Self-reported cannabis
provinces (57) sectional use, urine, hair and saliva
testing
b
Norway (58) Primary, cross- 2011 2,437 0.7 Saliva analysis,
sectional employees, cannabis use
a
Spain (64) Cohort 2011 209 2.9 Pregnant mothers,
cannabis use during and
before pregnancy
b
Italy/ 17 cities (41) Wastewater 2012 - 3.7 Wastewater analysis
analysis
b
Switzerland/ Lausanne Wastewater 2013.5 223,900 9.4 Wastewater analysis in
(59) analysis addition to self-report
a
United States/ Primary, cross- 2014 3,847 29.2 High school students,
Connecticut (60) sectional cannabis use, e-
cigarettes
Spain/Vitoria (61) Wastewater 2015 1,508,972 0.35-1.0 Wastewater analysis
analysis daily
b
consumption
c a
Central African Primary, cross- 2016 379 38.6 Self-report, cannabis
Republic/ Lobaye sectional use, indigenous
16Name of Country/ Sample
Study Type Median Year Prevalence % Keywords
Sub-region Size (N)
district (62)
a b c
= self-report, = biological testing, = publication year, data collection period unavailable
2.3.1 Self-medication
Up to this point, we reported prevalence of cannabis use in various populations. In many countries, this
use is not medical, if medical is defined by cannabis being prescribed by the medical system (for a
description of the medical systems see point on Medical cannabis programs with Licit production,
consumption, international trade below). As indicated above, non-medical cannabis use may have a variety
of motives, with self-medication and recreational use being the two major ones.
The following point is about self-medication. Cannabis has some therapeutic potential ((5, 78-81); for
actual use see (82)). While there are no global estimates of the proportion of people which use cannabis
for self-medication or for purely recreational purposes, the high proportion of people with certain diseases
in Table 3 indicates that self-medication plays an important role as a motive for cannabis use.
Several studies reported that cannabis plant and resin use were used for a range of medical conditions. It
should be noted that some studies did not directly assess the reason for the use of cannabis (i.e., medical
use, self-medication, recreational use; likely for most as self-medication). For those studies where this was
assessed, many patients reported a perception of cannabis lowering the symptom load for their respective
medical condition. While the studies showed variability in prevalence, the prevalence figures in clinical
populations were all markedly above the rate of cannabis use in the general adult population. Table 3
provides a list of clinical conditions for which cannabis plant and resin was used and the prevalence of
cannabis use among patient/people affected by these conditions.
Table 3: Prevalence of clinical conditions and prevalence of cannabis use among patients
Name of Study Type Median Sample Prevalence ICD Chapter, Findings
a, b
Country/ Sub- Year Size (N) (%) Clinical
region Condition
a
Canada/ Mixed study 2000 104 43.0 I, HIV 29% reported medical use for HIV. A
Ontario (83) (cross- significantly higher number of women
sectional compared to men used cannabis for
multicenter pain management (45% vs. 5%, p <
survey and 0.02). The most commonly reported
retrospectiv reason for medical cannabis use was
e chart appetite stimulation/weight gain
17Name of Study Type Median Sample Prevalence ICD Chapter, Findings
a, b
Country/ Sub- Year Size (N) (%) Clinical
region Condition
review) (70%).
a
United Primary, 2000 2,969 18.3 XVIII, VI, V, XIII, Medical cannabis use was reported by
Kingdom (84) cross- VI, chronic patients with chronic pain (25%),
sectional pain, multiple multiple sclerosis and depression (22%
sclerosis and each), arthritis (21%) and neuropathy
depression, (19%).
arthritis and
neuropathy Of 948 reported users, 648 (68%)
reported that cannabis made their
symptoms overall “much better”, 256
(27%) reported a “little better”, 36
(4%) reported “no difference” and
eight subjects (0.8%) reported a “little
worse” (four subjects) or “much
worse” (four subjects).
a
Spain/ Vitoria Primary, 2002 92 57.0 V, first 25 patients used cannabis before their
in the Spanish cohort psychotic first psychotic episode and continued
Basque episode use during follow-up (CU), 27 used
Country (85) cannabis before their first episode but
stopped its use during follow-up
(CUS), and 40 never used cannabis
(NU). The functional outcome of CUS
patients improved more than that of
NU patients. Moreover, the functional
outcome of CUS patients improved
progressively, while their negative
symptoms diminished significantly.
Continued use of cannabis (CU) had a
deleterious effect on outcomes. CU
patients only improved in their
positive symptoms and showed a
nonsignificant tendency to increase
their negative symptoms.
a
Canada/ Primary, 2001 136 21.0 VI, seizures Of the 136 subjects with seizures, 65
Alberta (86) cross- (48%) had used cannabis in their
sectional lifetime; 28 (21%) were active users;
20 (15%) had used in the past month;
18 (13%) were frequent users, and 11
(8.1%) were heavy users.
a
France/ Paris, Primary, 2009 139 45.0 VI, cluster Among the 27 patients (19.4% of the
cross- total cohort) who had tried cannabis
18Name of Study Type Median Sample Prevalence ICD Chapter, Findings
a, b
Country/ Sub- Year Size (N) (%) Clinical
region Condition
Marseille (87) sectional headaches to treat cluster headache (CH) attacks,
25.9% reported some efficacy, 51.8%
variable or uncertain effects, and
22.3% negative effects.
a
Canada/ Primary, 2002 205 17.0 VI, Multiple Seventy-two subjects (36%) reported
Halifax (88) cross- Sclerosis ever having used cannabis for any
sectional purpose; 29 respondents (14%)
reported continuing use of cannabis
for symptom treatment. Medical
cannabis use was associated with
recreational cannabis use. The
symptoms reported by medical
cannabis users to be most effectively
relieved were stress, sleep, mood,
stiffness/spasm, and pain.
a
United Primary, 2002.5 445 64.0 V, psychotic No assessment of symptom relief as
Kingdom (89) case control disorder primary aim was etiological (i.e., link
between use and disease).
b
United States Primary, 2005 500 11.0 XVIII, chronic No data on symptom relief.
(90) cohort pain
a
Canada/ Primary, 2006 291 47.8 for XI, VI, Comparable proportion of ulcerative
cross- inflammatory inflammatory colitis (UC) and Crohn’s disease (CD)
Toronto (91) sectional bowel disease bowel, patients reported lifetime [48/95
multiple (51%) UC vs. 91/189 (48%) CD] or
43.0 – sclerosis current [11/95 (12%) UC vs. 30/189
prevalence for disease (16%) CD] cannabis use. Of lifetime
cannabis use users, 14/43 (33%) UC and 40/80
in the last (50%) CD patients used it to relieve
month IBD-related symptoms, including
abdominal pain, diarrhea and reduced
appetite. Patients were more likely to
use cannabis for symptom relief if
they had a history of abdominal
surgery [29/48 (60%) vs. 24/74 (32%);
P=0.002], chronic analgesic use [29/41
(71%) vs. 25/81 (31%); PName of Study Type Median Sample Prevalence ICD Chapter, Findings
a, b
Country/ Sub- Year Size (N) (%) Clinical
region Condition
questionnaire score (45.1±2.1 vs.
50.3±1.5; P=0.03).
c a
United Primary, 2006 254 18.0 VI, multiple 68% (75/110) had used cannabis to
Kingdom/ case-control sclerosis alleviate symptoms of MS (MS-related
London, Kent cannabis use). Forty-six (18%) had
(92) used cannabis in the last month
(current users), of whom 12%
(31/254) had used it for symptom
relief. Compared to patients who
could walk unaided, cannabis use was
more likely in those who were chair-
bound (adjusted Odds Ratio 2.47;
1.10-5.56) or only able to walk with an
aid (adjusted Odds Ratio 1.56; 0.90-
3.60). Pain and spasms were common
reasons for cannabis use. Seventy-one
per cent of individuals who had never
used cannabis said they would try the
drug if it were available on
prescription.
a
Nether Primary, 2007.5 17,698 67.0 V, mental No reasons given for cannabis use, but
cross- health associations between cannabis use
lands (93) sectional and mental health outcomes.
b
United States/ Secondary, 2010.5 2,333 10.0 V, psychiatric
Minnesota, retrospectiv inpatients
Wisconsin (94) e
b
United States/ Secondary, 2011.5 3,809 11.2 XVIII, non- The most common non-opioid
Washington cross- cancer chronic substance detected was THC (11.2 %
(95) sectional pain of urine drug tests (UDT). There was
no significant association between
opioid regimen characteristics and
illicit drugs. Patients preferred
cannabis as a primary method for
managing pain. Physicians were
reluctant to prescribe daily opioids for
cannabis users.
b
Israel (96) Primary, 2012 250 16.4 V, mental No data on reasons of use or on
cross- health associations with symptom relief/self-
sectional medication.
20Name of Study Type Median Sample Prevalence ICD Chapter, Findings
a, b
Country/ Sub- Year Size (N) (%) Clinical
region Condition
a&b
Africa/ Uganda Secondary, 2014 100 17.0 V, psychiatric No data on reasons of use or on
(97) cross- patient associations with symptom relief/self
sectional N medication.
a&b
United States/ Review, 2014.5 140 76.0 I Viral hepatitis Drug screening identified 9/140
Arkansas (98) patients who used RDU/THC.
cohort Substance use was highly prevalent
among HCV patients. No data on
symptom relief/self-medication.
b
United States/ Primary, 2015 229 27.0% XIX, ocular No data on reasons of use or on
Miami (99) cross- trauma associations with symptom relief/self
sectional N medication.
a&b
United States/ cohort 2015.5 926 24.0 II, Neoplasms Previous use was common (607 of 926
Washington [66%]); 24% (222 of 926) used
(100) cannabis in the last year, and 21%
(192 of 926) used cannabis in the last
month. Random urine samples found
similar percentages of users who
reported weekly use (27 of 193 [14%]
vs 164 of 926 [18%]). Active users
inhaled (153 of 220 [70%]) or
consumed edibles (154 of 220 [70%]);
89 (40%) used both modalities.
Cannabis was used primarily for
physical (165 of 219 [75%]) and
neuropsychiatric symptoms (139 of
219 [63%]). Legalization significantly
increased the likelihood of use in
more than half of the respondents.
a b c
= self-report, = biological testing, =publication year, data collection period unavailable
Legend: Definition of the ICD-10 chapters (101) used in the Table above:
I Certain infectious and parasitic diseases
II Neoplasms
III Diseases of the blood and blood-forming organs and certain disorders involving the immune mechanism
IV Endocrine, nutritional and metabolic diseases
V Mental and behavioral disorders
VI Diseases of the nervous system
VII Diseases of the eye and adnexa
VIII Diseases of the ear and mastoid process
IX Diseases of the circulatory system
X Diseases of the respiratory system
21XI Diseases of the digestive system
XII Diseases of the skin and subcutaneous tissue
XIII Diseases of the musculoskeletal system and connective tissue
XIV Diseases of the genitourinary system
XV Pregnancy, childbirth and the puerperium
XVI Certain conditions originating in the perinatal period
XVII Congenital malformations, deformations and chromosomal abnormalities
XVIII Symptoms, signs and abnormal clinical and laboratory findings, not elsewhere classified
XIX Injury, poisoning and certain other consequences of external causes
XX External causes of morbidity and mortality
XXI Factors influencing health status and contact with health services
XXII Codes for special purposes
2.4 Epidemiological studies on THC content (cannabis potency)
Cannabis contains close to 500 active and other compounds (102). Delta-9-tetrahydrocannabinol (THC) is
the principle ingredient linked to the psychoactive properties of cannabis, and thus important for use and
public consequences. In the following, when we speak about potency we refer to the concentration of
THC. Studies in cannabis potency are key of descriptive epidemiology for cannabis use: cannabis potency is
one of the key determinants between cannabis use and public health impact such as an increased risk for
(93, 94) or an earlier onset of psychotic episodes ((95); for a review see (96)).
We will give a short overview on global epidemiological trends of THC use based on international
monitoring efforts. Obviously, stable trends over time in use and use disorders may imply stable trends for
THC as well. The more/less cannabis is used, ceteris paribus, the higher/lower the load of THC. The ceteris
paribus condition refers to three factors. The above statement is only true, if:
the level of THC (or potency of cannabis) is constant;
the cannabis use behavior (103) (e.g., number of puffs, inhaled volume, the size of a standard joint;
the THC content per standard joint; see (104) for future considerations on standardization) is
constant; and
the measurement procedures over time did not change.
As we will see below, at least the first assumption does not hold true for the past decades, and there are
reasons to believe that the other assumptions may also be problematic.
222.5 Trends in cannabis potency
Overall, potency, as measured by level of THC content, has increased over the past decades for both herbal
cannabis and for resins. The annual reports of the INCB report increases for potency for Africa (25),
historically high levels of THC content for Europe with prior increases in potency (25, 38, 105-107), and
increases for North America (108, 109). Many of these trends have been based on regular (repeated)
analyses of seized cannabis herbs and resin.
The international monitoring reports had been corroborated by a series of reviews, most importantly the
systematic review and meta-analysis of Cascini and colleagues (110) on herbal cannabis. The authors
performed a meta-analysis by year on 21 studies containing 75 total mean THC observations from 1970 to
2009 using a random effects model. While there was much variability between studies, there was a
significant association between year and mean THC content in herbal cannabis, revealing a temporal trend
of increasing potency over the years (see Figure 4).
Figure 4: Per-year meta-analysis graph showing the mean Delta-9-tetrahydrocannabinol
concentration with 95% CI (110)
Another systematic review (111) corroborated this as well as trend studies in individual countries
(see below).
2.5.1 Wastewater analyses of cannabis potency
Population surveys on the use of illicit substances such as cannabis are an invaluable tool for building an
understanding of the epidemiology of the substance. However, there are limitations to self-report,
especially about matters involving legality such as illicit substance use: stigma and fear of consequences
23may affect the validity and reliability of these estimates (for general considerations and a meta-analysis for
a select population see (20, 21)), biasing prevalence and other epidemiological indicators downwards.
Objective measures thus are indispensable as an additional source of information for obtaining a realistic
picture of the use of illicit substances in the general population. While cannabis contains close to 500
active and other compounds (see above (3)), THC is the principal active ingredient linked to the
psychoactive properties, which in turn are linked to use and public health consequences. Thus, THC is a
good indicator for monitoring cannabis use as relevant for potential public health consequences.
Wastewater analyses of THC, can also serve as an objective measure to supplement and/or correct self-
reported data on prevalence. Several studies have found that prevalence estimates from wastewater
analyses reflect prevalence estimates from surveys (e.g., (55, 112)). One study even found wastewater
analyses over several years to mirror the time trends seen in population surveys (41). However, there can
also be disagreement between the two methods (113). In order to make such comparisons about
prevalence, a number of crucial assumptions have to be made, most importantly about use patterns of
cannabis users (103), and about standard size and potency of cannabis products (114, 115). However,
wastewater analyses are more accurate in providing estimates of total consumption of THC rather than in
drawing inferences about prevalence.
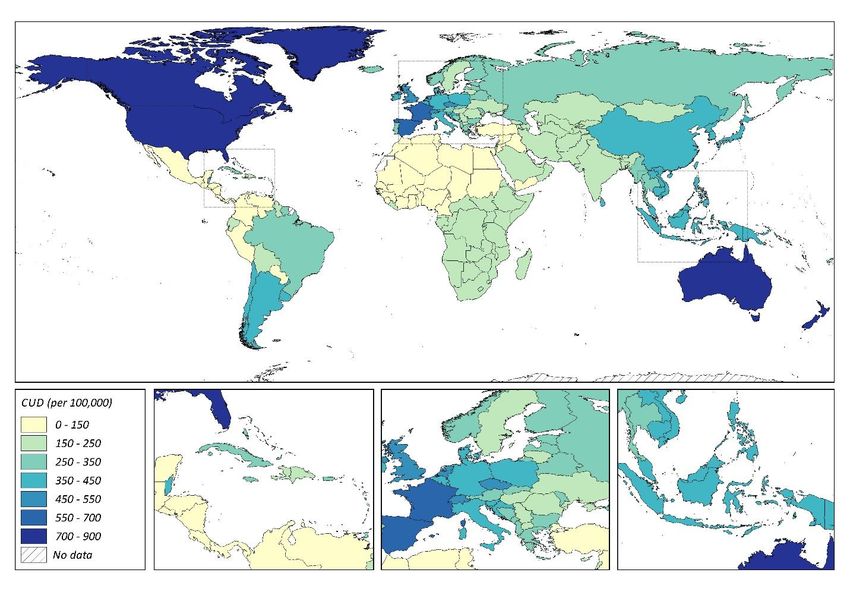
Consumption of THC varies across the globe (see Table 4). In China, THC consumption appears to be
negligible; THC was undetectable in the wastewater of Beijing, Shanghai, Guangzhou and Shenzhen (112),
which are four megacities in this country. This is in line with data from population surveys in mainland
China (112). Consumption in Spain (61) and the Caribbean (116) were as much as five times higher than
estimates for regions in Switzerland (59, 117).
Geographical differences in consumption also exist within the same country. In an analysis of 17 cities in
Italy, consumption of THC was significantly higher in large cities with populations greater than 350,000
(Bologna, Florence, Milan, Naples, Palermo, Rome, Turin) compared to smaller cities (41). A study of 9
cities in Finland (Helsinki, Tampere, Turku, Savonlinna, Espoo, Jyväskylä, Oulu, Seinäjoki and Vaasa) found
THC to be undetectable in the wastewaters of rural towns Savonlinna and Seinäjoki (118). Helsinki, the
most populated capital city in Finland with 43% of the inhabitants in this analysis, had the highest THC
consumption and accounted for 59% of the reported THC consumption (118). In the years 2006–2007, two
analyses in Spain differed markedly by a factor of ten (55, 113); the THC consumption in Catalonia, Spain
(55) was noted to be in line with national survey estimates of prevalence whereas the consumption in
North-Eastern Spain based on analysis of the Ebro River basin was considerably lower (113). In general, at
24least in European high-income countries, THC consumption appears to be higher in more metropolitan
areas.
Wastewater analyses also can give insights into the sociodemographic characteristics of users. Within the
city of Milan, THC consumption was found to be significantly higher in the East which hosts poorer and
more marginalized inhabitants (119). Wastewater analyses of school populations in Bologna, Florence,
Milan, Naples, Palermo, Rome, Turin and Verona found THC consumption to be higher in schools focused
on classic, scientific or artistic education as compared to vocational or professional schools (119).
Boleda and colleagues (55) estimated that the calculated consumption of 3,466 mg/day/1000 people was
equivalent to a 4% prevalence of cannabis use in a population of around 1 million, which may conceptualize
what these consumption values represent in terms of prevalence. Furthermore, a consumption of 3,466
mg/day/1000 people in Catalonia, Spain would mean a total of approximately 3.466 kg of THC consumed
daily (55). It is worth noting that these consumption values are calculated based on the total population
served by the wastewater plants sampled for analysis, which does not necessarily limit by a relevant age
range and so would include pediatric and geriatric populations with no or much lower consumption of
cannabis.
25Table 4: Wastewater analysis estimates of THC consumption
Average THC consumption
Country/Sub-region Median Year Population served (N)
(mg/day/1000 people)
United Kingdom/London
2005 5,500,000 7,500
(117)
Italy/Milan (117) 2005.5 1,250,000 3,000
Switzerland/Lugano (117) 2006 120,000 6,500
Spain/Catalonia (55) 2007 1,026,690 3,466
Spain/North-Eastern (113) 2007.5 2,800,000 680
Italy/Milan (119) 2010.5 – 8,300
Italy/8 schools in 8 cities
2011.5 6,126 106–1,201
(120)
China/Beijing, Shanghai,
Guangzhou and Shenzhen 2012 11,400,000 No detectable THC
(112)
Finland/9 cities (118) 2012 2,021,000 4,320
Italy/17 cities (41) 2012 – 4,350
France/Martinique (116) 2013 47,200 37,500
Switzerland/Western (59) 2013.5 223,900 1,600
Spain/Valencia (61) 2015 1,500,000 23,300
Costa Rica/Liberia,
2017* 49,973 7,160–10,700
Puntarenas (121)
*Date of publication
Trends in THC consumption are also apparent over the years. Consumption in the Italian cities of Bologna,
Florence, Milan, Naples, Palermo, Rome, Turin, Bari, Cagliari, Perugia, Pescara, Verona, Gorizia, Merano,
Nuoro, Potenza and Terni between 2010–2014 found THC consumption to be stable between 2010–2012
but found an overall increase in THC consumption by 2013–2014 that was not observed in any other illicit
substance measured (41). This increase was most evident in small cities with a population of less than
120,000 inhabitants (Gorizia, Merano, Nuoro, Potenza, Terni) and medium cities with a population of
120,000–350,000 (Bari, Cagliari, Perugia, Pescara, Verona) (41). Wastewater analyses of Italian schools in
Rome, Turin and Verona also showed an increase in THC consumption from 2010–2013 (119). The city of
26Milan, Italy showed an over two-fold increase in THC consumption from 3,000 mg/day/1000 people to
approximately 8,300 mg/day/1000 people between a wastewater analysis in 2005–2006 (117) and another
in 2010–2011 (119). Increases in THC consumption were also observed in Spain between two studies
conducted in 2007–2008 (55, 113) and another in 2015 (61). On the other hand, Switzerland appears to
have seen a decrease in THC consumption from approximately 6,500 mg/day/1000 people (117) to 1,600
mg/day/1000 people (59) between a wastewater analysis done in 2006 and another done in 2013–2014,
although the 2014 prevalence estimate by wastewater analysis was higher than the self-reported
prevalence in population surveys (59). It is also possible that these differences may be due to differing
geographical locations within the country.
It should be noted that an upward trend in THC may have different underlying reasons: a higher proportion
of people may use cannabis, or the cannabis use prevalence remained the same but the cannabis
consumed has higher potency, or both. Similarly, stable or downward trends in wastewater analyses could
have different underlying reasons, and we would need more knowledge about trends in standard units
such as joints (115).
2.5.2 Potency measured from cannabis samples (herbal, resin, extract, tinctures)
Potency of cannabis, as defined by THC content, varies across countries (see Table 5). The underlying
samples come from a variety of sources: police seizures, studies, where samples were obtained from legal
sources (coffee shops, medical cannabis), or studies where users were asked to bring along their illicit
cannabis, which was then measured for THC potency.
Data from individual countries converge with data from INCB reports indicating that potencies in North
America increased at a higher rate matching and even overcoming historically high potencies observed in
Europe. Between 2008–2013, the THC content of cannabis in the United States (122, 123), the Netherlands
(124), France (69) and Italy (125) were similar, ranging from to 7.5-13.0% in herbal cannabis and 10.3-
17.4% in resin. The potency of random cannabis samples seized by Norwegian police from 2013–2014 was
markedly lower at 1.9% and 3.8% for herbal and resin respectively (126), however online data from the
KRIPOS section of the Norwegian police report potencies at higher levels which is more in line with other
geographies (127). In The Netherlands, potency of domestically grown cannabis, whether herbal or resin,
was noticeably higher than imported cannabis (128). Potency of herbal cannabis has been consistently
lower than resin (69, 125, 126, 129) except for one study in which regular users provided their own supply
(124).
27Following global trends, the THC content of cannabis in individual countries appears to be increasing over
time, as evidenced by studies mainly conducted in high-income countries. Italy saw increases in potency of
2-3% from 2010 to 2012 (125) and France saw increases of 1-3% in just one year, as reported by the French
Observatory of Drugs and Drug Addictions (69). An extensive study of the THC content in 39,157 cannabis
seizures across the 51 states in the U.S. each year from 1990–2010 observed a steady increase of
approximately 7% over the ten-year period, which has been corroborated by other studies (122, 123, 130).
Finally, trends in the UK were upwards as well (128, 131), whereas the THC content in the Netherlands
(129) decreased in the time period between 2005 and 2015, but there was an increase from 2000 to 2015,
due to the first years following 2000 (132). Thus, the data from this line of research seem to corroborate
the data from chemical analyses of seizures and wastewater analyses (see above).
Changes in the legality of cannabis may be one of the causes of increases in THC content. Between 1990–
2010, U.S. states that allowed medical cannabis had an average potency 3.5% higher than states without
this law (123). With the legalization of recreational cannabis use, the potency of retail cannabis in 2015–
2016 is 10–20% higher than the THC content found in seized illegal cannabis in 2010 (122, 123). This
increase in potency associated with legalization has been suggested to be due mainly to an increase of
highly potent cannabis strains, which are the result of a professionalized breeding process and intensive
growing methodology (128).
Table 5: THC content and concentration in cannabis samples
Median Sample Average THC
Country Sample description
Year Size (N) content (%)
United States (123) 1990 741 Herbal cannabis 3.8
United States (123) 1995 3,742 Herbal cannabis 4.0
United States (130) 1995 3,763 Herbal cannabis/resin/oil 4.0
United States (123) 2000 1,894 Herbal cannabis 5.4
United States (130) 2000 1,929 Herbal cannabis/resin/oil 5.3
Netherlands (129) 2005 110 Domestic herbal cannabis 17.8
Netherlands (129) 2005 14 Imported herbal cannabis 18.9
28Netherlands (129) 2005 16 Domestic resin cannabis 6.7
Netherlands (129) 2005 55 Imported resin cannabis 20.0
United Kingdom (128) 2005 – Herbal cannabis 16.9
United Kingdom (128) 2005 445 Resin cannabis 5.9
United Kingdom (128) 2005 – Herbal cannabis 16.2
United States (123) 2005 2,233 Herbal cannabis 8.1
United States (130) 2005 2,295 Herbal cannabis/resin/oil 8.0
Netherlands/Alkmaar,
Amsterdam, Arnhem, Nijmegen, 2008.5 70 Herbal cannabis 12.4
Utrecht (124)
Netherlands/Alkmaar,
Amsterdam, Arnhem, Nijmegen, 2008.5 36 Resin cannabis 12.2
Utrecht (124)
Italy/Venice (125) 2010 544 Herbal cannabis 5.66
Italy/Venice (125) 2010 704 Resin cannabis 6.20
Netherlands (129) 2010 114 Domestic herbal cannabis 17.8
Netherlands (129) 2010 15 Imported herbal cannabis 7.5
Netherlands (129) 2010 9 Domestic resin cannabis 32.6
Netherlands (129) 2010 56 Imported resin cannabis 19.1
United States (123) 2010 2,023 Herbal cannabis 10.7
United States (130) 2010 2,260 Herbal cannabis/resin/oil 10.4
Australia (133) 2010.5 206 Herbal/resin Cannabis 14.9
Italy/Venice (125) 2011 581 Herbal cannabis 5.14
Italy/Venice (125) 2011 704 Resin cannabis 7.22
Indoor eradicated cannabis
Australia (133) 2012 13 19.2
crop
Outdoor eradicated cannabis
Australia (133) 2012 13 15.5
crop
29France (69) 2012 – Herbal cannabis 10
France (69) 2012 – Resin cannabis 16
Italy/Venice (125) 2012 846 Herbal cannabis 7.51
Italy/Venice (125) 2012 569 Resin cannabis 10.31
France (69) 2013 – Herbal cannabis 13
France (69) 2013 – Resin 17.4
Norway (126) 2013.5 21 Resin 1.9
Norway (126) 2013.5 20 Herbal cannabis 3.8
Herbal cannabis/resin/
United States (130) 2014 427 11.8
cannabis oil
Netherlands (129) 2015 110 Domestic herbal cannabis 16.2
Netherlands (129) 2015 17 Imported herbal cannabis 4.8
Netherlands (129) 2015 7 Domestic resin cannabis 31.6
Netherlands (129) 2015 66 Imported resin cannabis 17.8
United States/Seattle (122) 2015 – Cannabis flower 21.2
United States/Colorado (122) 2016 – Retail cannabis 28–32
Finally, in an analysis of web-based cannabis products for the medical cannabis program of Canada, the
majority of products had THC > 15% (range 7%-30%; (134)).
2.5.3 THC in other populations
Four studies retrieved in this rapid review assessed THC concentrations in general populations: employees,
students and foragers (see Table 6). As these samples were not hospitalized nor chosen to investigate
specific illnesses, cannabis use is presumed to be used predominantly for non-medical purposes. The
method of detection used by studies was either urine or saliva analysis. The length of detection of cannabis
via THC or its metabolites varies across methodology: 23–43 hours in serum, 15–34 hours in saliva and up
to one month in urine (135). THC concentrations in saliva have been found to be higher than blood
concentrations by a factor of 15 (136). Concentrations of THC above 25 ng/mL in saliva (58) and above 400
ng/mL in urine are indicative of recent use (43). The cannabis cut-off concentration for workplace urine
30You can also read