Women Veterans Report - The Past, Present and Future of Women Veterans - Veterans Affairs
←
→
Page content transcription
If your browser does not render page correctly, please read the page content below

Women Veterans Report

   The Past, Present and Future of
                     Women Veterans

           Department of Veterans Affairs

           National Center for Veterans
           Analysis and Statistics

           February 2017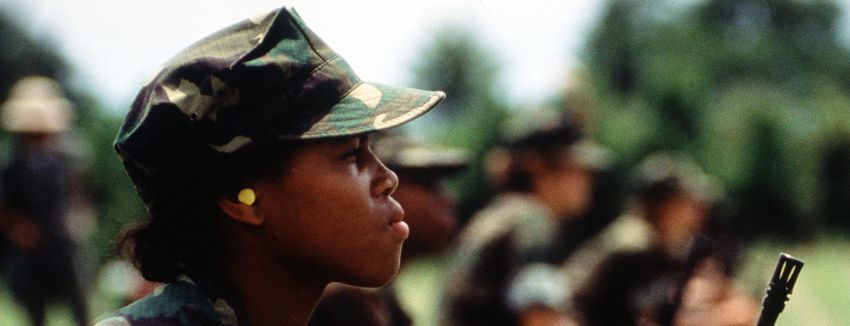

America’s Women Veterans:
                        Military Service History and VA Benefit Utilization Statistics

                                                      Prepared by:

                                    Office of Data Governance and Analytics

The Office of Data Governance and Analytics serves as the authoritative clearinghouse for VA to collect,
validate, analyze, and disseminate key statistics on Veteran population and VA programs to support plan-
 ning, analysis, and decision-making activities. For more information on reports, surveys, or statistics re-
garding the Veteran population, check our website at http://www.va.gov/vetdata/. For general inquiries,
                                  please e-mail us at VANCVAS@va.gov.

                                                    Contributors:
                                                   Maribel Aponte
                                                   Florinda Balfour
                                                      Tom Garin
                                                   Dorothy Glasgow
                                                     Tamara Lee
                                                    Eddie Thomas
                                                    Kayla Williams

                                         For Women Veterans everywhere

                                            Recommended citation for this report:
                       Women Veterans Report: The Past, Present, and Future of Women Veterans.
           National Center for Veterans Analysis and Statistics, Department of Veterans Affairs, Washington, DC.
                                                      February 2017

 National Center for Veterans Analysis and Statistics                                                              iii
Contents

List of Figures.............................................................................................................................................................vi
Executive Summary................................................................................................................................................vii

Women in Military History.....................................................................................................................................1

Intoduction.................................................................................................................................................................1

The History of Women as Veterans.....................................................................................................................6

Today’s Women Veteran.......................................................................................................................................10

             Demographic Indicators........................................................................................................................11

                          Period of Military Service........................................................................................................12

                          Age..................................................................................................................................................12

                          Race and Hispanic Origin........................................................................................................14

                          Marriage and Divorce ...............................................................................................................15

             Socioeconomic Indicators.....................................................................................................................17

                          Educational Attainment...........................................................................................................17

                          Occupation...................................................................................................................................18

                          Poverty...........................................................................................................................................19

                          Household Income....................................................................................................................21

                          Health Insurance Coverage....................................................................................................22

Utilization of the Department of Veterans Affairs
Benefits and Services............................................................................................................................................24

		              Most Prevalent Service-Connected Disabilities.............................................................28

			                    Post-Traumatic Stress Disorder............................................................................. 29

			                    Major Depressive Disorder......................................................................................29

			                    Migraine.........................................................................................................................29

			                    Lower Back Pain (Lumbosacral or cervical strain)...........................................29

National Center for Vetereans Analysis and Statistics
                                                 			                                                                        			                                            iv

			                                     Uterus and Ovaries, Removal of, Complete........................................................30

             Age Distribution for Women Veterans Receiving Compensation...........................................30

             Individual Unemployability Compensation....................................................................................31

             Degree of Disability..................................................................................................................................32

             Vocational Rehabilitation and Employ¬ment Program..............................................................33

             Pension Program.......................................................................................................................................33

             Education Benefits....................................................................................................................................33

Current Initiatives for Women Veterans..........................................................................................................35
             Institutional Advocates...........................................................................................................................35

             Homelessness ...........................................................................................................................................35

             Outreach and Education........................................................................................................................36

             Surveys.........................................................................................................................................................37

             Concluding Remarks...............................................................................................................................37

Appendix A................................................................................................................................................................39

Appendix B................................................................................................................................................................48

Appendix C................................................................................................................................................................53

Appendix D...............................................................................................................................................................54

Appendix E................................................................................................................................................................55

References.................................................................................................................................................................58

   National Center for Veterans Analysis and Statistics                                                                                                                   v
List of Figures
Figure 1. Number of Women Served and Casualty Counts, by Wartime Period
Figure 1a. Female Active-Duty Military Personnel: 1945 to 2015
Figure 2. Women Veterans as a Percent of the Veteran Population: 2000 - 2040

American Community Survey
Figure 3. Period of Military Service of Women Veterans: 2015
Figure 4. Age Distribution of Women, by Veteran Status: 2015
Figure 5. Race and Ethnicity of Women by Veteran Status: 2015
Figure 6. Distribution of Women, by Minority and Veteran Status: 2015
Figure 7. Percentage of Women Who Were Currently Married, by Age and Veteran Status: 2015
Figure 8. Percentage of Women Who Were Currently Divorced, by Age and Veteran Status: 2015
Figure 9. Distribution of Women’s Educational Attainment by Veteran Status: 2015
Figure 10. Age Distribution of Women with a Bachelor’s Degree or Higher, by Veteran Status: 2015
Figure 11. Work Category of Employed Women by Veteran Status: 2015
Figure 12. Occupation of Women by Veteran Status: 2015
Figure 13. Poverty Rates of Women, by Age and Veteran Status: 2015
Figure 14. Median Household Income of Women, by Age and Veteran Status: 2015
Figure 15. Uninsured Rates of Women Population, by Age and Veteran Status: 2015
Figure 16. Health Insurance Coverage of Insured Women, by Veteran Status: 2015

Utilization of the Department of Veterans Affairs Benefits and Services
Figure 17. Benefits Utilization of Women Veterans: 2005-2015
Figure 18. Benefits Utilization by Program and Gender Status: 2015
Figure 19. Number of Women Veterans Enrolled in the VHA Health Care System: 2005 to 2015
Figure 20. Ten Most Prevalent Primary Service-Connected Disabilities for Women Veterans: 2015
Figure 21, Age Distribution of Women Veterans with a Hysterectomy as Their Primary Condition: 2015
Figure 22. Age Distribution for Women Veterans Receiving Compensation
Figure 23. Age Distribution of Women Veterans Who Received Individual Unemployment
Compensation in 2015
Figure 24. Average Number of Service-Connected Disabilities, by Combined Degree of Disability: 2015
Figure 25. Age Distribution of Education Benefits Used by Women Veterans: 2015

 National Center for Veterans Analysis and Statistics                                              vi

Executive Summary
Since the time of the All-Volunteer Force, the number of women serving in the military has grown. Ultimately,
these women make the transition from Service member to Veteran. In 2015, women comprised 9.4 percent of
the total Veteran population in the United States. By 2043, women are projected to make up 16.3 percent of all
living Veterans. This report summarizes the history of women in the military and as Veterans, profiles the char-
acteristics of women Veterans in 2015, illustrates how women Veterans in 2015 used some of the major benefits
and services that are offered by the Department of Veterans Affairs (VA), and discusses the future of women Vet-
erans in relation to VA. The goal of this report is to communicate an understanding of who our women Veterans
are, how their military service affects their post-military lives, and how they can be better served based on these
insights.

Data Sources
Various data sources were used in this report. This report includes Veteran Population Projection Model
(Vetpop2014),the U.S. Census Bureau’s American Community Survey, Veterans Benefits Administration (VBA)
administrative data, USVETS, Veterans Health Administration (VHA) administrative data, National Cemetery
Administration (NCA), and data from the Department of Defense (DoD). The reference period for most of the
administrative data is fiscal year 2015.

Demographic Characteristics
• The total population of women Veterans is expected to increase at an average rate of about 18,000 women
  per year for the next 10 years. Women Veterans currently are and will continue to be an important part of the
  Veteran community and an important part of VA.
• Approximately 2 million Veterans in the United States and Puerto Rico were women. Women represented
  about 9.4 percent of the total Veteran population in 2015.
• Twenty-five percent of all living women Veterans served only during peace times. Fifty-six percent of all
  women Veterans have served during the Gulf War Era (August 1990 to the present).
• The median age of women Veterans in 2015 was 50, compared with 46 for non-Veteran women.
• In 2015, 19 percent of women Veterans were African American, compared with 12 percent of non-Veteran
  women. African American women are also overrepresented compared to African American men in the mili-
  tary. In contrast, the percentage of women Veterans who were Hispanic was almost half that of non-Veterans (9
  percent compared with 16 percent). The percentage of women Veterans who were Asian is less than half that
  of non-Veterans (2 percent compared with 5.5 percent).
• Generally, as the percentage of Hispanics in the general population rises, their representation in the military
  rises as well, therefore the percentage of Hispanic women Veterans is expected to increase in the future.
• Women Veterans were more likely to have ever married than non-Veteran women. In 2015, 84 percent of
  women Veterans were currently married, divorced, widowed, or separated compared with 72 percent of non-
  Veteran women.
• In 2015, 23.4 percent of all women Veterans were currently divorced compared with 12.6 percent of non-Veter-
  an women.
• In 2015, 28.6 percent of all women Veterans under the age of 65 had children 17 years old or younger living at
  home, and 29.9 percent of non-Veteran women had children 17 years old or younger living at home.

Socioeconomic Characteristics
• Twenty-one percent of all women Veterans had a high school diploma or less as their highest level of educa-
  tional attainment in 2015, compared with 40 percent of non-Veteran women. To join the military now, candi-
  dates must have a high school diploma or GED, but that requirement has not always been in place.

National Center for Vetereans Analysis and Statistics
                                                 			                              			                           vii
• More women Veterans had some college as their highest level of education compared with non-Veteran wom-
  en (44 percent compared with 32 percent, respectively). Overall, a higher percentage of all women Veterans
  (34.5 percent) than non-Veterans (28.1 percent) had completed a Bachelor’s or advanced degree.
• In 2015, working-age women Veterans (i.e., those 17 to 64 years old) had a higher labor force participation rate
  (71.5 percent) than non-Veteran women (70.1 percent).
• A higher percentage of employed women Veterans 17 to 64 years old worked in the government sector (34
  percent) than non-Veteran women (16 percent).
• Overall, women Veterans were less likely than non-Veteran women to be living in poverty in 2015. About 10
  percent of all women Veterans and 15 percent of all non-Veteran women had incomes below the poverty
  threshold.
• About 4 percent of women Veterans were uninsured in 2015, compared with 9 percent of non-Veteran women.
• About 30 percent of insured women Veterans had more than one type of health insurance coverage in 2015,
  compared with about a 13.9% of non-Veteran women.

Use of VA Benefits and Services
• In 2015, 840,000 women Veterans used at least one VA benefit or service.
• The number of women Veterans who used at least one VA benefit or service has steadily grown from 31.2 per-
  cent in 2005 to 41.1 percent in 2015.
• Nearly 5,900 women Veterans received burial and memorial benefits in 2015. Of those, about 2,400 were
  buried in a VA national cemetery and 3,500 received a headstone or marker for interment in a state or private
  cemetery. In total, about 47,700 women Veterans have been interred in national cemeteries maintained by the
  National Cemetery Administration (NCA) since 1850. An additional 54,500 women Veterans have received a
  headstone or marker for interment in a state, private, or other cemetery since 1850.

Use of VA Health Care Services
• In 2015, 35.9 percent of women Veterans were enrolled in the Veterans Health Administration (VHA) health
  care system. Not all women who enroll in the health care system ultimately become health care users.
• From 2005 to 2015, the number of women Veterans enrolled in VA health care increased 83.9 percent, from
  397,024 to 729,989.
• From 2005 to 2015, the number of women Veterans using VA health care increased 46.4 percent, from 237,952
  to 455,875. To put this in perspective, about 13.1 percent of all women Veterans in 2005 used VA health care
  compared with 22.4 percent of all women Veterans in 2015.

Use of Compensation and Pension Benefits
• In 2015, 405,418 women Veterans received compensation from VA for a service-connected disability, repre-
  senting about 20.1 percent of the total population of women Veterans. Fifty-four percent of women Veterans
  receiving compensation had a combined disability rating of 50 percent or higher.
• The top four primary service-connected conditions for women Veterans (post-traumatic stress disorder, major
  depressive disorder, migraines and lower back pain) accounted for 29.9 percent of all service-connected dis-
  abilities for women Veterans in 2015.
• About 6 percent of women Veterans who received compensation for a service-connected disability were
  receiving Individual Unemployability compensation in 2015. This represents about 1.3 percent of the total
  women Veteran population. Individual Unemployability is a component of VA’s disability compensation ben-
  efit program which allows Veterans to receive financial compensation at the 100-percent level even though
  their total service-connected disability rating is below 100 percent.

  National Center for Veterans Analysis and Statistics                                                       viii
Use of the Vocational Rehabilitation and Education Program
• Roughly 21 percent of Veterans participating in the Vocational Rehabilitation and Education (VR&E) program
  in 2015 were women (27,083 out of 131,607). Participants are defined as Veterans in any of the following
  stages of the vocational rehabilitation process: extended evaluation, independent living, job-ready status, and
  rehabilitation-to-employment.

Use of Education Benefits
• In 2015, 149,375 women Veterans used education benefits. This represented about 7.4 percent of the total
  population of women Veterans. Roughly, 61.2 percent of women Veterans who used education benefits did so
  from age 25 to 34 years old.

National Center for Vetereans Analysis and Statistics
                                                 			                            			                           ix
National Center for Veterans Analysis and Statistics x
Women in Military History

Introduction

Women have formally been a part of the United States Armed Forces since the inception of the Army
Nurse Corps in 1901, but have informally served since the inception of our nation’s military. In 1948,
Congress made women a permanent part of the military service.1 The Women’s Armed Services In-
tegration Act of 1948 limited the proportion of women in the military to 2% of the enlisted force and
10% of officers.2 This limit was repealed in 1967. The end of conscription and the transition to the All-
Volunteer Force in 1973 marked a dramatic increase in the opportunities available for women to serve
in the military. In 2014, there were 200,692 women in the Active component of the U.S. Armed Forces
and 156,180 women in the Reserve and National Guard,3 representing 16.5% of the total military force.
While the proportion of women Veterans is still relatively small, their numbers have been increasing
over the past several decades and are projected to continue increasing into the future. The number of
women Veterans is expected to increase while the overall number of Veterans is expected to decrease.
In 2015, women made up 9.4 percent of the Veteran population, with an expected increase to 16.3
percent by the year 2042.4

What do we know about these women, their post-military outcomes, and their health care needs?
How are they different from their non-Veteran counterparts? This report provides several components
essential to understanding today’s women Veterans, including: historical and contextual information
about women’s military service and subsequent Veteran status, current statistics on demographic and
socioeconomic characteristics of women Veterans, information on the current utilization of the De-
partment of Veterans Affairs (VA) benefits and services by women, and future plans for VA to meet the
challenges of a growing population of women Veterans.

Women have proudly served their country throughout all periods of United States history, whether
disguised as male Soldiers during the American Revolution and Civil War, as nurses in World War I, or
as combat helicopter pilots in Afghanistan (Figure 1 on page 2). It is the extent of their involvement,
degree of militarization, and integration into the services that have changed dramatically over time.

During the American Revolution, women served on the battlefield alongside men, mainly as nurses,
water bearers (“Molly Pitcher” 5), cooks, laundresses, and saboteurs. Despite Army regulations that only
men could enlist, women who wanted to join in the fighting circumvented the rules by masquerading
as young men or boys.6 Several hundred women are estimated to have donned such disguises during
the Civil War. While female spies had become common during the Civil War, by far the most significant
contributions made by women were in the fields of health care and medicine. Despite the remarkable
efforts of these women, military leadership was still not ready to accept them as an integral part of
the military medical service. After the war ended in 1865, the Army returned to using enlisted men for
patient care and the female nurses were sent home.7

As the Army faced an epidemic of typhoid at the outset of the Spanish-American War in 1898, Con-
gress once again authorized the appointment of women as nurses. An estimated 150,000 contract
nurses served between 1898 and 1902 in the United States, overseas, and on the hospital ship Relief.
The nurses who served during the Spanish-American War paved the way for the creation of a perma-
nent corps of nurses in the Army and Navy. In 1901 the Army Nurse Corps (ANC) was established. They

National Center for Vetereans Analysis and Statistics
                                                 			                      			                         1
did not get full pay and rank. The ANC was followed in
1908 by the Navy Nurse Corps.8 The first Navy nurses
were called the Sacred Twenty, shown here on the
steps of the Naval Hospital in Washington, DC, shortly
after their appointment in 1908.9
Figure 1.
Number of Women Who Served and Casualty Counts, by Wartime Period
Military Conflict Dates Number Served1 Casualties2
Spanish-American War 1898-1902 1,500 22
21,480 in the Army Nurse Corps;
April 1917 to November 2,000 in the Navy Nurse Corps,
World War I 12,000 Yeomen(F), 305 Women 500
1918 Marines and 200 in the Army Signal
Corps
September 1940 to July
World War II 400,000 3 400
1947
Korean War June 1950 to January 1955 50,000 2
265,000. The 7,500 women
deployed in theater included 36
women Marines, 421 women in the
Navy, and 771 in the Air Force. The
Vietnam Era August 1964 to May 1975 remaining women were in the Army. 8
Army, Navy and Air Force nurses
accounted for 80 percent of the
total.4
August 1990 to August
Pre-9/11 including Persian Gulf War 374,000 15
2001
In 2015, 700,000 5 women
Post-9/11 including Operation Enduring
September 2001 or later Veterans were Post-9/11 161
Freedom/Operation Iraqi Freedom
only
Source: Note: Statistics on the number of women in the military and casualty counts are difficult to determine. In 2013, 16.2% of the total
military force was women. Approximate numbers of women serving at specific times are listed. The number killed by enemy action was: 4
(WW1); 16 (WW2), and 1 (Vietnam). (Iskra, 2010).
1
Women in Military Service for America Memorial Foundation, “How many women have served in the American military?” https://chnm.gmu.edu/courses/rr/s01/
cw/students/leeann/historyandcollections/history/learnmoreques.htm
2
Source for these numbers vary from the Defense Manpower Data Center, Statistical Abstract of the United States, Congressional Research Service, and other
publications (such as Darlene Iskra’s “Women in the United States Armed Forces,” 2010).
3
Average for year: 1941 (5,000); 1942 (16,000); 1943 (111,000); 1944 (211,000); 1945 (258,000); 1946 (76,000); and 1947 (22,000). Numbers are not mutually exclu-
sive.
4
Number on Active Duty: 1964 (30,000); 1965 (31,000); 1966 (33,000); 1967 (35,000); 1968 (38,000); 1969 (40,000); 1970 (41,000); 1971 (43,000); 1972 (45,000);
1973 (55,000); 1974 (75,000); and 1975 (97,000).
5
In 2015, 200,000 women Veterans served in both Pre-9/11 and Post-9/11 and 500,000 served in Post-9/11 only.
National Center for Veterans Analysis and Statistics 2It was not until World War I that the military implemented a physical examination requirement for
Servicemembers, thus making it impossible for women to continue disguising themselves as men in
order to serve. These new regulations did not keep women from wanting to be part of the war ef-
fort. Altogether, more than 23,000 women nurses in the Army and Navy served on active duty during
the World War I.10 The demands of this war made it necessary to expand the roles of women beyond
nursing in order to free men to fight in combat. Women took over positions as telephone operators
and clerks. In 1917, the Navy announced it would open enlistment to women. About 12,000 female
Yeomen11 entered the Navy and filled a variety of jobs including draftsmen, interpreters, couriers, and
translators. Three hundred and seven women enlisted in the Marine Corps during World War I. Like
their sisters in the Navy, they were limited to the enlisted ranks and worked mainly in Washington, D.C.
doing various administrative jobs.12 Women’s service contributions in World War I showed that they
either had, or could quickly learn, nontraditional skills needed by the military.13
By World War II, the roles of military women were once again greatly expanded to meet the needs of
wartime. During the ramp up of the armed services in 1940 and 1941, nurses were the only military
women to mobilize. As war became imminent, the pressure mounted for the military to reconsider the
role of women. Following Pearl Harbor, Congress authorized new women’s components for each of
the services and increased the number of active duty positions in the Army and Navy Nurse Corps. In
May 1942, the Army was given the authority to establish the Women’s Army Auxiliary Corps (WAAC).
The Navy, Coast Guard, and Marines followed suit, but rather than making women an auxiliary com-
ponent, they opted to enroll them in the reserves on the same basis as their male counterparts. These
decisions by the other services ultimately put pressure on the Army, particularly in terms of recruiting,
to convert the WAAC to full military status. In 1943, WAAC became the Women’s Army Corps (WAC).
Over 5,000 of the 100,000 WACs who served in World War II were assigned to the Southwest Pacific
in such jobs as postal clerks, intelligence analysts, cryptographers, and teletype operators. Another
40,000 WACs were assigned to Army Air Force commands throughout the United States and overseas.
Women in the Marine Reserves served stateside as clerks, cooks, mechanics, and drivers. The Coast
Guard Women’s Reserves, called SPARs (Semper Paratus Always Ready), were assigned to such state-
side jobs as clerks, storekeepers, photographers, cooks, and pharmacist’s mates. In the Navy, thou-
sands of Women Accepted for Voluntary Emergency Service (WAVES) performed a wider range of jobs
than had the Yeomen of World War I. They worked in aviation, medical professions, communications,
intelligence, science, and technology.14 Over 11,000 Navy nurses served at naval shore commands, on
hospital ships, at field hospitals, and in airplanes between 1941 and 1945. Eleven Navy nurses were
held as POWs in the Philippines. They later received the Bronze Star for heroism.15 The Women Air-
force Service Pilots (WASP), though not militarized like the other women’s components, ferried planes
to and from stateside bases and training centers.
At the end of the war in 1945, of the approximately 12 million people remaining in the Armed Forces,
about 280,000 were women.16 There were nearly 100,000 WACs, 86,000 WAVES, 18,000 Women Ma-
rines, 11,000 SPARs, 57,000 Army nurses, and 11,000 Navy nurses prepared for demobilization. The
recruiting of all women, except those with critical skills, came to a halt. With the exception of the two
nurses’ corps, there were no immediate provisions for women in the postwar military.17
It was not until the passage of the Armed Services Integration Act of 1948 that women in addition to
nurses became a permanent part of the U.S. military. However, from the mid-1940s to the early 1970s,
women continued to be restricted to two percent of the military population. It became evident by the
late 1960s that the manpower demands in the Armed Forces needed to be reassessed. The two-per-
cent restriction on women in the military was finally lifted with the 1967 modification to the Women’s
Armed Services Integration Act. This Act also opened senior officer ranks to women.18
National Center for Vetereans Analysis and Statistics
3In 1973, with the end of conscription and the advent of the All-Volunteer Force (AVF), the military
began recruiting more women because there were not enough qualified male volunteers to meet the
manpower needs of a volunteer military.19 At that time, about 45,000 women were serving on active
duty in the four Department of Defense branches of service.20 In 1975, legislation was enacted that
allowed women to be admitted to the three service academies.21 By 1980, the number of women serv-
ing on active duty had increased to 171,000 (8 percent of the active duty force)22 and by 2012 reached
202,876 (about 14.6 percent of the entire active duty force).23 During the mid-1970s when the military
began recruiting women for the AVF, women’s roles in society were also changing with more women
entering into the paid labor market. Within a span of 35 years, from 1970 to 2005, the proportion of
women in the labor force rose from 43 percent to 60 percent. During these three decades, women’s
roles and opportunities were rapidly expanding in both the military and the civilian labor force.24 The
policy changes in the military during this time period led to consistent increases in the number of
women who volunteered to serve.
The early 1990s were a historic time for women in the military with over 40,000 women deploying
in support of the Persian Gulf War, making women Servicemembers more visible in the eyes of the
public. In addition, in 1992 the Defense Authorization Act repealed combat exclusion laws that pre-
vented women from flying combat aircrafts. These large policy changes in women’s participation in
the military did not occur without conflict and challenges. The Tailhook25 convention in 1991, just
prior to the final passage of the 1992 Defense Authorization Bill, remains as one of the largest military
aviation scandals involving a rash of sexual assaults by male officers on women attending the confer-
ence.26 The military’s social, cultural, and political climate towards women was called into question in
the aftermath of the Tailhook scandal, but the tension for women Servicemembers, specifically female
aviators, remained high as opportunities for women in the military continued to expand.
Figure 1a.
Female Active-Duty Military Personnel: 1945 to 2015
Total Women Officer Enlisted
300,000
250,000
200,000
150,000
100,000
50,000
0
1945
1949
1951
1953
1955
1957
1959
1961
1963
1965
1967
1969
1971
1973
1975
1977
1979
1981
1983
1985
1987
1989
1991
1993
1995
1997
1999
2001
2003
2005
2007
2009
2011
2013
2015
Source: Department of Defense, Defense Manpower Data Center, Statistical Information Analysis Division
Prepared by the National Center for Veterans Analysis and Statistics
National Center for Veterans Analysis and Statistics 4In 1994, the policy of combat exclusion that prevented women from serving on combatant ships in
the Navy was lifted, opening the doors for women to be considered for some of the top positions in
the Navy. Four years later in 1998, U.S. women aviators flew combat aircraft on a combat mission for
the first time in history during Operation Desert Fox in Iraq. The 1980s and 1990s were two important
decades where there were significant advances made for women to serve their country. The percent-
age of military positions and occupations open to women increased in all services, allowing women
more diverse choices in their military service. For instance, in 1983 around 21 percent of positions in
the Marine Corps were open to women while in 2003 that number had grown to 62 percent.27 By the
end of the 1990s, significant policy changes had been made toward women’s increased integration
into the military.
Since the tragic events of September 11, 2001 the U.S. military has been involved in Operation Endur-
ing Freedom (OEF) and Operation Iraqi Freedom (OIF) in Afghanistan and Iraq. Women Servicemem-
bers have greatly contributed to these conflicts, representing more than 11 percent of the forces that
have been deployed in support of these operations.28 These operations bring one of the first oppor-
tunities for women to regularly deploy and engage in combat situations with their male counterparts,
making women Servicemembers even more visible within the media and the general public. OEF/OIF
female Veterans represent the largest cohort of women in history who were involved extensively and
actively in combat operations. While women were still excluded from direct combat positions and oc-
cupations, many are in combat support jobs that place them directly in combat situations due to the
blurring of combat and non-combat operations in these regions. Despite the extent of support pro-
vided by women in OEF/OIF, combat exclusions remained a contested topic in the political arena and
in the general public.
One further stride for women came in April 2010, when the Department of the Navy announced that
it had authorized women officers to serve onboard submarines starting in 2011.29 By mid-2012, 25
women had been assigned to submarines30 and in December 2012, three Sailors became the first fe-
male unrestricted line officers to qualify in submarines.31 In August 2015, two women graduated from
the Army’s Ranger School. They were the first two women service members to receive the prestigious
Ranger tab.32
According to the Congressional Research Service, approximately 299,548 female service members
were deployed for contingency operations in Iraq and Afghanistan between September 2001 and Feb-
ruary 2013, over 800 women have been wounded, and over 130 women have died.33 On January 24,
2013 the Secretary of Defense announced the rescission of the 1994 Direct Ground Combat Definition
and Assignment Rule for Women and that the Department of Defense plans to remove gender-based
barriers to service. In making the announcement, it was stated, “The Department of Defense is deter-
mined to successfully integrate women into the remaining restricted occupational fields within our
military,” while adhering to certain guiding principles developed by the Joint Chiefs of Staff.34
This brief historical summary of women’s participation in the U.S. Armed Forces demonstrates the per-
sistence of generations of women who fought against a traditionally male-dominated institution and
paved the way so today’s military women have the privilege of serving their country, not as women,
but as Soldiers, Sailors, Airmen, Marines, and Coast Guardsmen.
National Center for Vetereans Analysis and Statistics
5The History of Women as Veterans Women who have served in the U.S. military are often referred to as “invisible Veterans” because their service contributions until the 1970s went largely unrecognized by politicians, the media, academia, and the general public.35 Because of their quasi-military status, the early female pioneers in the mili- tary volunteered to wear the uniforms, submit themselves to military rules, and risk their lives in service to their country, all without the same benefits and protections of the men with whom they served. Even though women have been officially serving in the military since the creation of the Army Nurse Corps in 1901, they have not always been considered qualified for Veteran status in terms of receiving benefits from the Department of Veterans Affairs (VA). Even after women were granted Veterans status there were still issues of access, exclusion, and improper management of health care. The situation for women improved somewhat after World War I and again after World War II. It was not until well after World War II, however, that women who served in the military began to officially be recognized as Veterans.36 To reduce the possibility of postwar depression brought about by an estimated 15 million discharged male and female service members being unemployed, the National Resources Planning Board, a White House agency, recommended a series of programs for education and training.37 The American Legion then designed the main features of what became the Serviceman’s Readjustment Act of 1944 and pushed it through Congress. The President signed the bill into law on June 22, 1944. The G.I. Bill estab- lished a variety of benefits for World War II Veterans and future generations of Veterans, such as home and business loans, unemployment compensation, and financial support for education and vocational training. The G.I. Bill allowed millions of Veterans to pursue higher education and other training oppor- tunities to which many otherwise would not have had access. The goal of the G.I. Bill was to avoid the mishaps of World War I by giving Veterans greater opportunities to assimilate into civilian life following their military obligation.38 Unlike male Veterans, World War II women Veterans faced barriers in accessing the G.I. Bill many did not know they were eligible for these benefits. In addition, the social and cultural norms after the war discouraged women from the workplace and encouraged them to be focused on their role in the home as mothers, wives, and homemakers.39 Of the estimated 350,000 women Veterans who served in the Armed Forces at that time and were eligible for all GI Bill rights, it is unclear how many women Veterans actually used various parts of the G.I. Bill. One woman Veteran who benefited from the G.I. Bill said, “I first heard about the G.I. Bill when I was being mustered out. They were talking about the advantage of being discharged, because so many of the people were unhappy to be leaving, but at the end of the war, all the women were being dis- charged so I didn’t know if they just thought it would soften the blow or what. But then I realized the G.I. Bill was legitimate, that you could actually go to college and have your tuition and books paid for. Even the fact that you got some extra money didn’t seem to make much of an imprint. But, the fact that you got your tuition and books which is a big item. So that was my plan to use that. Without the G.I. Bill I couldn’t have possibly had a college degree.” 40Many other women Veterans, however, were unaware of their eligibility or made no claim to it even if they went to school.41 National Center for Veterans Analysis and Statistics 6
The establishment of the G.I. Bill in 1944 was fundamental in creating education benefits for those
who have served this nation, a goal that continues as a high priority today.42 Since 1944, Congress has
continued to create education programs in order to reflect the changing times of service and to better
serve the needs of current Veterans. After the establishment of the All-Volunteer Force in 1973, the G.I.
Bill transformed from a reward for fulfilling obligated service to an incentive for voluntary service. The
current generation of women Veterans is more aware of their Veteran status and the range of benefits
they are entitled to, including education benefits under the G.I. Bill.

In the late 1970s and early 1980s many of the contributions made by women in World War II (such as
WAACs, WACs, WAVES, and WASPs) were formally recognized through laws that granted these women
with Veteran status for their time in service.43 This opened the doors for women to take advantage
of programs, opportunities, and benefits from the Federal and state governments, including VA, and
Veteran service organizations. Women’s official recognition as Veterans did not equate with easy or
guaranteed access to these benefits. Women Veterans still grappled with obtaining needed-services
from institutions that were built around and dominated by males.

Data on women who served in the military were scarce in the decades after World War II. The 1980 de-
cennial census marked the first time that information on women Veterans was ever captured in a large
national survey. Prior to 1980, the census questionnaire only asked about the military service of men.
At the time of the 1980 decennial census, women made up just over 2 percent of the Veteran popula-
tion. Today, that proportion has increased to over 9 percent.44

Throughout the 1980s and 1990s, the Federal government and especially VA began to take actions to
understand how they could better serve women Veterans. A 1982 report from the General Account-
ing Office (GAO) attempted to identify actions to ensure that women Veterans had equal access to VA
benefits. Their results indicated that: (1) women did not have equal access to VA benefits, (2) women
treated in VA facilities did not receive complete physical examinations, (3) VA was not providing gyne-
cological care, and (4) women Veterans were not adequately informed of their benefits under the law.
Many women at this time were unaware that they even had access to VA benefits. A study done in
1985 by VA found that 57 percent of women Veterans who were eligible for VA benefits did not know
that they were eligible.45

The Advisory Committee on Women Veterans (ACWV) was established and chartered in 1983 (by
Public Law 98-160). The ACWV was created to assess the needs of women Veterans, with respect to
VA programs such as compensation, rehabilitation, outreach, and health care. The Committee reviews
VA’s programs, activities, research projects, and other initiatives designed to meet the needs of women
Veterans; provides advice and makes recommendations to the Secretary of Veterans Affairs, on ways
to improve, modify, and affect change in programs and services for women Veterans; and follows up
on all those recommendations.46 The ACWV submits a report to the Secretary of Veterans Affairs and
Congress every two years.

In 1991, Congress tasked the GAO to follow up on their 1982 report by assessing the then-current
state of VA health care for women. Based on GAO recommendations in their 1992 report entitled “VA
HEALTH CARE FOR WOMEN: Despite Progress, Improvements Needed”,47 VA worked to ensure greater
accessibility for women’s health and allowed treatment for PTSD to include care for sexual trauma as-
sociated with military duty.48

Recognizing that not all Veterans who were eligible to use health care services and other readjustment
benefits were taking advantage of the programs, Congress passed legislation to create specific offices
within VA to address the concerns of these groups. In 1991, VA created the position of Chief Minority

National Center for Vetereans Analysis and Statistics
                                                 			                       			                         7
Affairs Officer (CMAO) that defined Veteran minority group members as Asian, Black, Hispanic, Ameri- can Indian or Alaska Native, Pacific Islander, or female. In 1993, the Secretary of Veterans Affairs sepa- rated the CMAO’s responsibilities into two different programs to address specific needs: the Women Veterans’ Program Office and the Minority Veterans’ Program Office.49 One year later, in November 1994, Public Law 103-446 established the Center for Women Veterans (CWV) to oversee VA’s administration of health care and benefits services for women as well as pro- grams for women Veterans. The Center’s current mission is to “monitor and coordinate VA’s administra- tion of health care and benefits services, and programs for women Veterans, serve as an advocate for a cultural transformation (both within VA and in the general public) in recognizing the service and con- tributions of women Veterans and women in the military, and raise awareness of the responsibility to treat women Veterans with dignity and respect.”50 The Director of the Center for Women Veterans is the primary advisor to the Secretary of Veterans Affairs on all matters relating to women Veterans, includ- ing policies, legislation, programs, issues, and initiatives. The Director is also the Designated Federal Officer for the Advisory Committee on Women Veterans. The Center for Women Veterans held first Na- tional Summit on Women Veterans Issues in Washington, D.C., in 1996, which created the opportunity for greater communication between women Veterans, policymakers, and VA.51 In 2000, for the first time, VA allocated funds ($3 million) to support programs specifically for women Veterans who were homeless. Three-year demonstration programs were designed at 11 locations across the country. In the same year, the Veterans Benefits and Health Care Improvement Act of 2000, PL 106-419, authorized Special Monthly Compensation (SMC) for women Veterans with a service-con- nected hysterectomy and/or mastectomy or loss of creative organ. Additionally, it provided benefits for children with birth defects born to women Vietnam Veterans. Over the past 40 years, the Veterans Health Administration (VHA) has introduced initiatives designed to improve health care access and quality of care for women Veterans. In 2008, VHA’s Women Veterans Health Strategic Health Care Group (WVHSHG) began a five-year plan to redesign the nation health care delivery system for women. A fundamental component of this plan was ensuring all women Veterans had access to comprehensive primary care from skilled women’s health providers.52 Another major part of this redesign was identifying the need for detailed data on women Veterans that could be used to inform policy and planning. The WVHSHG partnered with the Center for Health Care Evalu- ation at the VA Palo Alto Health Care System to develop the first in a series of VHA Sourcebooks to describe the characteristics of women Veteran VHA patients and their health care. Several highlights from Volume III of the VHA Sourcebook are presented in this report (see the section titled ‘Utilization of the Department of Veterans Affairs Benefits and Services’). In late 2009, The Department of Veterans Affairs has made ending homelessness for Veterans a stra- tegic initiative and offers several programs for homeless Veterans. It was unclear whether these pro- grams have the capacity to meet the housing needs of all homeless women Veterans and their fami- lies. In 2011, GAO investigated the homelessness of women Veterans and found that they face barriers when accessing and using Veteran housing, including lack of awareness of these programs, lack of referrals for temporary housing while awaiting placement in housing, limited housing for women and children, and concerns about personal safety.53 One Homeless woman Veteran stated, “I found myself sleeping out there on the streets…If it wasn’t for a couple of Veterans that were out there that told me about this place, I’d still be out there…I was stopped by a couple of cops. They said…there are lots of places for Veterans. I asked where; they couldn’t tell me.”54 VA concurred with GAO’s recommendations. National Center for Veterans Analysis and Statistics 8
Both the services required by women Veterans and the issues they face after their return to civilian life
are different than those of their male counterparts. The changing demographics of the women enter-
ing, and ultimately leaving, the Armed Forces also have an impact on the kinds of services they will
require in the future.55 As more and more women move into the ranks of Veterans, it becomes impor-
tant to investigate their post-military outcomes. Who are women Veterans and how are they different
from their non-Veteran counterparts? How do women Veterans use the benefits and services provided
by VA? Finally, what future challenges does VA face when it comes to women Veterans?

  National Center for Veterans Analysis and Statistics                                                9
Today’s Women Veteran

     About the Veteran Data

     Data for veteran population comes from two sources.

     VetPop Data for this section of the report come from the 6th generation Veteran Popula-
     tion Projection Model 2014 (VetPop2014) that provides Veteran population projection
     from fiscal year 2014 to 2043. This model is developed by the Data Governance and Analyt-
     ics (DGA) of VA. Using the best available Veteran data by the end of FY2013, VetPop2014
     provides living Veteran counts by key demographic characteristics such as age, gender,
     period of service, and race/ethnicity at various geographic levels. VetPop data includes
     Veterans residing in states, US territories and foreign countries. VetPop2014 is a bottom‐up
     model which projects future Veteran population at the county level as a starting point.
     The county‐level projections are then aggregated to provide Veteran information at larger
     geographic units such as congressional districts, states, and at the national level. The Vet-
     Pop2014 actuarial model uses both Veteran record‐level data and survey data from a wide
     variety of sources including VA, Department of Defense (DOD), U.S. Census Bureau’s Ameri-
     can Community Survey (ACS), Department of Treasury’s Internal Revenue Service (IRS), and
     the Social Security Administration (SSA). For more information about the Vetpop2014, see
     http://www1.va.gov/vetdata/Veteran_Population.asp.

     U.S. Veterans Eligibility Trends and Statistics (USVETS) dataset is developed by the
     Data Governance and Analytics of VA. USVETS is a data environment consisting mainly
     of data sources from VA programs and the Defense Manpower Data Center. This dataset
     contains information about individual Veterans including demographics, details of military
     service, VA benefit usage, and more. USVETS data includes Veterans residing in states, US
     territories and foreign countries. This Veteran dataset contains one record per Veteran. It
     includes all living and deceased Veterans that DGA have accumulated through VA, Depart-
     ment of Defense (DoD) and commercial data sources. This data environment is used by
     the VA Office of Policy and Planning to conduct statistical analysis, predictive modeling,
     and reporting.

Women serve in every branch of the military, representing 15.5 percent of active duty military and
19.0 percent of National Guard and Reserve forces in 2015.56 The total Veteran population in 2015
was about 21.7 million Veterans. About 2 million or 9.4 percent of the total Veteran population were
women Veterans. Women are now the fastest growing cohort within the Veteran community. Figure
2 shows the percent increase in women Veterans from 2000 to 2040. The percent of Veteran who are
women is projected to increase to about sixteen percent of the total Veteran population in 2040 from
six percent in 2000. The overall Veteran population is decreasing at a rate of about 1.5% per year, and
the women Veteran population is increasing at a rate of 1% per year.

  National Center for Veterans Analysis and Statistics                                               10
Figure 2.
Women Veterans as a Percent of the Veteran Population
15.9
14.6
13.2
11.8
10.5
9.4
8.3
7.1
6
2000 2005 2010 2015 2020 2025 2030 2035 2040
Source: U.S. Census Bureau, American Community Survey, Public Use Microdata Sample, 2015
Prepared by the National Center for Veterans Analysis and Statistics
Demographic Indicators
About the Data
Data for this section of the report come from the 2014 American Community Survey conducted by the U.S.
Census Bureau.
The American Community Survey (ACS) is an ongoing annual survey conducted in every county
across the nation, including every municipio in Puerto Rico. ACS does not include Veterans and
non-Veterans residing in other US territories and foreign countries. The ACS is the largest survey in
the United States with a sample of about 3 million household addresses each year. The ACS collects
essentially the same detailed demographic, social, economic, and housing information previously
collected every ten years on the decennial census long-form questionnaire. Data for the ACS are
collected continuously throughout the year using three modes of collection: mail, telephone, and
personal visit. Interviews conducted between January 1st and December 31st of a given year are
aggregated to produce annual estimates for that calendar year. Since 2006, the ACS sample has in-
cluded the resident population living in both housing units and group quarters. Group quarters in-
clude institutional group quarters (e.g., nursing homes, correctional facilities, psychiatric hospitals)
and non-institutional group quarters (e.g., college dormitories, military barracks, group homes).
For more information about the ACS, see: http://census.gov/programs-surveys/acs/about.htm
National Center for Veterans Analysis and Statistics 11Women Veterans are a diverse group and they differ in many ways from their counterparts who never served
in the military. Data from the 2015 American Community Survey (ACS) provide an in-depth profile of demo-
graphic and socioeconomic characteristics of the approximately 1.6 million women Veterans living in the
U.S. and Puerto Rico today.57 A complete table of the detailed characteristics from the ACS can be found in
Appendix E to this report.
Period of Military Service
Most women Veterans alive today served only during Post-9/11 period of military service or September 2001
to Present (Figure 3). Over 55% of women Veterans served during the Gulf War Era (August 1990 to Present).
Roughly 25% of women Veterans served only in peacetime. The largest peacetime period since the advent of
the All-Volunteer Force (AVF) was from May 1975 to July 1990.
Figure 3.
Distribution of Women Veterans, by Period of Military Service: 2015
(in percent)
Post-9/11 33.2
Pre-9/11 23.3
Vietnam Era 13.1
Korean War 3.0
World War II 2.5
Peacetime only 24.9
Source: U.S. Census Bureau, American Community Survey, Public Use Microdata Sample, 2015
Prepared by the National Center for Veterans Analysis and Statistics
Age
On average, women Veterans were older than non-Veteran women in 2015. The median age of women Vet-
erans was 50 compared with 46 for their non-Veteran counterparts. A higher percent of women Veterans are
between 35 to 64 years old than women non-Veterans (Figure 4). Women who entered the military between
1979 and 1984 at the typical age of 18 would have been between 48 and 54 years old in 2015. Figure 4 also
shows that the youngest women (17 to 24 years old) have not yet become Veterans since these are the ages
that most people are serving in the military.
National Center for Veterans Analysis and Statistics 12Figure 4.
Age Distribution of Women, by Veteran Status: 2015
Veteran Non-Veteran
23.5
21.2
17.7
16.8 16.8
16 16.3
15.9
13.5
11.4
9.3
6.2
5.1
3.4 3.7
3.1
17-24 years 25-34 years 35-44 years 45-54 years 55-64 years 65-74 years 75-84 years 85+ years
Source: U.S. Census Bureau, American Community Survey, Public Use Microdata Sample, 2015
Prepared by the National Center for Veterans Analysis and Statistics
National Center for Veterans Analysis and Statistics 13Race and Hispanic Origin
In 2015, a higher percentage of women Veterans than non-Veterans were Black or African American
non-Hispanic (19 percent compared with 12 percent). The racial composition of women in the mili-
tary explains some of these differences. In contrast, the percentage of women Veterans who were
Hispanic was a little more than half that of non-Veterans (9 percent compared with 16 percent).
Figure 5.
Race and Ethnicity of Women, by Veterans Status: 2015
(in percent)
Veteran Non-Veteran
65.9
63.3
25.1
20.4
16.2
9.1
Non-Minority Non-Hispanic Minority Hispanic
Source: U.S. Census Bureau, American Community Survey, Public Use Microdata Sample, 2015
Prepared by the National Center for Veterans Analysis and Statisticcs
National Center for Veterans Analysis and Statistics 14Figure 6.
Distribution of Women, by Minority and Veteran Status: 2015
Veteran Non-Veteran
65.9
63.3
19.0
16.2
12.2
9.1
5.7
2.0 2.6
0.9 0.6 1.6
0.4 0.1 0.2 0.2
Black/African American Asian Native Some Other Two or More Hispanic White
American Indian and Hawaiian and Race races
Alaskan Native Other Pacific
Islander
Source: U.S. Census Bureau, American Community Survey, Public Use Microdata Sample, 2015
Prepared by the National Center for Veterans Analysis and Statisticcs
Marriage and Divorce
Women Veterans were more likely to have ever married than non-Veteran women. In 2015, 84 per-
cent of women Veterans were currently married, divorced, widowed, or separated compared with 72
percent of non-Veteran women.
The differences in marital status were even more striking by age. For the women Veterans who do
marry, they appear to do so at younger ages than non-Veteran women (Figure 7). Thirty percent of
17- to 24-year-old women Veterans were currently married, compared with only 8 percent of non-
Veteran women of the same ages. Higher percentages of non-Veteran women age 35 to 74 years old
were married compared with women Veterans of the same ages. The rates for non-Veteran women re-
flect the norm in delaying marriage to later ages among the general population. According to the U.S.
Census Bureau, the median age at first marriage was around 27.1 for women in 2015.58 This represents
a continuation of a long-term trend that has been noted since the mid-1950s.
National Center for Veterans Analysis and Statistics 15You can also read


