ASSESSING THE EFFECTS OF COVID-19 ON ACCESS TO WATER, SANITATION, AND HYGIENE IN USAID HIGH PRIORITY AND STRATEGY-ALIGNED COUNTRIES
←
→
Page content transcription
If your browser does not render page correctly, please read the page content below
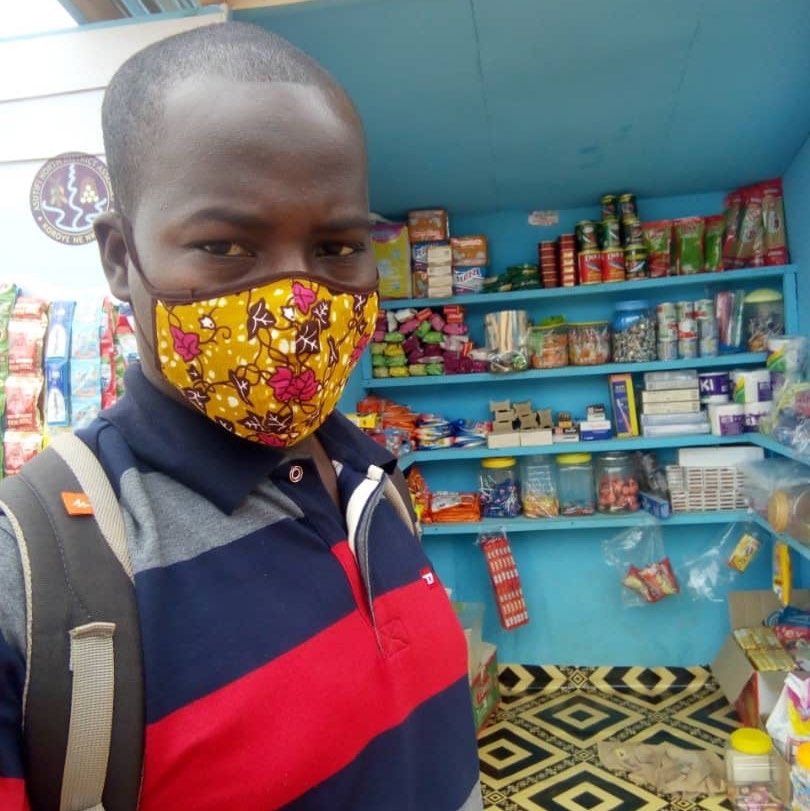
ASSESSING THE EFFECTS OF COVID-19
 ON ACCESS TO WATER, SANITATION,
 AND HYGIENE IN USAID HIGH PRIORITY
 AND STRATEGY-ALIGNED COUNTRIES
 Synthesis Report

 Photo credit: Bashiru Yachori, 2020.

DECEMBER 2020
This publication was produced for review by the United States Agency for
International Development. It was prepared by Tetra Tech.
ACKNOWLEDGEMENTS
Jeff Albert (Aquaya) managed this task, with additional conception and design input by Ranjiv Khush (Aquaya), Rishi
Agarwal (FSG), Aditi Krishna (Iris Group), and Morris Israel (Tetra Tech). Deep dives, including identification of
and interviews with key informants, were led by Miriam Otoo (Tetra Tech), Maneshka Eliatamby and Prakash Luitel
(Iris Group), Subhash Chennuri, Harshika Gupta, Akshay Kohli, and Mahesh Nayak (FSG), Brian Mwangi, Chloé
Poulin, and Edinah Samuel (Aquaya).
David Levine (Haas School of Business, University of California Berkeley) and Xinyu Ren conducted the
econometric analysis, building on research by Marc Jeuland (Duke University), David Fuente (University of South
Carolina), Dale Whittington (UNC Chapel Hill), Maura Allaire (UC Irvine), and Semra Ozdemir (Duke University).
GeoPoll executed the SMS surveys across six countries, and Rick Johnston of the World Health Organization (and
UNICEF/WHO’s Joint Monitoring Program) provided invaluable feedback on our survey instrument.
USAID Mission staff in seven countries agreed to participate in and support this work via informed guidance and
introductions to key informants. We extend our appreciation to Abdoulaye Boly (Dakar), Bindi Borg (Kathmandu),
Pape Dieye (Dakar), Clara Dimene (Maputo), Leonor Domingos (Maputo), Arvil Gonzalez (Dakar), Emmanuel
Odotei (Accra), Nicole Mukunzi (Kigali), Sandy Ngilambi (Kinshasa), Carrie Rasmussen (Kathmandu), Amanda
Robertson (Nairobi), Deepana Shanthan (Kathmandu), Pragya Shrestha (Kathmandu), and Erica Trauba (Dakar).
This research would not have been possible without the generous time and insights of over 300 government
officials, service providers, service provider associations, and private sector actors across DRC, Ghana, Kenya,
Mozambique, Nepal, Rwanda, and Senegal.
A number of USAID WASH programs provided key information and analysis. We highlight in particular the Water,
Sanitation, and Hygiene Finance (WASH-FIN) centrally-funded program as well as the WASH for Health (W4H)
program in Ghana. Other programs include: ACCES (Senegal), Gikuriru (Rwanda), Isuku Iwacu (Rwanda), KIWASH
(Kenya), Safaa Paani (Nepal), and TAYAR (Nepal).
UNICEF has also been a source of important information and perspective, and we wish to thank Carrie Kramer in
Mozambique, the UNICEF WASH team in Ghana, and Rebecca Rydberg at the Global WASH Cluster (GWC) for
their invaluable time and expertise.
Greg Allgood of World Vision and Antoinette Kome of SNV provided key introductions – we thank you.
Finally, we thank Elizabeth Jordan, Alison Macalady, Jesse Shapiro, Brian Banks, and Ryan Mahoney of USAID for
the close and enriching attention they have afforded the work.
Prepared for the United States Agency for International Development by the Water, Sanitation, and Hygiene
Partnerships and Learning for Sustainability (WASHPaLS) project under Task Order number AID-OAA-TO-16-
00016 of the Water and Development Indefinite Delivery Indefinite Quantity Contract (WADI), contract number
AID-OAA-I-14-00068.
Tetra Tech Contacts: Morris Israel, Project Director
 morris.israel@washpals.org
 Jeff Albert, Deputy Project Director
 jeff.albert@washpals.org
 Lucia Henry, Project Manager
 lucia.henry@tetratech.com

 Tetra Tech
 1320 N. Courthouse Road, Suite 600, Arlington VA 22201
 Tel: 703-387-2100 Fax: 703-414-5593
 www.tetratech.com/intdev
Assessing the Effects of COVID-19 on
Access to Water, Sanitation, and
Hygiene in USAID High Priority and
Strategy-Aligned Countries
Synthesis Report

DECEMBER 2020

DISCLAIMER
The author’s views expressed in this publication do not necessarily reflect the views of the
United States Agency for International Development or the United States Government.
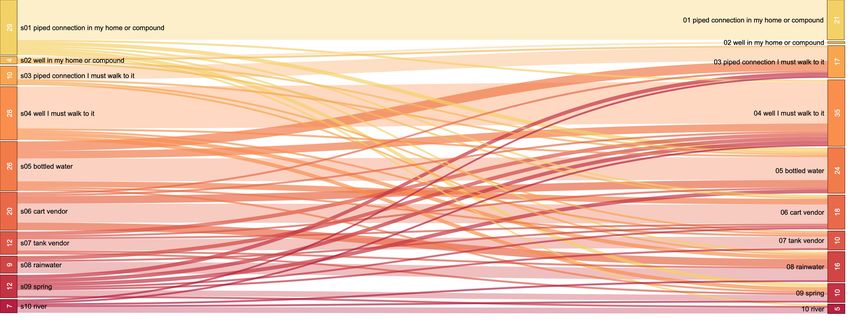
TABLE OF CONTENTS
LIST OF FIGURES ........................................................................................................................ ii
LIST OF TABLES ......................................................................................................................... iii
ACRONYMS AND ABBREVIATIONS .......................................................................................iv
EXECUTIVE SUMMARY..............................................................................................................vi
1.0 INTRODUCTION .................................................................................................................. 1
2.0 METHODS .............................................................................................................................. 3
 2.1 DEEP DIVES ......................................................................................................................................................... 3
 2.2 ECONOMETRIC MODEL FOR FORECASTING CHANGES IN ACCESS TO WASH SERVICES ........................ 5
3.0 GOVERNMENT RESPONSE IN DEEP-DIVE COUNTRIES AND REPORTED
 ECONOMIC DISTRESS ........................................................................................................ 6
4.0 DEEP DIVE RESULTS: DRINKING WATER ...................................................................... 9
 4.1 THE CONSUMER SIDE........................................................................................................................................ 9
 4.2 THE SUPPLIER SIDE – CURRENT STATUS ...................................................................................................... 11
 4.2.1 Large providers .................................................................................................................................. 12
 4.2.2 Small providers ................................................................................................................................... 12
 4.2.3 Supply chain issues............................................................................................................................. 13
 4.2.4 Donor response ................................................................................................................................. 14
5.0 DEEP DIVE RESULTS: SANITATION .............................................................................. 16
 5.1 THE CONSUMER SIDE...................................................................................................................................... 16
 5.2 THE SUPPLIER SIDE – CURRENT STATUS ...................................................................................................... 17
 5.2.1 Fecal Sludge Management ................................................................................................................ 17
 5.2.2 Household Sanitation ........................................................................................................................ 18
6.0 DEEP DIVE RESULTS: HANDWASHING ....................................................................... 21
 6.1 THE CONSUMER SIDE...................................................................................................................................... 21
 6.2 THE SUPPLIER SIDE – CURRENT STATUS ...................................................................................................... 22
 6.3 VARIATIONS IN REPORTED ACCESS AND PRICE TRENDS ............................................................................ 23
7.0 SUMMARY OF ECONOMETRIC MODEL RESULTS ...................................................... 25
8.0 FUTURE WASH ACCESS TRENDS IN HIGH-PRIORITY AND STRATEGY ALIGNED
 COUNTRIES ........................................................................................................................ 27
 8.1 WATER SUPPLY ................................................................................................................................................ 27
 8.2 SANITATION ..................................................................................................................................................... 28
 8.3 HANDWASHING .............................................................................................................................................. 29
REFERENCES .............................................................................................................................. 30
APPENDIX 1. KEY INFORMANT LISTS ................................................................................. 32
APPENDIX 2. SMS SURVEY INSTRUMENT .......................................................................... 37
APPENDIX 3. ECONOMETRIC MODEL ................................................................................. 42
APPENDIX 4: SANKEY DIAGRAMS FROM SMS SURVEYS ................................................ 54

EFFECTS OF COVID-19 ON ACCESS TO WASH | SYNTHESIS REPORT i
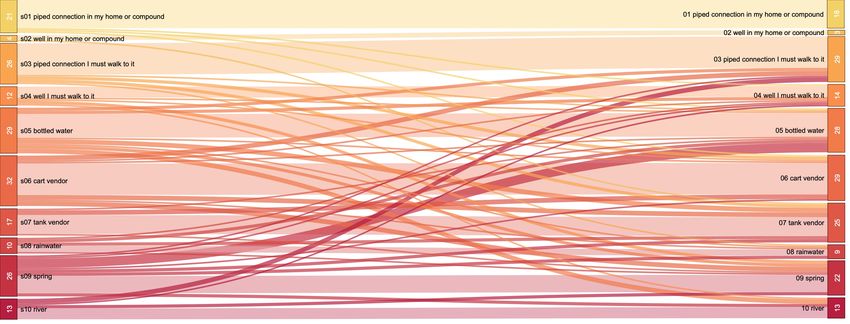
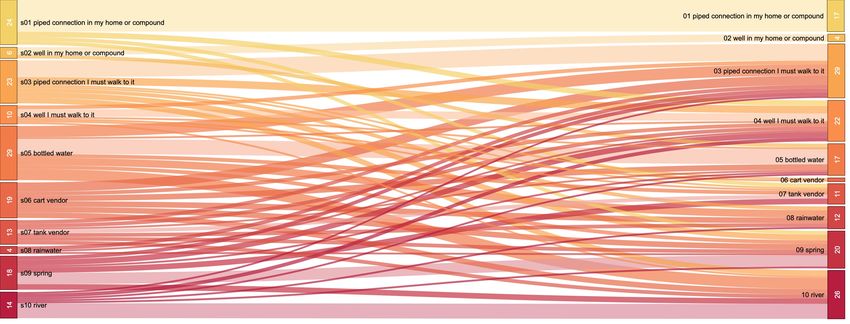
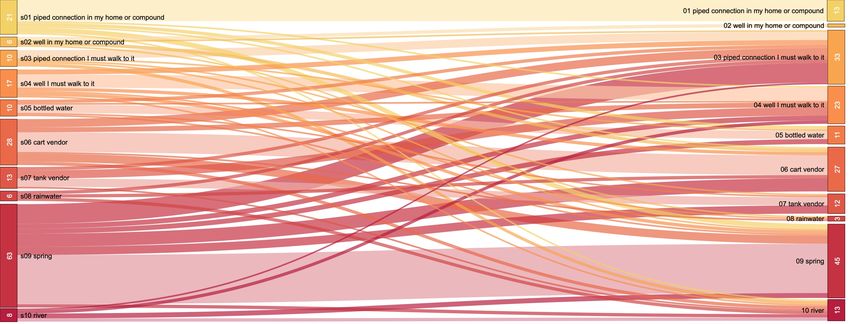
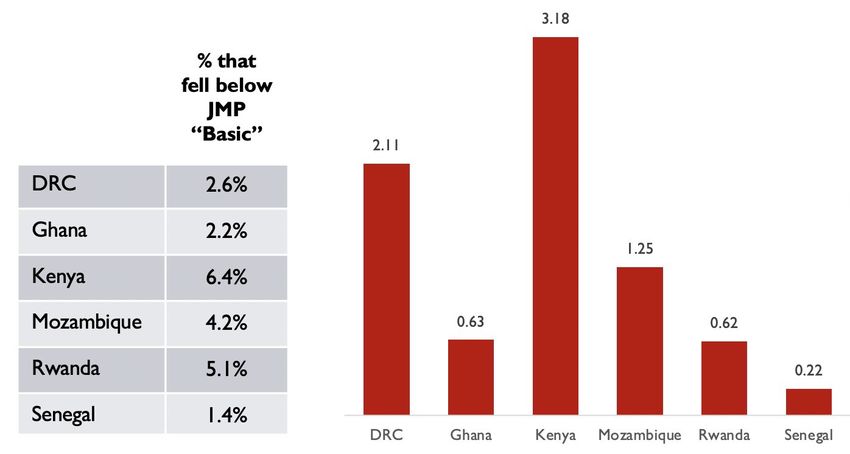
LIST OF FIGURES
Figure 1. Highlighted countries are USAID high priority and strategy-aligned countries, with the deep-dive
 countries in green. .....................................................................................................................................................................3
Figure 2. Percent departure from baseline mobile phone mobility, residential category, February to early October
 2020. Periods of the SMS surveys and deep-dive interviews are noted. There are no mobility data available for
 DRC. Source: Google COVID-19 Community Mobility Reports (Google, 2020). .....................................................6
Figure 3. Percentage of respondents answering, “I lost my job” or “I earn less money” to the question, “How has
 COVID-19 changed your employment?” ..............................................................................................................................7
Figure 4. Percentage of respondents answering “Yes” to the question, “Has COVID-19 made it more difficult to
 get your drinking water?” .........................................................................................................................................................9
Figure 5. Heat map depicting percentage point changes in reported water service modality, pre-COVID-19 vs. at
 present, among those responding “Yes” to the question, “Has COVID-19 made it more difficult to get your
 drinking water?”....................................................................................................................................................................... 10
Figure 6. At left, percentages of respondents (N=500+ respondents); at right, estimated populations in millions of
 each country falling below Basic service levels on the JMP Water Ladder. ............................................................... 11
Figure 7. Indicators of sanitation service difficulties reported by respondents to the team’s SMS surveys. N = 500+
 participants per country. ....................................................................................................................................................... 16
Figure 8. Heat map depicting percentage point changes in reported sanitation level, pre-COVID-19 vs. at present.
 Magnitude of change is captured both by the color and the number in a particular cell. For example, the
 proportion of urban Rwandan respondents to who reported reliance on a public community toilet dropped
 by 5 percentage points, and those reporting reliance on a shared household toilet increased by 7 percentage
 points.......................................................................................................................................................................................... 17
Figure 9. SMS survey response to the question, “Do you notice your neighbors and friends washing their hands
 with soap more often than before COVID-19?” ............................................................................................................. 21
Figure 10. Percentage of the respondents listing “washing hands” in response to the question, “What measures
 have you taken to prevent infection from COVID-19 in the past week?” in the MIT COVID-19 Beliefs,
 Behaviors & Norms Survey. X-axis labels correspond to two-week long survey waves for 11 countries.
 Source: MIT Initiative on the Digital Economy and Facebook, 2020........................................................................... 22
Figure 11. SMS survey response to the question, “Since COVID arrived, has it become easier or more difficult for
 your family to obtain any kind of soap to wash hands?” ................................................................................................ 23
Figure 12. Prices of selected non-food items, reported by households contacted as part of the Kenya COVID-19
 Economic Tracker. .................................................................................................................................................................. 24
Figure 13. Results of Model 1 for sanitation – the effect size per country examining wealth effects only................... 26
Figure 14. Distribution of 30 Mozambican small private water providers interviewed in August 2020. ...................... 34
Figure 15. The UNICEF/WHO Joint Monitoring Program (JMP) water service ladder. ................................................... 42
Figure 16. Water supply numeric score as a function of wealth quintile for the seven deep-dive countries. ............. 48
Figure 17. Kenya Sankey diagram. ................................................................................................................................................. 54
Figure 18. Rwanda Sankey diagram. .............................................................................................................................................. 55
Figure 19. Ghana Sankey diagram. ................................................................................................................................................. 56
Figure 20. DRC Sankey diagram. ................................................................................................................................................... 57
Figure 21. Mozambique Sankey diagram. ..................................................................................................................................... 58
Figure 22. Senegal Sankey diagram. ............................................................................................................................................... 59

EFFECTS OF COVID-19 ON ACCESS TO WASH | SYNTHESIS REPORT ii
LIST OF TABLES
Table 1. Pre-Specified Hypotheses ...................................................................................................................................................2
Table 2. JMP Level and model numeric score associated with a MICS/DHS water supply category. ............................ 43
Table 3. JMP Level and model numeric score associated with a MICS/DHS sanitation category................................... 43
Table 4. Model datasets employed for high priority and strategy-aligned countries. ........................................................ 44
Table 5. Model coefficients and effect sizes for all USAID high priority and strategy-aligned countries. ..................... 46
Table 6. Model coefficients from the analyzed countries (27 for water and 28 for sanitation). ..................................... 47
Table 7. World Bank forecast GDP growth for USAID high-priority and strategy-aligned countries (as of 8 June
 2020) .......................................................................................................................................................................................... 49
Table 8. Estimated decline in water and sanitation access (based on estimates from DHS or MICS cross section
 multiplied by World Bank estimates of income changes). ............................................................................................. 52
Table 9. Estimates of population dropping below JMP “Basic” service levels for water and sanitation. Deep-dive
 countries are highlighted in gray. ......................................................................................................................................... 53

EFFECTS OF COVID-19 ON ACCESS TO WASH | SYNTHESIS REPORT iii
ACRONYMS AND ABBREVIATIONS
AFD Agence Française de Développement (French Development Agency)
COVID-19 Coronavirus Disease 2019
CRS Catholic Relief Services

DHS Demographic and Health Survey
DRC Democratic Republic of the Congo
FEPEAR Forum des Exploitants Privés des Systemes d’Eau er Assainissement (Association of Private
 Water and Sanitation System Operators [Rwanda])
FIPAG Fundo de Investimento e Património do Abastecimento de Água (Water Supply Assets and
 Investment Fund [Mozambique])
FPA Fornecedor Privado da Água (Private Water Provider [Mozambique])
GDP Gross Domestic Product
GWC Global WASH Cluster
HDPE High Density Polyethylene
HH Household
ICRC International Committee of the Red Cross
IMF International Monetary Fund
JICA Japan International Cooperation Agency
JMP Joint Monitoring Programme of WHO and UNICEF
KfW Kreditanstalt für Wiederaufbau (German state-owned development bank)
LIA Low-Income Area
MAWASCO Mathira Water and Sanitation Company (Kenya)
MICS Multiple Indicator Cluster Survey
MIS Malaria Indicator Survey
NGO Nongovernmental Organization
NYEWASO Nyeri Water Services Company (Kenya)
OD Open Defecation
REGIDESO Régie de distribution d’eau (Water Distribution Board [DRC])
SINAS Sistema de Informação Nacional de Água e Saneamento (Mozambique)
SME Small-to-Medium-Sized Enterprise
SMS Short Message Service (Text Message)

EFFECTS OF COVID-19 ON ACCESS TO WASH | SYNTHESIS REPORT iv
SWA Sanitation and Water for All
THIWASCO Thika Water and Sewerage Company (Kenya)
USAID United States Agency for International Development
WASAC Water and Sanitation Corporation (Rwanda)
WASH Water, Sanitation, and Hygiene
WASH-FIN Water, Sanitation, and Hygiene Finance program of USAID
WASHPaLS Water, Sanitation, and Hygiene Partnerships and Learning for Sustainability Project
WASREB Water Services Regulatory Board (Kenya)
WHO World Health Organization
WSP Water Service Provider
WSPA Water Service Provider Association (Kenya)
WSTF Water Sector Trust Fund
WSUP Water and Sanitation for the Urban Poor

EFFECTS OF COVID-19 ON ACCESS TO WASH | SYNTHESIS REPORT v
EXECUTIVE SUMMARY
In May 2020, the United States Agency for International Development (USAID) tasked the Water,
Sanitation, and Hygiene Partnerships and Learning for Sustainability (WASHPaLS) project with assessing
the effects of the novel Coronavirus Disease 2019 (COVID-19) on access to water, sanitation, and
hygiene (WASH) services and products in USAID high-priority and strategy-aligned countries. 1 The
assignment sought to characterize the current state of affairs and to forecast near-term (6–18 month)
trends that could assist governments, donors, and implementers prepare an informed response to the
WASH-related impacts of the pandemic.
The assessment team pursued two lines of inquiry. The first is a set of “deep dives” in seven countries
(the Democratic Republic of the Congo [DRC], Ghana, Kenya, Mozambique, Nepal, Rwanda, and
Senegal) selected to reflect a spectrum of geographic, cultural, and vulnerability characteristics. These
deep dives consisted of interviews with key informants (WASH product and service providers,
government officials, donors, and WASH program implementers) as well as SMS-based surveys of over
3,000 randomly selected individuals in all countries save Nepal. The second line of inquiry is
development of an econometric model linking income changes to WASH outcomes, relying on
Demographic and Health Survey (DHS) and Multiple Indicator Cluster Survey (MICS) information,
constructed using data from the 28 USAID high-priority and strategy-aligned countries, to generate
WASH outcome forecasts for those same countries.
This document represents the synthesis of that work, carried out by the WASHPaLS team between June
and October 2020. Detailed findings for each of the seven deep-dive countries are presented in separate
reports. The team’s topline findings, by subsector, are as follows:

WATER SUPPLY – CURRENT STATUS
1) COVID-19 has made water access more difficult for consumers—significantly more
difficult than would be expected based only on cross-sectional correlations between
income and water service level. Declines in water access are linked not only to economic shocks
borne by consumers but also to financial pressures endured by water service providers (WSPs) as they
suffer revenue shortfalls, which are a function of both government directives for free water provision
and tariff collection difficulties. These consumer reports of pandemic-related water access difficulties
exceed what is predicted based on the statistical relationship the assessment team measured between
income and water supply outcomes using DHS and MICS data.
2) COVID-19-driven water access difficulties are reported across the urban-to-rural
spectrum. Cumulatively across six countries in which the team conducted SMS surveys, roughly one-
third of both urban and rural respondents reported that the pandemic had made accessing drinking
water more difficult. There was no consistency across countries as to whether urban or rural dwellers
were impacted more. For example, in DRC, Ghana, Mozambique, and Senegal, the proportion of urban
respondents reporting difficulties was 7 percentage points lower than that for rural respondents (36
percent vs. 29 percent). In Kenya and Rwanda, the proportions of urban respondents reporting COVID-
linked water access difficulties were 5 and 15 percentage points higher than that of rural respondents,
respectively.
3) Water suppliers face major financial challenges, and (to a lesser extent) operational
obstacles related to supply chain disruptions and price increases for chemicals and
1
 The team’s analysis proceeded on the hypothesis that COVID-19’s direct health consequences in terms of morbidity and mortality would
 ultimately be far outweighed by the pandemic’s economic shock, based in part on predictions of an epidemiological model for the World
 Health Organization’s African region published in May (Cabore et al., 2020).

EFFECTS OF COVID-19 ON ACCESS TO WASH | SYNTHESIS REPORT vi
hardware. International donor and lender assistance has been necessary to bridge service providers
through to a period of economic recovery; in some countries, that assistance has been significant and
sufficient for the immediate term. The situation for smaller providers is likely much more dire. In
selected countries, the team learned of service disruptions already having begun as smaller operators
had exhausted cash reserves and were unable to cover electricity costs to operate pumps.

SANITATION – CURRENT STATUS
4) Consumer-reported pandemic-driven declines in sanitation access—latrine components
and installation services as well as desludging services—are, so far, much less pronounced
than those for water supply, and more in line with the sanitation services’ direct
connection to income. Very few SMS survey respondents reported changes in sanitation service
modality. This is understandable, given that sanitation is not sensitive to sudden operational disruptions
as can happen with water supply systems (with the exception of piped sewer service, whose profile
matches that of piped water supply, but which is enjoyed by an exceedingly small fraction of the
populations under study). The consumer-reported changes in sanitation service modality are comparable
to what the statistical relationship between income and sanitation outcomes would predict.
5) Providers of sanitation services are suffering because of declines in demand. The fecal
sludge management sector is particularly at risk, although a number of key informants also
reported some recovery as movement restrictions had been lifted and economic activity returned in
different countries. In particular, fecal sludge treatment plant operators face a steep path to recovery,
given their dependency on government and donor funding to close financial gaps.
6) Supply chain problems are making sanitation product and service provision less
profitable. The team’s interviews indicated significant margin contraction among both suppliers of
onsite containment inputs and fecal sludge value chain actors resulting from increasing costs of hardware
and chemicals.

HANDWASHING – CURRENT STATUS
7) Consistent with a number of studies, self-reported handwashing behavior is very high
during the pandemic period, with self-reports reinforced by consultations with value chain actors
who confirm that sales of soap have risen dramatically since the onset of the pandemic.
8) The team found no evidence of persistent or widespread shortages of soap and noted
multiple examples of both soap prices and availability remaining constant. At the same time,
the affordability of soap does appear to have declined, insofar as the ratio of spending power to prices
dropped as household income losses have mounted. Two of the six deep-dive countries in which the
team conducted SMS surveys, Kenya and Rwanda, had much higher fractions of respondents reporting
soap access becoming relatively more difficult post-COVID-19 (35 percentage points higher in Kenya
and 33 percentage points in Rwanda). This is in contrast to the other four countries where soap access
was reported to become either relatively easier (Ghana and Senegal) or remaining constant (DRC and
Mozambique). The team suspects that these difference are likely linked to the relatively higher income
shocks that Kenyans and Rwandans reported, as the evidence the team found of soap price trends
indicated no increase.
9) Manufacturers and distributors of hygiene products report margin losses despite
increased demand. These losses are driven by: 1) a shift in preference away from luxury brands
toward lower margin economy brands, 2) increases in raw material costs, and 3) the inability to raise
prices because of increased competition and a recognition of the weakened purchasing power of
consumers.

EFFECTS OF COVID-19 ON ACCESS TO WASH | SYNTHESIS REPORT vii
NEAR-TERM FUTURE TRENDS
10) The assessment team anticipates that the largest WSPs will mostly avoid major
disruptions in the next 6–12 months as their financial positions are secured with assistance
from the development banks and bilateral and multilateral aid institutions. In a number of
the investigated countries, major aid packages have been finalized and appear sufficient to bridge the
utilities through periods of acute difficulty, especially as revenue collections have resumed following
limited tariff suspensions.
11) Smaller piped water supply systems are susceptible to system disruptions, particularly
in contexts where they have had to suspend tariff collection for extended periods in
response to government policy/mandates. Without external assistance, smaller providers will feel
pressure to re-initiate billing of economically burdened customers. Even in the absence of full suspension
of services, such measures of supplier performance as frequency of running water and duration of down
times are likely to suffer from operator inability to cover electricity maintenance costs.
13) In the rural context, deferred maintenance on handpumps from economic burdens
may cause system failures over the next 6–18 months if recovery from COVID restrictions
lag. That said, the assessment team does not expect disruptions as immediate or severe as
those anticipated for schemes relying on electricity or diesel for production and
conveyance. The down time of deep lift handpumps may well increase if the declining revenues limit
the resources available to operators for regular maintenance. It is worth noting that even in pre-
pandemic circumstances, handpumps recover only on the order of 10 percent of the operating costs
(McNicholl et al., 2019).
13) The team expects demand for sanitation products and services to track economic
conditions. Unlike water supply, for which extended financial difficulties can result in both sudden and
extended performance declines by providers, consumer demand for sanitation commodities, installation
services, and tank and pit desludging should recover if and when economic activity rebounds (as the
assessment team did not uncover evidence of enterprises shutting down completely). If the economic
recovery is more prolonged and there are delays in consumer ability to service, replace, and/or repair
their latrines, reversion to open defecation is possible. The assessment team does not envision this as a
widespread problem.
14) The team is cautiously optimistic that the pandemic may have brought about a social
norms shift with respect to handwashing, and foresees few immediate crises with respect
to hygiene product supplies and general availability. Although value chain actors did report
margin contractions, none interviewed reported even considering withdrawing from the market.

EFFECTS OF COVID-19 ON ACCESS TO WASH | SYNTHESIS REPORT viii
1.0 INTRODUCTION
Between June and October 2020, the United States Agency for International Development (USAID)
Water, Sanitation, and Hygiene Partnerships and Learning for Sustainability (WASHPaLS) project
conducted a rapid assessment and forecasting analysis of the effects of the novel Coronavirus Disease
2019 (COVID-19) pandemic on access to WASH services and products in USAID high priority and
strategy-aligned countries. The central question the team sought to answer was:
 How and for whom will the COVID-19 pandemic (and resulting economic crisis) affect
 access to water supply services, sanitation services and products, and hygiene products
 across the WASH high priority and aligned countries, and how will these access effects
 vary by subsector, geography, and provider type?
The assessment team proceeded on the assumption that direct health effects of the pandemic in USAID
high-priority and strategy-aligned countries would be exceeded by the economic shock of measures
taken to contain the pandemic (restrictions of movement, closures of business, disruptions of supply
chains, and so forth). 2
On 4 May 2020, the Global WASH Cluster (GWC) and Sanitation and Water for All (SWA) released an
advocacy document entitled “Mitigating the Socio-Economic Impacts [of COVID-19] on the Water,
Sanitation, and Hygiene (WASH) Sector,” which predicted the following:
• Decline in access to and increase in prices for WASH commodities and services due to rupture in
 global supply chains caused by restrictions or no movements of goods and essential consumables
 (e.g. fuel, chemicals), affecting continuity of services. …
• Decline in the financial viability of WASH services due to loss of revenue and subsidies, and income
 loss by households, limiting ability to pay for WASH commodities and services.
• Decline in national government’s ability to deliver WASH services, affecting social cohesion, leading
 to tension and instability.
• Diversion and deprioritization of domestic funding away from the WASH sector, due to inability to
 pay for or suspension of loans.
• Shift in donor funding from the existing commitments and priorities…resulting in a significant
 reduction in the overall funding of [the WASH sector].” (GWC et al., 2020, p.3).
The assessment was intended to provide both a snapshot of current WASH access conditions and
forecasting of near-term trends, but the team also found it useful to investigate the degree to which the
GWC/SWA predictions play out in practice. The predictions also served to help the team formulate a
set of hypotheses prior to commencing activities (Table 1).

2
 COVID-19 is likely to cause the first increase in global poverty in two decades, pushing some 100 million people into poverty and 50
 million into extreme poverty in 2020, with an estimated 23 million going into extreme poverty in sub-Saharan Africa (Mahler et al., 2020).
 As described herein, the economic shocks of COVID-19 were experienced immediately and profoundly by high-priority and strategy-
 aligned countries, and persist even as some of these countries inch back toward pre-pandemic conditions of economic activity.

EFFECTS OF COVID-19 ON ACCESS TO WASH | SYNTHESIS REPORT 1
Table 1. Pre-Specified Hypotheses

 Water Supply Sanitation Hygiene
 Service provider revenues will Fragile sanitation value chains (with Wholesale costs of soap will rise, a
 decline because of 1) government respect to both excreta function of the reduced buying
 policies regarding tariff collection, containment and management) in power of local currency as well as
 2) consumer interpretation of urban and peri-urban areas will be disrupted supply chains.
 those policies, and 3) reduced most highly impacted. There will be
 ability-to-pay by consumers. increased stress on working capital
 and cash flows, profitability, and
 investment capacity.
 Supply chains for key commodities Consumer spending could shift Consumer spending on these
 will be disrupted. away from sanitation leading to: 1) products may decline as assets are
 slower rate of improved toilet diminished, with priority spending
 adoption and 2) reversion to OD directed at food and other
 in case of unaffordability of pit immediate family needs, but that
 emptying services. these spending declines may be
 partially offset by widespread
 campaigns to wash hands to
 prevent COVID infection.
 The degree of operational and There have been supply chain
 financial challenges faced by water disruptions in most countries,
 service providers will vary particularly those which are net
 considerably by modality and target importers of hygiene products or
 population. The “in-betweeners” product components.
 will be the most heavily affected; Compounded by limited mobility
 larger utilities will gain donor due to lockdowns or curfews and
 attention, and rural self-supply will panic buying from wealthy
 be largely unaffected. Smaller consumers, supply chain
 providers, informal sector actors, disruptions could lead to product
 and centralized community systems shortages.
 will have less “safety net.”
 Rural populations who rely on self-
 supply will see far less dramatic
 access effects. Supply chains for
 pump parts and maintenance will
 be affected, but given the already
 high failure rates of rural water
 infrastructure, rural populations
 generally rely on multiple water
 sources.

EFFECTS OF COVID-19 ON ACCESS TO WASH | SYNTHESIS REPORT 2
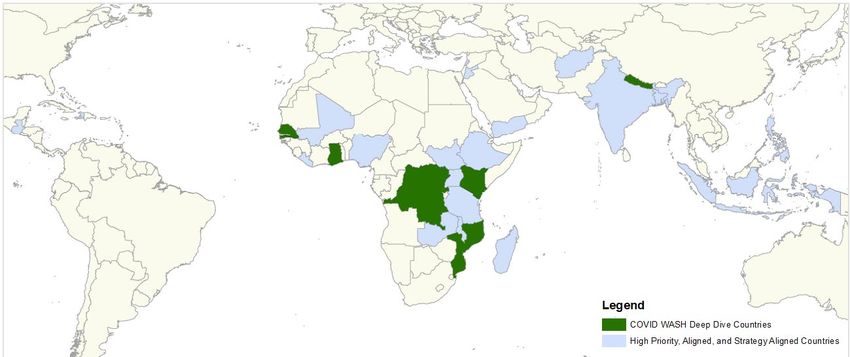
2.0 METHODS
The assessment team sought to test the hypotheses and predictions noted above through an assessment
of COVID-19-linked WASH access effects consisting of two elements:
 1. A “deep dive” into seven countries, consisting of interviews with hundreds of key
 informants and SMS-based consumer surveys of 500–750 respondents per country
 (with the exception of Nepal); and
 2. Construction of an econometric model to forecast changes in access to water and
 sanitation access from losses in income, using Demographic and Health Survey
 (DHS) and Multiple Indicator Cluster Survey (MICS) data.

2.1 DEEP DIVES
Given the time frame for this analysis, the assessment team elected to conduct a detailed investigation
into a subset of the high-priority and strategy-aligned countries. The team selected seven countries for
deep-dive analysis based on their representation of a spectrum of geographic, cultural, and vulnerability
characteristics, as well as the confidence in the team’s ability to secure interviews with key informants
identified via snowball sampling. The seven countries are the Democratic Republic of the Congo (DRC),
Ghana, Kenya, Mozambique, Nepal, Rwanda, and Senegal (Figure 1).

Figure 1. Highlighted countries are USAID high priority and strategy-aligned countries, with the deep-dive
countries in green.

Key Informant Interviews. The team conducted semi-structured interviews for 277 key informants
via phone or videoconference across the seven countries, ranging from 15 in Rwanda to 73 in Ghana,
following pre-set interview guides for service providers, government regulatory and oversight officials,
private sector actors, and program implementers. The purpose of these interviews was twofold: first, to
secure macro-level insights from well-positioned observers (essential during a period in which in-
country visits were rendered impossible) and second, to hear directly from suppliers of WASH products
and services of their present and anticipated financial and operational challenges. Ultimately, the
interviews served to complement the consumer surveys, providing a depth of observation that is not
possible to gain from a short SMS questionnaire. The assessment team also hoped that the interviews

EFFECTS OF COVID-19 ON ACCESS TO WASH | SYNTHESIS REPORT 3
would contribute to predictions of future trends and aid in clarifying differences observed among
countries. Key informant interviewees included (see Appendix 1):
 • National and local government officials, both policymakers and regulators;
 • Operators of water supply systems;
 • Providers of sanitation products (latrine inputs) and services (pit/tank emptying, fecal sludge
 transport, and waste management);
 • Producers and distributors of hygiene products (mainly soap);
 • Implementers of donor-funded WASH programs; and
 • Multilateral and bilateral donors and implementers (including the World Bank, UNICEF, United
 Kingdom Department for International Development [now the Foreign, Commonwealth &
 Development Office], Japan International Cooperation Agency [JICA], and others).
SMS Consumer Surveys. The assessment team complemented the investigation of supplier
perspectives on the WASH access effects from COVID-19 with those of consumers by way of cross-
sectional SMS surveys of at least 500 respondents per deep-dive country (with the exception of Nepal,
where SMS surveying is not yet routinely executed). The team contracted the mobile-based research
firm GeoPoll to conduct the survey using an instrument of the team’s design (see Appendix 2).
SMS surveying is an extraordinarily efficient means of collecting consumer information. With formal
access to mobile subscriber databases consisting of millions of people in each of the African deep-dive
countries analyzed, GeoPoll was able to secure SMS survey responses from a sample with geographic
and age distributions representative of the broader population of each country. This survey could be
easily read and filled out with a basic feature phone (non-smartphone), and was offered to potential
respondents incentivized by a modest offer of top-up credit. The instrument consisted of 33 questions,
with skip patterns that meant that a respondent typically saw on the order 20–25 questions. The team
offered the surveys in the following languages for each country:
 • DRC: French and Swahili;
 • Ghana: English;
 • Kenya: English and Swahili;
 • Mozambique: Portuguese;
 • Rwanda: English and Kinyarwanda; and
 • Senegal: French and Wolof.
The survey contained modules on employment and migration, water supply, sanitation, and handwashing.
Completion rates of the survey ranged from 19 percent in Rwanda to 55 percent in Senegal (meaning,
for example, that roughly 2,800 opt-ins were required to achieve 500 completed surveys in Rwanda, but
only 860 opt-ins were required to achieve 500 completed surveys in Senegal). The surveys for DRC,
Ghana, Kenya, Mozambique, and Senegal were completed during the latter half of August 2020. The
survey for Rwanda was executed during the first two weeks of October 2020.
The team notes that SMS survey respondents, by virtue of their possession of a charged cell phone and
the technical ability to fill out a survey, are likely a biased sample of the broader populations of the deep-
dive countries. Cell phone ownership is estimated to be 10 percent lower among women than among
men in low-to-middle-income countries (GSMA Connected Women, 2019). The team attempted to
address this by setting a 50-50 gender split quota for survey results. The team considers it likely for
respondents to have an elevated wealth and educational status than those who do not own a functional
phone. Nonetheless, the team considers these biases to be small enough to make using the SMS surveys
extremely useful, given the relative ease of deploying them.

EFFECTS OF COVID-19 ON ACCESS TO WASH | SYNTHESIS REPORT 4
2.2 ECONOMETRIC MODEL FOR FORECASTING CHANGES IN ACCESS TO
 WASH SERVICES
A central objective of this assignment was to forecast future trends in access to WASH services and
products. Consumer surveys were expected to reflect current WASH access conditions, while the key
informant interviews would provide essential insights on the intensity and possible duration of service
disruptions and performance challenges.
In the interest of offering quantitative estimates of future access trends to the degree possible, the
assessment team considered how economic indicators relate to WASH outcomes and then to explore
numerical forecasts of WASH access changes resulting from an economic shock. There is some
published literature to support this endeavor: Jeuland et al. (2013) developed long range (1975–2050)
projections for Joint Monitoring Programme of the World Health Organization (WHO) and UNICEF
(JMP) -defined improved water and improved sanitation and piped water and sewer coverage, based on
cross-country associations between income and water/sanitation access, and urbanization. Their analysis
employs projections of urbanization, population growth, and economic growth to simulate trends in
water and sanitation coverage levels. Building on this analysis, Fuente et al. (2020) focused on sub-
Saharan Africa to estimate WASH-related mortality and economic losses associated with poor access to
water and sanitation infrastructure. The assessment team extended this approach by focusing exclusively
on the income effect, dividing it into two sub-questions:
 1. How responsive is WASH to falling income; and
 2. How much has the COVID-19 crisis affected incomes?
Summary of the approach. The team first estimated how wealth predicts WASH access by running
cross-sectional models in each high-priority and strategy-aligned country. Then, in a univariate model,
the team regressed water or sanitation access level on an index measure of wealth. Subsequently, to
control for rural vs. urban effects, education, and neighborhood/village effects, the team ran three
additional multivariate models. The team then multiplied the estimate of the responsiveness of WASH
access to wealth, education, and neighborhood/village effects by forecasts of the size of Gross Domestic
Product (GDP) shock (from World Bank estimates). This allowed the team to estimate the water and
sanitation effects from the pandemic’s economic shock scaled by an economic decline of a user’s choice.
This was done for all high-priority and strategy-aligned countries. For a detailed description of the model
approach and results, see Appendix 3.
Datasets. The team used the most recent, pre-pandemic DHS (including the Malaria Indicator Surveys,
or MIS) or MICS in each high-priority or strategy-aligned country (see Appendix 3), analyzing water
supply effects in 27 countries and sanitation in 28 countries.
Dependent variable. The response variable in the model is WASH access. DHS and MICS record the
means by which respondents report accessing drinking water (“piped into dwelling,” “piped into
yard/plot,” “public tap/standpipe”, etc.), as well as sanitation service level (“piped sewer system,” “septic
tank,” “pit latrine,” etc.). The team’s model focuses on changes in rungs of the JMP service ladder, with
the objective of estimating the percentage of the population falling below the “Basic” level of water or
sanitation service (see Appendix 3).
Explanatory variables. The team sought to explain changes in WASH access as a function of changes
in wealth. The wealth measure is based on asset ownership, housing quality, land and home ownership,
and livestock ownership, following the DHS procedure for creating a wealth index and examining
quintiles, 3 but diverging by removing the water and sanitation access measures from the list of assets.

3
 “Steps to constructing the new DHS Wealth Index.” Shea O. Rutstein, DHS Program, no date.
 https://dhsprogram.com/programming/wealth%20index/Steps_to_constructing_the_new_DHS_Wealth_Index.pdf

EFFECTS OF COVID-19 ON ACCESS TO WASH | SYNTHESIS REPORT 5
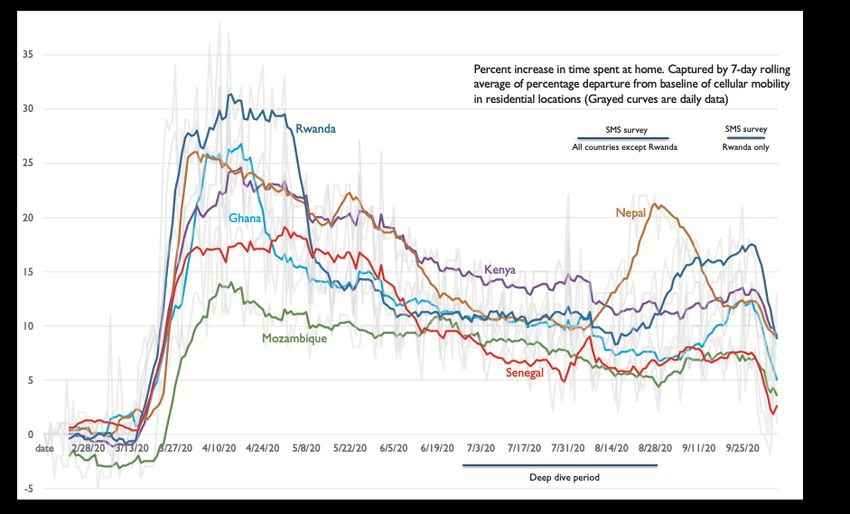
3.0 GOVERNMENT RESPONSE IN DEEP-
 DIVE COUNTRIES AND REPORTED
 ECONOMIC DISTRESS
In addition to differing pre-existing and contextual vulnerabilities to the pandemic, deep-dive countries
saw differing degrees and durations of government response, enforcement, and population adherence to
restrictions, which in turn drove impacts on economic activity. One way to visualize these differences is
to consider the trends in restricted movement indicated by cellular phone mobility, with the caveat that
mobile phone penetration varies from country to country and is complex to estimate with precision. 4
Figure 2 displays the trend in percentage departure from baseline levels of time spent in residential
settings (as distinct from commercial/industrial settings or other location categories). The higher the
value, the more time the cell phone user spends at home, and less time at commercial, industrial, or
other non-residential locations, relative to baseline.

Figure 2. Percent departure from baseline mobile phone mobility, residential category, February to early
October 2020. Periods of the SMS surveys and deep-dive interviews are noted. There are no mobility data
available for DRC. Source: Google COVID-19 Community Mobility Reports (Google, 2020).

For the deep-dive countries in the analysis, there is a notable range in both the intensity and duration of
effects on movement. Rwanda’s lockdown resulted in the most extreme movement restrictions. The

4
 According to a 2017 survey by the Pew Research Center, reported ownership of mobile phones by adults was roughly 80% in Ghana,
 Kenya, and Senegal (Pew Research Center, 2018). Meanwhile, the 43 million mobile connections in Nepal correspond to 148% of its
 population, and the 9.4 million mobile connections in Rwanda in January 2020 correspond to 73% of its total population (Kemp, 2020).
 Because multiple SIM card use per person is common in the Global South, it can be difficult to estimate mobile phone penetration using
 accounts alone; a survey by Research ICT Africa estimates the 2017 penetration in Rwanda at 50% and Mozambique at 40% (Research ICT
 Africa, 2019). With these cautions in mind, cellular mobility data still provide the best possible proxy for movement effects resulting from
 COVID-19 restrictions.

EFFECTS OF COVID-19 ON ACCESS TO WASH | SYNTHESIS REPORT 6
easing of those restrictions in May brought the country in line with those in place for Ghana and Nepal;
for about four weeks, the country witnessed even less disruption than in Senegal. Ghana’s lockdown was
intense but very short, while the effects of Mozambique’s movement restrictions were consistently the
least extreme of the deep-dive countries. Kenya’s restrictions were sustained for a longer period than
other countries; from mid-June until the first week of August, its restrictions resulted in the greatest
limits on movement. Some countries re-introduced restrictions at different times: the government of
Nepal issued a strict nationwide lockdown from 24 March to 21 July 2020, prohibiting domestic and
international travel, instituting border closures, and suspending non-essential services, but then re-
imposed restrictions in Kathmandu Valley on 19 August following an increase in local transmission
attributed in part to large-scale entry of travelers from India when the border re-opened. These
measures are reflected in Nepal’s second peak in residential mobility in early August corresponding to
the re-imposition of lockdown measures through the end of the month.
While there are other important drivers of COVID-19 economic burden (particularly the loss of the
tourism revenue and remittances), these movement indicators are a useful indicator of the magnitude of
pressure endured by different countries.
Additionally, the team’s SMS surveys asked respondents how their employment had changed due to the
pandemic (Figure 3). In addition to how widespread the pandemic’s economic pain is being felt, with
greater than half the respondents reporting job or income loss stemming from COVID-19, the numbers
for Kenya and Rwanda show pronounced effects to consider in the analysis of WASH access effects.

Figure 3. Percentage of respondents answering, “I lost my job” or “I earn less money” to the question,
“How has COVID-19 changed your employment?”
Source: The team’s SMS surveys, conducted in August 2020 (except for Rwanda, which was conducted in October 2020).

In most of the deep-dive countries, radical emergency travel restrictions were put in place from late
March through June or July, although the duration of (and continued adherence to) these measures
varied. The Government of Nepal issued a strict nationwide lockdown from 24 March to 21 July 2020,
prohibiting domestic and international travel, instituting border closures, and suspending non-essential
services. Following a relaxation of restrictions, it reimposed measures in Kathmandu Valley on 19
August following an increase in local transmission attributed in part to large-scale entry of travelers from
India when the border re-opened (Nepali Times, 18 August 2020). In Ghana, following initial border
closings; travel restrictions; partial lockdowns in the major hubs of Greater Accra and Kumasi
metropolitan regions; closings of bars, restaurants, schools, and universities; and restrictions on the sizes

EFFECTS OF COVID-19 ON ACCESS TO WASH | SYNTHESIS REPORT 7
of public gatherings (conferences, workshops, funerals, festivals, political rallies, church activities and
other related events), relaxation began in late April. This restriction relaxation is reflected in a rapid
return toward baseline levels of mobility (Figure 2), and then a further steady decline in time spent in
residential settings from May through September. Taken together, this suggests a shorter period of
economic shock in Ghana than other countries analyzed.
Rwanda implemented the most comprehensive nationwide lockdown, from late March to early May,
resulting in the highest movement disruption of any of the deep-dive countries, with renewed
restrictions in September (Figure 2). Rwanda has resumed most business operations as of November
2020, including restaurants, hotels, shops, and tourism operations, although bars remain closed. Schools
are in the process of a phased reopening.
In Kenya, by contrast, curfews from 19h00 to 05h00 were instituted from 27 March to 7 July, adjusted
to 21h00 to 04h00 through September. Schools were closed 15 March and remain so, but are due to
reopen in January 2021. These restrictions correspond to restrictions on mobility (and consequent
increases time spent at home) that were sustained for longer periods than other deep-dive country.
In terms of WASH sector support, most governments instituted free water directives, although these
varied in scope and duration. The Ghanaian government initially allocated US$205 million to pay water
bills for all customers for three months (April to June) and to provide water tanker services to
vulnerable communities, as well as investing in hand-washing facilities in public places. The directive was
subsequently extended through August, and then again through December 2020. In Kenya and
Mozambique, free water initiatives explicitly prohibited disconnection of customers with outstanding
water and sewer bills and required the reconnection of previously disconnected customers. Tariff
suspensions in these countries were targeted to Low Income Areas (LIAs, defined specifically as informal
settlements) in Kenya, and to customers using less than 5m3/month and those relying on water from
public and private standpipes in Mozambique.
In DRC and Senegal, the free water mandate covered the entire country, but was limited to two
months. In DRC, however, the tariff holiday was followed by a rate increase of 13–15 percent,
depending upon the monthly consumption volume.
Neither the Nepalese nor Rwandan governments issued formal water tariff relaxation policies. Rwanda
launched a fund to support affected businesses through subsidized loans from commercial banks and
microfinance institutions and credit guarantees, targeting small-to-medium-sized enterprises (SMEs) and
hard-hit sectors such as the hospitality industry (International Monetary Fund [IMF], 2020). The
Government of Rwanda also extensively promoted handwashing, including making handwashing stations
and sanitizers compulsory in all public places, such as churches, bus stations, and market places, and
issuing decrees to keep the consumer cost of hand hygiene products reasonable.

EFFECTS OF COVID-19 ON ACCESS TO WASH | SYNTHESIS REPORT 8
4.0 DEEP DIVE RESULTS: DRINKING WATER
This section summarizes the results of the team’s analysis of COVID-related drinking water access
changes in the seven deep-dive countries, based on key informant interviews and the SMS consumer
surveys conducted in the six African countries.

4.1 THE CONSUMER SIDE
Consumers widely report that COVID-19 has made getting drinking water more difficult, with those
difficulties reflected in how respondents to the SMS surveys reported changes in how they access
drinking water before and after the onset of the pandemic. The most notable reported challenges were
shifts away from piped water among both urban and rural respondents in Kenya (and toward surface
water among rural respondents) as well as declines in bottled/sachet water and cart vendor use in
several countries.

Figure 4. Percentage of respondents answering “Yes” to the question, “Has COVID-19 made it more
difficult to get your drinking water?”
Source: SMS surveys conducted in August 2020 (except for Rwanda, which was conducted in October 2020). Sample sizes
for each country segment shown at the base of the columns.

Figure 4 offers the results of the SMS survey question on pandemic-related drinking water difficulties.
Although there is some important variation among countries, of those surveyed a significant number
reported that COVID-19 has made accessing drinking water more difficult. In all but Kenya and Rwanda,
more self-identified rural respondents reported pandemic-linked water access problems than urban

EFFECTS OF COVID-19 ON ACCESS TO WASH | SYNTHESIS REPORT 9
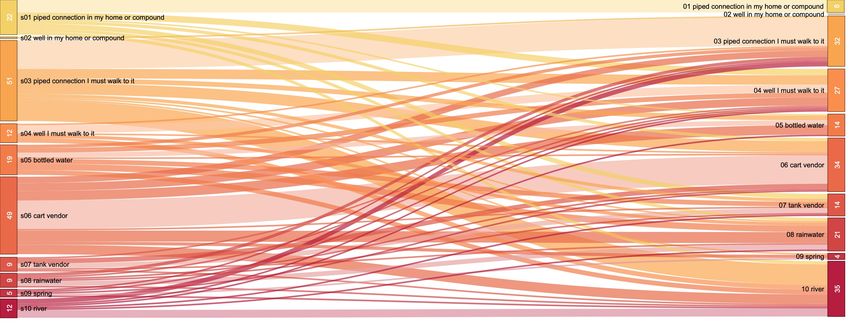
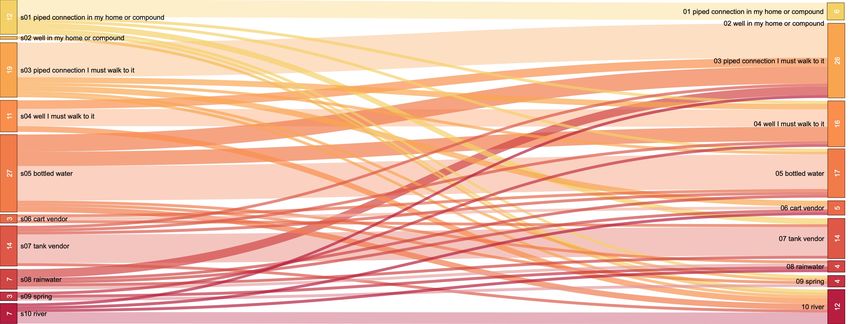
respondents. The slightly higher urban numbers in Kenya co-occur with its urban respondents reporting
considerably more economic hardship than the other countries’ urban respondents (with 75 percent of
urban Kenyans reporting either losing jobs or suffering income losses, vs. a mean of 52 percent of urban
respondents in the other countries). For Rwanda, where the urban vs. rural divide on WASH difficulties
is by far the most pronounced (with a difference of 15 percentage points), the team observed no
comparable income link; the 57 percent of urban Rwandans who report losing jobs or suffering an
income loss is almost exactly the mean value (and near the median value) of the deep-dive countries.
Through the SMS surveys, the team also sought to learn how those reporting water access problems
were experiencing them. Those who responded in the affirmative to the question, “Has COVID-19 made
it more difficult to get your drinking water?” were then asked a series of questions of how they accessed
drinking water before and after the onset of the pandemic. The results of those questions appear in
Figure 5.

 Figure 5. Heat map depicting percentage point changes in reported water service modality,
 pre-COVID-19 vs. at present, among those responding “Yes” to the question, “Has COVID-
 19 made it more difficult to get your drinking water?”

EFFECTS OF COVID-19 ON ACCESS TO WASH | SYNTHESIS REPORT 10
You can also read