HARMFUL ALGAL BLOOM ACTION PLAN LAKE CARMEL - www.dec.ny.gov - Department of ...
←
→
Page content transcription
If your browser does not render page correctly, please read the page content below
HARMFUL ALGAL BLOOM
                                  ACTION PLAN
                                 LAKE CARMEL

Lake Carmel, 8/2/2016 (Source: NYSDEC)

                                         www.dec.ny.gov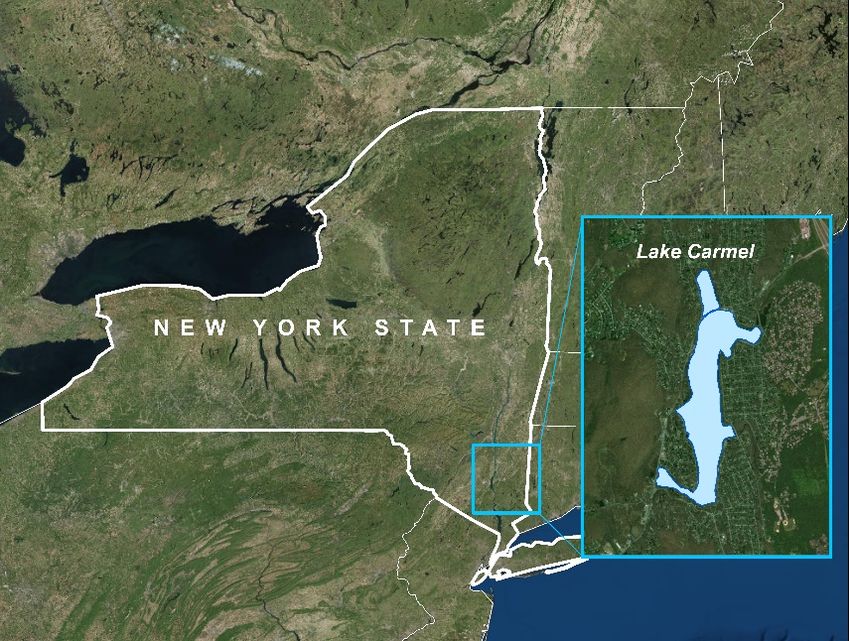
EXECUTIVE SUMMARY
SAFEGUARDING NEW YORK’S WATER
Protecting water quality is essential to healthy, vibrant communities,
clean drinking water, and an array of recreational uses that benefit our
local and regional economies.
                                                                            200
                                                                                      NY Waterbodies with HABs
Governor Cuomo recognizes that investments in water quality                 175
protection are critical to the future of our communities and the state.
                                                                            150
Under his direction, New York has launched an aggressive effort
to protect state waters, including the landmark $2.5 billion Clean          125

Water Infrastructure Act of 2017, and a first-of-its-kind, comprehensive    100
initiative to reduce the frequency of harmful algal blooms (HABs).           75

New York recognizes the threat HABs pose to our drinking water,              50

outdoor recreation, fish and animals, and human health. In 2017, more        25
than 100 beaches were closed for at least part of the summer due to           0
HABs, and some lakes that serve as the primary drinking water source

                                                                                      12

                                                                                            13

                                                                                                    14

                                                                                                            15

                                                                                                                    16

                                                                                                                              17
                                                                                                                              20
                                                                                                   20
                                                                                  20

                                                                                           20

                                                                                                           20

                                                                                                                   20
for their communities were threatened by HABs for the first time.

GOVERNOR CUOMO’S FOUR-POINT
HARMFUL ALGAL BLOOM INITIATIVE
In his 2018 State of the State address, Governor Cuomo announced                      FOUR-POINT INITIATIVE
a $65 million, four-point initiative to aggressively combat HABs in

                                                                                  1
Upstate New York, with the goal to identify contributing factors fueling              PRIORITY LAKE IDENTIFICATION
                                                                                      Identify 12 priority waterbodies that
HABs, and implement innovative strategies to address their causes                     represent a wide range of conditions
and protect water quality.                                                            and vulnerabilities—the lessons learned
                                                                                      will be applied to other impacted
Under this initiative, the Governor’s Water Quality Rapid Response                    waterbodies in the future.
Team focused strategic planning efforts on 12 priority lakes across

                                                                                  2
New York that have experienced or are vulnerable to HABs. The                         REGIONAL SUMMITS
                                                                                      Convene four Regional Summits to
team brought together national, state, and local experts to discuss
                                                                                      bring together nation-leading experts
the science of HABs, and held four regional summits that focused on                   with Steering Committees of local
conditions that were potentially affecting the waters and contributing                stakeholders.
to HABs formation, and immediate and long-range actions to reduce

                                                                                  3
the frequency and /or treat HABs.                                                     ACTION PLAN DEVELOPMENT
                                                                                      Continue to engage the nation-leading
                                                                                      experts and local Steering Committees to
Although the 12 selected lakes are unique and represent a wide
                                                                                      complete Action Plans for each priority
range of conditions, the goal was to identify factors that lead to                    waterbody, identifying the unique factors
HABs in specific water bodies, and apply the information learned                      fueling HABs—and recommending
to other lakes facing similar threats. The Rapid Response Team,                       tailored strategies to reduce blooms.
national stakeholders, and local steering committees worked together

                                                                                  4
                                                                                      ACTION PLAN IMPLEMENTATION
collaboratively to develop science-driven Action Plans for each
                                                                                      Provide nearly $60 million in grant
of the 12 lakes to reduce the sources of pollution that spark algal                   funding to implement the Action Plans,
blooms. The state will provide nearly $60 million in grant funding to                 including new monitoring and treatment
implement the Action Plans, including new monitoring and treatment                    technologies.
technologies.

          TO LEARN MORE ABOUT HABs, VISIT:                  on.ny.gov/hab     www.health.ny.gov/HarmfulAlgae
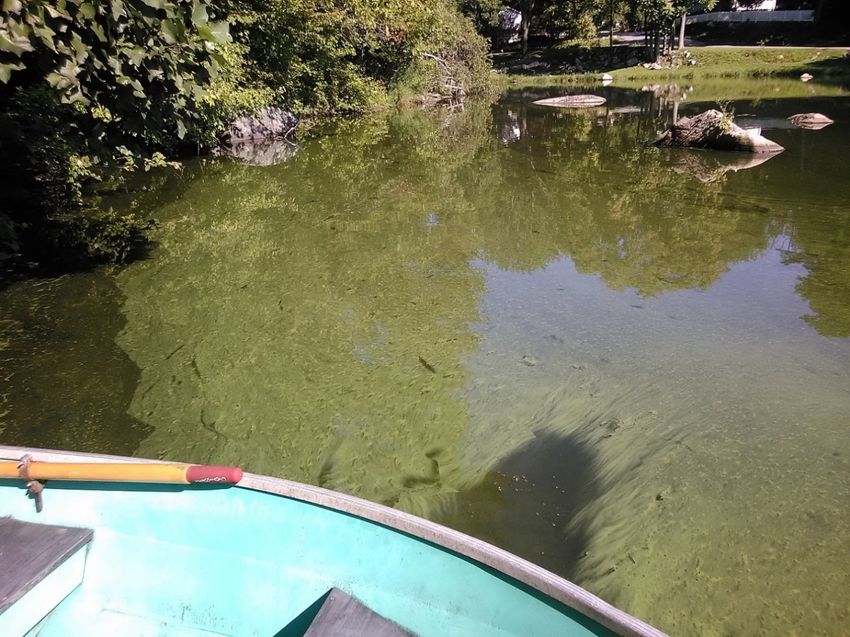
LAKE CARMEL
Putnam County

Lake Carmel, a 186-acre, manmade lake in Putnam County, is one of the 12 priority lakes impacted by HABs. The lake is used
for swimming, fishing and boating. In addition, Lake Carmel is part of the Croton System, which supplies approximately 10
percent of New York City’s clean, healthy drinking water.

Based on water quality monitoring conducted in 2016-17, Lake Carmel was designated as an “impaired waterbody” due
to excessive nutrients (phosphorus), algae and poor water clarity, which could impact recreational uses in the lake. Total
phosphorus concentrations in Lake Carmel are greater than average concentrations found in Hudson Valley lakes.

The significant sources of phosphorus loading in the lake are:
  • Septic system discharges;
  • Phosphorus being released from in-lake sediments; and
  • Non-point source nutrient inputs from the contributing watershed.

There were 13 reported HABs occurrences in the lake from
2015 through 2017: including 7 confirmed occurrences, 2 that
were “widespread/lakewide;” and 5 “suspicious” occurrences.
These blooms caused beach closures at all four designated
swimming beaches in mid-July 2015 and August 2016, and
three of the four beaches in July 2017 (the other swimming
beach remained open during July, but was closed for 20 days
in August 2017).

Although the causes of HABs vary from lake to lake,
phosphorus pollution—from sources such as wastewater
treatment plants, septic systems, and fertilizer runoff—is a major
contributor. Other factors likely contributing to the uptick in
HABs include higher temperatures, increased precipitation, and
invasive species.

With input from national and local experts, the Water Quality
Rapid Response Team identified a suite of priority actions
(see Section 13 of the Action Plan for the complete list) to
address HABs in Lake Carmel, including the following:
  • Construct a wastewater treatment plant (WWTP) and install
    infrastructure to connect 2,500 houses within the watershed
                                                                                                                     Lake
    to the WWTP;                                                                                                    Carmel
  • Stabilize and reinforce the banks of the Middle Branch of the
    Croton River and Stump Pond Stream;
  • Create riparian buffers along streams to inhibit or restrict

                                                                                    ¯
    nutrient-enriched stormwater runoff and eroded soil from
    reaching the stream; and
  • Implement multiple stormwater Best Management Practices
    (BMPs) to reduce sediment loading into Lake Carmel. This
    would include the purchase of a street sweeping vacuum
    truck to prevent sediment and organic debris from entering           The black outline shows the lake’s watershed area:
    storm drains, ditches, tributaries and Lake Carmel.                  all the land area where rain, snowmelt, streams or runoff flow into
                                                                         the lake. Land uses and activities on the land in this area have the
                                                                         potential to impact the lake.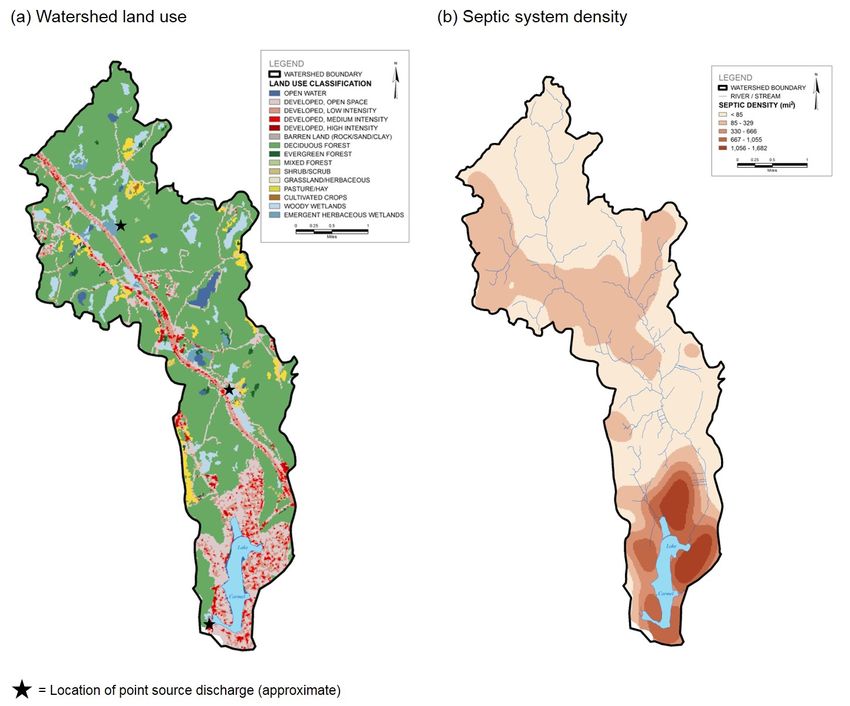
LAKE CARMEL CONTINUED

NEW YORK’S COMMITMENT TO PROTECTING OUR WATERS FROM HABS
New York is committed to addressing threats related to HABs, and will continue to monitor conditions in Lake Carmel while
working with researchers, scientists, and others who recognize the urgency of action to protect water quality.

Governor Cuomo is committed to providing nearly $60 million in grants to implement the priority actions included in these
Action Plans, including new monitoring and treatment technologies. The New York State Water Quality Rapid Response Team
has established a one-stop shop funding portal and stands ready to assist all partners in securing funding and expeditiously
implementing priority projects. A description of the various funding streams available and links for applications can be found
here: https://on.ny.gov/HABsAction.

This Action Plan is intended to be a ‘living document’ for Lake Carmel and interested members of the public are encouraged
to submit comments and ideas to DOWInformation@dec.ny.gov to assist with HABs prevention and treatment moving
forward.

  NEW YORK STATE RESOURCES
  Drinking Water Monitoring and Technical Assistance:
  The state provides ongoing technical assistance for public
                                                                            Pea soup appearance
  water suppliers to optimize drinking water treatment when
  HABs and toxins might affect treated water. The U.S. EPA
  recommends a 10-day health advisory level of 0.3 micrograms
  per liter for HAB toxins, called microcystins, in drinking water
  for young children.

  Public Outreach and Education:
                                                                            Floating dots or clumps
  The Know It, Avoid It, Report It campaign helps educate
  New Yorkers about recognizing HABs, taking steps to reduce
  exposure, and reporting HABs to state and local agencies.
  The state also requires regulated beaches to close swimming
  areas when HABs are observed and to test water before
  reopening.
                                                                            Spilled paint appearance
  Research, Surveillance, and Monitoring:
  Various state agencies, local authorities and organizations,
  and academic partners are working together to develop
  strategies to prevent and mitigate HABs. The state tracks HAB
  occurrences and illnesses related to exposure.

  Water Quality and Pollution Control:                                    Streaks on the water’s surface
  State laws and programs help control pollution and reduce
  nutrients from entering surface waters. State funding is                              CONTACT WITH HABs
  available for municipalities, soil and water conservation                          CAN CAUSE HEALTH EFFECTS
  districts, and non-profit organizations to implement projects
                                                                              Exposure to HABs can cause diarrhea, nausea, or
  that reduce nutrient runoff.                                                vomiting; skin, eye or throat irritation; and allergic
                                                                                      reactions or breathing difficulties.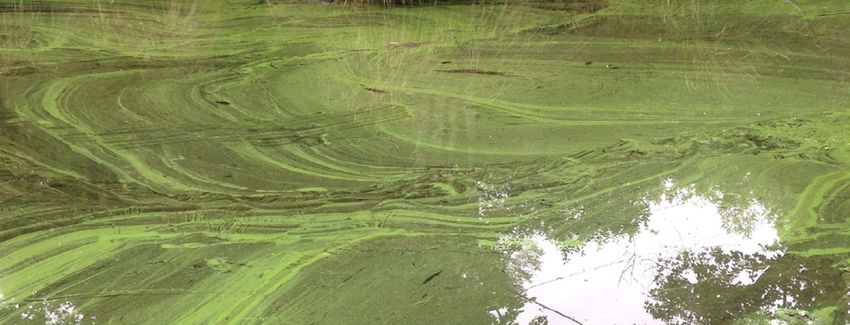
Contents
List of Tables ................................................................................................................... 3
List of Figures .................................................................................................................. 3
1.     Introduction .............................................................................................................. 5
     1.1       Purpose .......................................................................................................... 5
     1.2       Scope, Jurisdiction and Audience ................................................................... 5
     1.3       Background ..................................................................................................... 6
2.     Lake Background ..................................................................................................... 7
     2.1       Geographic Location ....................................................................................... 7
     2.2       Basin Location ................................................................................................ 7
     2.3       Morphology ..................................................................................................... 8
     2.4       Hydrology ........................................................................................................ 9
     2.5       Lake Origin ..................................................................................................... 9
3.     Designated Uses .................................................................................................... 10
     3.1       Water Quality Classification – Lake and Major Tributaries............................ 10
     3.2       Potable Water Uses ...................................................................................... 10
     3.3       Public Bathing Uses ...................................................................................... 12
     3.4       Recreation Uses ........................................................................................... 13
     3.5       Fish Consumption/Fishing Uses ................................................................... 13
     3.6       Aquatic Life Uses .......................................................................................... 13
4.     User and Stakeholder Groups ................................................................................ 14
5.     Monitoring Efforts ................................................................................................... 14
     5.1       Lake Monitoring Activities ............................................................................. 14
     5.2       Tributary Monitoring Activities ....................................................................... 15
6.     Water Quality Conditions ....................................................................................... 15
     6.1       Physical Conditions....................................................................................... 17
     6.2       Chemical Conditions ..................................................................................... 20
     6.3       Biological Conditions..................................................................................... 24
     6.4       Other Conditions ........................................................................................... 27
7.     Summary of HABs.................................................................................................. 27
     7.1       HABs History ................................................................................................ 28

1 | HABS ACTION PLAN – LAKE CARMEL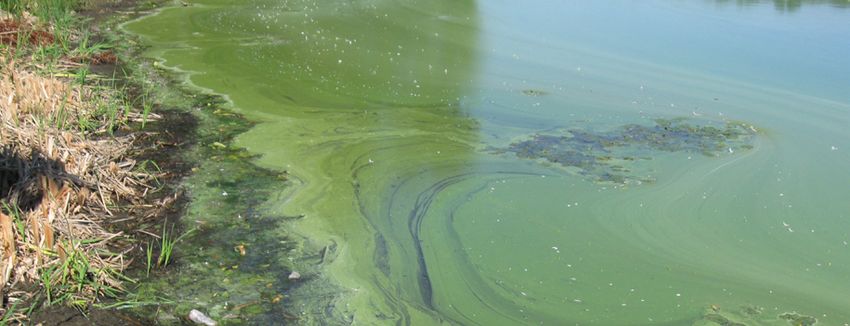
7.2        Drinking Water and Swimming Beach HABs History .................................... 30
     7.3        Other Bloom Documentation ......................................................................... 32
     7.4        Use Impacts .................................................................................................. 33
8.     Waterbody Assessment ......................................................................................... 33
     8.1        WI/PWL Assessment .................................................................................... 34
     8.2        Source Water Protection Program (SWPP) .................................................. 34
     8.3        CSLAP Scorecard ......................................................................................... 34
9.     Conditions triggering HABs .................................................................................... 35
     9.1        Pollutant Assessment ................................................................................... 37
     9.2        Other Contributing Factors ............................................................................ 38
10.         Sources of Pollutants triggering HABs................................................................ 39
     10.1       Land Uses ..................................................................................................... 39
     10.2       External Pollutant Loadings .......................................................................... 41
     10.3       Internal Pollutant Loadings ........................................................................... 42
     10.4       Summary of Priority Land Uses and Land Areas .......................................... 42
11.         Lake Management / Water Quality Goals ........................................................... 42
12.         Summary of Management Actions to Date ......................................................... 43
     12.1       Local Management Actions........................................................................... 43
     12.2       Funded Projects ............................................................................................ 44
     12.3       DEC Issued Permits...................................................................................... 44
     12.4       Research Activities ....................................................................................... 45
     12.5       Clean Water Plans (TMDL, 9E, or Other Plans) ........................................... 45
13.         Proposed Harmful Algal Blooms (HABs) Actions................................................ 47
     13.1       Overarching Considerations ......................................................................... 47
       13.1.1 Phosphorus Forms ...................................................................................... 47
       13.1.2 Climate Change .......................................................................................... 47
     13.2       Priority Project Development and Funding Opportunities ............................. 48
     13.3       Lake Carmel Priority Projects ....................................................................... 51
       13.3.1 Priority 1 Projects ........................................................................................ 51
       13.3.2 Priority 2 Projects ........................................................................................ 52
       13.3.3 Priority 3 Projects ........................................................................................ 54
     13.4       Additional Watershed Management Actions ................................................. 54

2 | HABS ACTION PLAN – LAKE CARMEL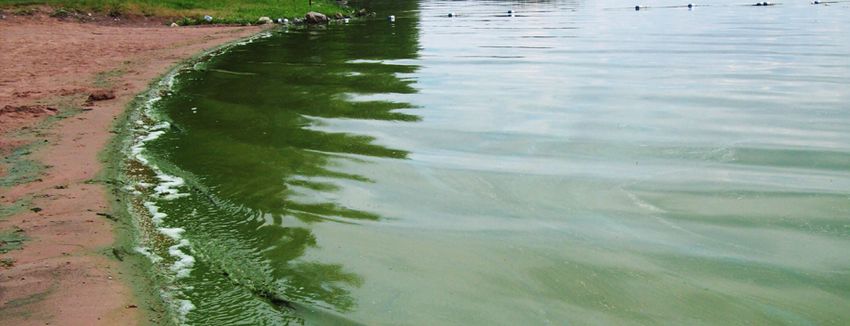
13.5        In-Lake Management Actions ....................................................................... 54
   13.6        Monitoring Actions ........................................................................................ 55
   13.7        Research Actions .......................................................................................... 55
   13.8        Coordination Actions ..................................................................................... 57
   13.9        Long-term Use of Action Plan ....................................................................... 58
14.       References ......................................................................................................... 59
Appendix A. Wind and Wave Patterns .......................................................................... 63
Appendix B. Waterbody Classifications ......................................................................... 65
Appendix C. WI/PWL Summary .................................................................................... 67
Appendix D. NYSDEC Water Quality Monitoring Programs .......................................... 70
Appendix E. Road Ditches ............................................................................................ 71

List of Tables
Table 1. Regional summary of surface total phosphorus (TP) concentrations (mg/L, ±
standard error) for New York State lakes (2012-2017, CSLAP and LCI), and the
average TP concentration (± standard error) in Lake Carmel (2016-2017). .................. 16
Table 2. New York State criteria for trophic classifications (NYSFOLA 2009) compared
to average Lake Carmel values in 2016 and 2017 (CSLAP, ± standard error). ............. 16
Table 3. Lake Carmel HABs history as documented by CSLAP. .................................. 29
Table 4. Dominant algal taxa present during confirmed or archive bloom events in Lake
Carmel, 2016 and 2017. ................................................................................................ 29

List of Figures
Figure 1. Location of Lake Carmel within New York State. ............................................. 7
Figure 2. Political boundaries within the Lake Carmel watershed. .................................. 8
Figure 3. Lake Carmel Park District designated and regulated swimming beaches
(Source: Town of Kent). Note that north is to the right on this figure. ............................ 12
Figure 4. (a) Historic (1986-1990) and (b) recent (2013, 2016, 2017) Secchi depth (m)
measurements at Lake Carmel. .................................................................................... 18
Figure 5. (a) Historic (1986-1990) and (b) recent (2013, 2016, 2017) surface water
temperature (°C) at Lake Carmel. ................................................................................. 19
Figure 6. Temperature (°C) depth (m) profiles in Lake Carmel from June to September
in 2013 (LCI). ................................................................................................................ 20

3 | HABS ACTION PLAN – LAKE CARMEL
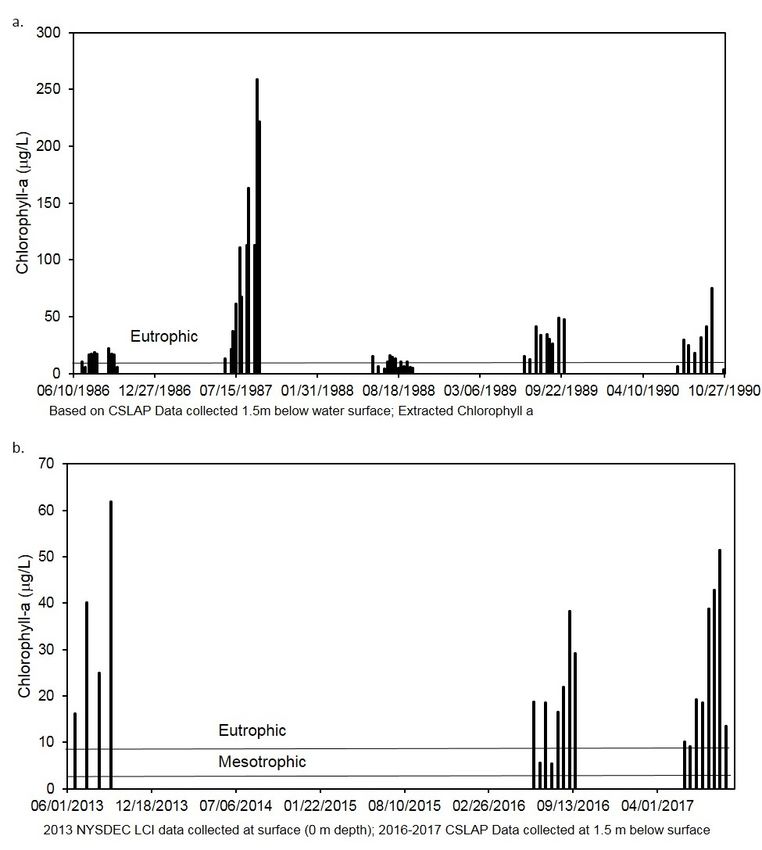
Figure 7. Depth (m) profile of dissolved oxygen (DO) concentrations (mg/L) in Lake
Carmel from June to September 2013 (LCI). ................................................................ 21
Figure 8. (a) Historic (1986-1990) and (b) recent (2013, 2016, 2017) total phosphorus
(TP) concentrations (mg/L) in Lake Carmel................................................................... 22
Figure 9. (a) Total nitrogen (TN) and (b) ammonia and nitrite/nitrate concentrations
(mg/L) in Lake Carmel from 2013 (LCI), and 2016 to 2017 (CSLAP). ........................... 23
Figure 10. Ratios of total nitrogen (TN) to total phosphorus (TP), by mass, in Lake
Carmel water samples from 2013 (LCI), and 2016 to 2017 (CSLAP). ........................... 24
Figure 11. (a) Historic and (b) current chlorophyll-a concentrations (µg/L) in Lake
Carmel........................................................................................................................... 26
Figure 12. Number of days of beach closures on Lake Carmel due to the presence of
HABs, 2014 to 2017 (NYSDOH). .................................................................................. 32
Figure 13. Lake Carmel 2017 CSLAP scorecard. ......................................................... 35
Figure 14. Land uses and percentages in the Lake Carmel watershed. ....................... 39
Figure 15. (a) Watershed land use and (b) septic system density for Lake Carmel. ..... 40

4 | HABS ACTION PLAN – LAKE CARMEL
1. Introduction
1.1 Purpose
New York State's aquatic resources are among the best in the country. State residents
benefit from the fact that these resources are not isolated but can be found from the
eastern tip of Long Island to the Niagara River in the west, and from the St. Lawrence
River in the north to the Delaware River in the south.
These resources, and the plants and animals they harbor, provide both the State and
the local communities numerous public health, economic, and ecological benefits
including potable drinking water, tourism, water-based recreation, and ecosystem
services. Harmful algal blooms (HABs) within ponded waters (i.e., lakes and ponds) of
New York State have become increasingly prevalent in recent years and have impacted
the values and services that these resources provide.
This HABs Action Plan for Lake Carmel has been developed by the New York State
Water Quality Rapid Response Team (WQRRT) to:
   •   Describe the physical and biological conditions
   •   Summarize the research conducted to date and the data it has produced
   •   Identify the potential causative factors contributing to HABs
   •   Provide specific recommendations to minimize the frequency, intensity, and
       duration of HABs to protect the health and livelihood of its residents and wildlife.
This Action Plan represents a key element in New York State's efforts to combat HABs
now and into the future.
1.2 Scope, Jurisdiction and Audience
The New York State HABs monitoring and surveillance program was developed to
evaluate conditions for waterbodies with a variety of uses (public, private, public water
supplies (PWSs), non-PWSs) throughout the State. The Governor’s HABs initiative
focuses on waterbodies that possess one or more of the following elements:
   •   Serve as a public drinking water supply
   •   Are publicly accessible
   •   Have regulated bathing beaches
Based on these criteria, the Governor’s HABs initiative has selected 12 New York State
waterbodies that are representative of waterbody types, lake conditions, and
vulnerability to HABs throughout the State. Lake Carmel, with its bathing beaches,
recreational opportunities, and proximity to the New York City drinking water supply,
was selected as one of the priority waterbodies, and is the subject of this HABs Action
Plan.

5 | HABS ACTION PLAN – LAKE CARMEL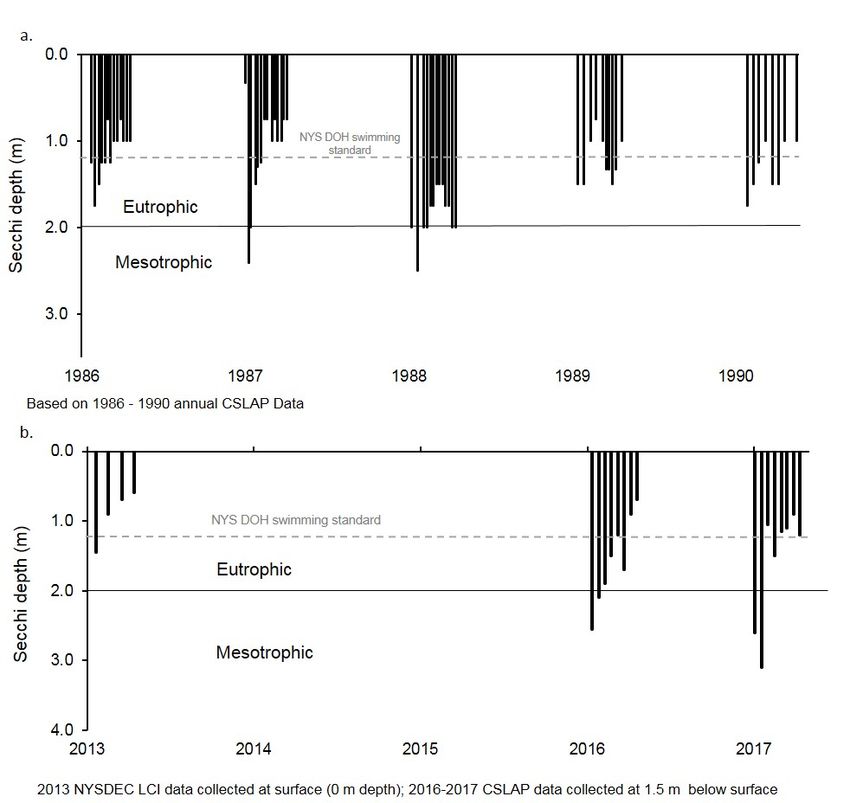
Intended audiences for this Action Plan are as follows:
   •   Members of the public interested in background information about the
       development and implications of the HABs program
   •   New York State Department of Environmental Conservation (NYSDEC), New
       York State Department of Health (NYSDOH), and New York State Department of
       Agriculture and Markets (NYSDAM) officials associated with the HABs initiative
   •   State agency staff who are directly involved in implementing or working with the
       NYS HABs monitoring and surveillance program
   •   Local and regional agencies involved in the oversight and management of Lake
       Carmel (e.g., Putnam County Soil and Water Conservation District (SWCD),
       Departments of Health (DOHs), New York City Department of Environmental
       Protection (NYCDEP), Lake Carmel Park District)
   •   Lake residents, managers, consultants, and others that are directly involved in
       the management of HABs in Lake Carmel.
Analyses conducted within this Action Plan provide insight of the processes that
potentially influence the formation of HABs in Lake Carmel, and their spatial extents,
durations, and intensities. Implementation of the mitigation actions recommended in this
HABs Action Plan are expected to reduce blooms in Lake Carmel.
1.3 Background
Harmful algal blooms in freshwater generally consist of visible patches of cyanobacteria,
also called blue-green algae (BGA). Cyanobacteria are naturally present in low numbers
in most marine and freshwater systems. Under certain conditions, including adequate
nutrient (e.g., phosphorus) availability, warm temperatures, and calm winds,
cyanobacteria may multiply rapidly and form blooms that are visible on the surface of
the affected waterbody. Several types of cyanobacteria can produce toxins and other
harmful compounds that can pose a public health risk to people and animals through
ingestion, skin contact, or inhalation. The NYSDEC has documented the occurrence of
HABs in Lake Carmel and has produced this Action Plan to identify the primary factors
triggering HABs events in Lake Carmel and to facilitate decision-making to minimize the
frequency, intensity, and duration of HABs.

6 | HABS ACTION PLAN – LAKE CARMEL
2. Lake Background 2.1 Geographic Location Lake Carmel is a 186-acre man- made lake located in the Town of Kent, Putnam County, New York, approximately 60 miles north-northeast of New York City (Figures 1 and 2). It is north of the hamlet of Carmel and its watershed comprises much of the southeast corner of the Town of Kent. 2.2 Basin Location Lake Carmel is located within the Lower Hudson River basin in southeastern New York, which encompasses most of Figure 1. Location of Lake Carmel within New York State. Westchester, Putnam, Orange, Ulster, Columbia and Albany Counties, much of western and central Dutchess, eastern Greene, and southern Rensselaer Counties, and smaller parts of New York (Manhattan), Bronx, Rockland, Sullivan, Schoharie, and Schenectady Counties. Land use within the watershed is dominated by forest (65%) and developed lands (22%) (see Section 10). Land use immediately surrounding the lake consists primarily of developed land. 7 | HABS ACTION PLAN – LAKE CARMEL
2.3 Morphology
The Lake Carmel watershed
has a direct drainage of 8,150
acres, excluding its surface
area (186 acres), and is 189 m
(619 feet) above mean sea
level (NYSDEC 2016). The
Lake is oriented north to south
(Figure 1), totaling
approximately 2,134 m (7,000
feet) in length with a shoreline
perimeter of approximately 7.2
km (4.5 miles). The width of the
lake at its widest point is 691 m
(2,266 feet). Lake Carmel has a
maximum depth of 4.3 meters
(14 feet) with an average depth
of 2.4 meters (7.9 feet) (CSLAP
2016). The lake’s surface area-
to-depth ratio is approximately
24:1, a relatively low value.
Lakes with smaller surface
areas are generally less
susceptible to turbulence
caused by wind and wave
actions, which makes them
more likely to experience
seasonal thermal stratification.
In addition, shallow lakes
generally experience significant
temperature fluctuations,
including elevated temperatures
during summer months that can
promote stratification and        Figure 2. Political boundaries within the Lake Carmel watershed.
favorable conditions for HABs.
Lake Carmel has three prominent lobes extending off the main body of the lake. The
northernmost lobe is bisected by NYS Route 311. Putnam County Route 46 bisects a
smaller lobe in the northeastern portion of the lake in the north-south direction. A third
lobe in the southern portion abuts NYS Route 52 to the west.
The wind rose in Appendix A indicates that a relatively strong prevailing wind direction
influencing Lake Carmel from 2006 to 2017 during the months of June through

8 | HABS ACTION PLAN – LAKE CARMEL
November were often from the southwest and south, as measured from the Danbury
Municipal Airport. This predominant wind pattern results in a fetch length of 2,000 to
7,000 ft given the north-south orientation of Lake Carmel. Given these wind patterns
during the growing season, buoyant cyanobacteria may accumulate in the eastern and
northeastern portion of Lake Carmel potentially impacting bathing beaches and other
recreational uses along the northeastern shoreline.
Typical of many reservoirs, Lake Carmel is part of a relatively large watershed (8,414
acres) compared to its lake area (192 acres). This higher watershed to lake area ratio
(44:1) is often associated with lower water retention times, as well as relatively high
sedimentation rates and land-based loading of phosphorus. Relatively high sediment
and phosphorus loading to Lake Carmel during storm events may create conditions that
increase the likelihood of a HAB event. Sedimentation rates and nutrient loads in
reservoirs do not tend to be uniform throughout the water body and are often higher in
deeper areas of the lake and areas of less water circulation. Sedimentation in the
deeper areas of Lake Carmel contributes to internal releases of phosphorus during
periods of stratification, ultimately leading to an increased likelihood of HABs.
2.4 Hydrology
Lake Carmel’s hydraulic retention time, or the amount of time it takes water to pass
through the lake, is estimated to be 0.1 years (CSLAP 2016). There are two main
tributaries to the lake, including a section of the Middle Branch of the Croton River from
topographically elevated marshlands approximately 0.5 miles to the north-northwest,
and Stump Pond Stream which originates from a series of ponds and lakes to the north.
A smaller unnamed tributary enters the lake from the southwest. Outflow from Lake
Carmel is conveyed eastward to a southern section of the Middle Branch of the Croton
River, which flows south and discharges downstream to the Middle Branch Reservoir.
The outlet is located just south of the middle of the lake on the east shore. There are no
inflow or outflow stream gauging stations to document flow in the tributaries of Lake
Carmel.
The location of the stream inflows and outflow may result in lower mixing and higher
hydraulic residence time in the southern portion of Lake Carmel, which may increase
sedimentation and nutrient concentrations in this portion of the lake. Potentially higher
nutrient concentrations in the south branch of Lake Carmel may increase the likelihood
of HABs in this area. HABs were observed at the beaches
(Figure 3) located in proximity to the south branch of the lake in 2016 and 2017.
2.5 Lake Origin
Developers Arthur and Warren Smadbeck created Lake Carmel atop primarily farmland
by damming the Middle Branch of the Croton River in 1928. At that time, the lake was
primarily used for recreational purposes with cottages and small homes built along the
shoreline. Lake Carmel takes its name from the nearby Carmel Hamlet.

9 | HABS ACTION PLAN – LAKE CARMEL
3. Designated Uses
3.1 Water Quality Classification – Lake and Major Tributaries
Lake Carmel is designated as a Class B waterbody under the New York Codes, Rules,
and Regulations (NYCRR). meaning it is best intended for contact recreation (i.e.,
swimming and bathing), non-contact recreation (i.e., boating and fishing), aesthetics,
and support of aquatic life. The primary uses of Lake Carmel are described in the
following sections, and the New York State classification system is provided in
Appendix B.
Stump Pond Stream, an inflowing tributary to the northeast, is identified as a Class C
water, indicating these waters are best used for fishing, fish propagation and survival.
Class C waterbodies also are suitable for primary and secondary contact recreation,
unless other factors limit the use for these purposes.
A section of the Middle Branch of the Croton River flows into Lake Carmel from the
north. Another section of the Middle Branch of the Croton River east of the lake receives
outflowing water. Both sections of the Middle Branch are identified as Class C waters.
The reaches of the Middle Branch of the Croton River adjacent to Lake Carmel are also
designated as trout spawning waters. The HABs conditions in Lake Carmel represent a
potential threat to water quality within these downstream uses, particularly those
associated with the resources that serve as potable water sources for the New York City
Watershed. Additional discussion is provided in Sections 3.2 and 3.7.
3.2 Potable Water Uses
Lake Carmel is a part of the Croton System of New York City water supply reservoirs
and is a tributary to the Middle Branch Reservoir. The Croton System supplies the City
with approximately 10% of its drinking water (NYC Water 2013). An agreement between
the New York City Department of Environmental Protection (NYCDEP) and the Croton
Watershed communities is in place to provide programmatic guidance and funding for
watershed protection (NYSDEC 2008). This connection between Lake Carmel and the
New York City water supply reservoirs contributed to Lake Carmel’s inclusion in the
Governor’s HABs initiative that led to the development of this HABs Action Plan.
The US Environmental Protection Agency (USEPA) sets health advisories to protect
people from being exposed to contaminants in drinking water. As described by the
USEPA: “The Safe Drinking Water Act provides the authority for EPA to publish health
advisories for contaminants not subject to any national primary drinking water
regulation. Health advisories describe nonregulatory concentrations of drinking water
contaminants at or below which adverse health effects are not anticipated to occur over
specific exposure durations (e.g., one-day, 10-days, several years, and a lifetime). HAs
are not legally enforceable federal standards and are subject to change as new
information becomes available.”

10 | HABS ACTION PLAN – LAKE CARMEL
Health advisories are not bright lines between drinking water levels that cause health
effects and those that do not. Health advisories are set at levels that consider animal
studies, human studies, vulnerable populations, and the amount of exposure from
drinking water. This information is used to establish a health protective advisory level
that provides a wide margin of protection because it is set far below levels that cause
health effects. When a health advisory is exceeded, it raises concerns not because
health effects are likely to occur, but because it reduces the margin of protection
provided by the health advisory. Consequently, exceedance of the health advisory
serves as an indicator to reduce exposure, but it does not mean health effects will
occur.
In 2015, the USEPA developed two 10-day drinking water health advisories for the HAB
toxin microcystin: 0.3 micrograms per liter (mcg/L) for infants and children under the age
of 6, and 1.6 mcg/L for older children and adults. (USEPA 2015). The 10-day health
advisories are protective of exposures over a 10-day exposure period to microcystin in
drinking water, and are set at levels that are 1000-fold lower than levels that caused
health effects in laboratory animals. The USEPA's lower 10-day health advisory of 0.3
mcg/L is protective of people of all ages, including vulnerable populations such as
infants, children, pregnant women, nursing mothers, and people with pre-existing health
conditions. The NYSDOH has used the health advisory of 0.3 mcg/L as the basis for
recommendations, and a do not drink recommendation will be issued upon confirmation
that microcystin levels exceeds this level in the finished drinking water delivered to
customers.
In 2015, the USEPA also developed 10-day health advisories for the HAB toxin
cylindrospermopsin. (USEPA 2015). Although monitoring for cylindrospermopsin
continues, it has not been detected in any of the extensive sampling performed in New
York State. New York State HAB response activities have focused on the blooms
themselves and microcystin given it is by far the most commonly HAB toxin found.
Water system operators should conduct surveillance of their source water on a daily
basis. If there is a sign of a HAB, they should confer with NYSDOH and NYSDEC as to
whether a documented bloom is known. The water system operator, regardless of
whether there is a visual presence of a bloom, should also be evaluating the daily
measurements of their water system. If there is any evidence—such as an increase in
turbidity, chlorine demand, and chlorophyll—then the water system operator should
consult with the local health department about the need to do toxin measurement. The
local health department should consult with NYSDOH central office on the need to
sample and to seek additional guidance, such as how to optimize existing treatment to
provide removal of potential toxins. If toxin is found then the results are compared to the
EPA 10-day health advisory of 0.3 µ/L, and that the results of any testing be
immediately shared with the public. NYSDOH also recommends that if a concentration
greater than the 0.3 µg/L is found in finished water, then a recommendation be made to
not drink the water. NYSDOH has templates describing these recommendations that

11 | HABS ACTION PLAN – LAKE CARMEL
water system operators and local officials can use to share results with customers.
Additionally, public water systems that serve over 3,300 people are required to submit
Vulnerability Assessment /Emergency Response Plans (VA/ERP); in situations where a
water system is using surface waters with a documented history of HABs, NYSDOH will
require water system operators to account for HABs in their VA/ERP (which must be
updated at least every five years).
3.3 Public Bathing Uses
According to the Lake Carmel Park District Beach Rules and Regulations, there are four
designated and regulated swimming beaches (#2, #3, #4, and #7) for Park District
residents and their guests (Figure 3). Beaches #5 and #6 are designated as recreation
only sites by the Park District, though, beach areas and life guard chairs are present at
both locations.

Figure 3. Lake Carmel Park District designated and regulated swimming beaches (Source: Town of
Kent). Note that north is to the right on this figure.

12 | HABS ACTION PLAN – LAKE CARMEL
As noted in Section 2.3, the prevailing wind patterns influencing Lake Carmel
(Appendix A) indicate that cyanobacteria may accumulate along the eastern shoreline
during HAB events, due to winds originating out of the west. Thus, swimming beaches
such as #4 in the northeastern portion and #2 and #3, which are located in the
southeastern portion of Lake Carmel, as well as the recreation only beach #5 may be
priority locations to monitor for HABs to limit negative effects on public health (Figure
3).
3.4 Recreation Uses
The primary uses at the lake include swimming, boating, fishing, and aesthetics, as
reported by watershed residents who attended a public meeting hosted by NYSDEC on
July 29, 2014 (NYSDEC 2016). Lake Carmel has seven public access points, including
the four designated swimming beaches, two non-regulated beaches (#5 and #6), and a
community center access location along the eastern shoreline. Motorboats and boats
greater than 20 feet in length are prohibited on Lake Carmel.
3.5 Fish Consumption/Fishing Uses
New York State fishing regulations are applicable in Lake Carmel for both regular
fishing and ice fishing. Fish stocking is not known to occur. There are no fish
consumption advisories specific to Lake Carmel (NYSDOH 2017), however, the lake is
included in the Hudson Valley/Capital district region fish consumption advisory, where it
is not recommended to consume more than 4 meals per month of fish.
3.6 Aquatic Life Uses
Lake Carmel, as a Class B waterbody, is suitable for the fish propagation and survival.
The lake supports a typical assemblage of warmwater fish species, several of which are
important recreationally and may be taken for consumption. These species include
largemouth bass (Micropterus salmoides), bluegill (Lepomis macrochirus), pumpkinseed
(Lepomis gibbosus), yellow perch (Perca flavescens), black crappie (Pomoxis
nigromaculatus), and common carp (Cyprinus carpio). The generally shallow depths
and warm waters of the lake are not conducive to sustaining populations of coldwater
fishes such as trout.
The Citizen Statewide Lake Assessment Program (CSLAP) is a cooperative volunteer
monitoring effort between NYSDEC and the New York Federation of Lake Associations
(FOLA). According to the CSLAP 2017 Lake Use Scorecard summary report for Lake
Carmel, the aquatic life use is identified as “supported/good”, indicating the general
absence of observable impacts to aquatic life despite habitat use being designated as
“threatened/fair”. Notable, however, is that in the 2008 revised Waterbody
Inventory/Priority Waterbodies List (WI/PWL) fact sheet for Lake Carmel, the aquatic life
use was identified as “stressed” based on non-specific impacts (NYSDEC 2008).
While reliable data of the fish populations in Lake Carmel are not known to be available,
the fish species reported coupled with the absence of observable impairment to the

13 | HABS ACTION PLAN – LAKE CARMEL
aquatic life use in the lake suggests that the fish assemblage and its potential cascading
regulating effects on lower trophic levels is not a driver for HABs formations in Lake
Carmel. However, the presence of common carp (Cyprinus carpio), an invasive cyprinid
in the lake that forages preferentially on benthic macroinvertebrates in lakebed
sediments, can increase sediment suspension and associated nutrients in the water
column based on its feeding behavior. The increased suspended sediment liberated by
the common carp’s benthic foraging mode contains nutrients that may be utilized by
blue green algae, potentially leading to HABs.

4. User and Stakeholder Groups
Access to Lake Carmel for recreational activities such as fishing, boating, and
swimming is restricted to homeowners with access rights and to guests. Portions of the
Lake Carmel shoreline not under private ownership are owned by the Town of Kent.
The Lake Carmel Park District is responsible for the adoption and administrative
enforcement of the rules, regulations, and provisions governing parks, playgrounds,
athletic fields, tennis courts, swimming pools, beaches, boardwalks, piers, docks, and
other recreational areas, open places, roadways, roads, paths, walks, and waters
owned or to be acquired by the Town of Kent. These rules and regulations cover
specific lake-related activities including access, permitting and registration, feeding of
waterfowl, fishing restrictions, and smoking in beach areas (Town of Kent 2018a).
The Kent Lake Association is local volunteer group concerned with the quality of nine
lakes, including Lake Carmel, in the Town of Kent. The goal of this association is to
engage in and discuss their collective knowledge and individual expertise of lake
conditions to identify and resolve common issues (Town of Kent 2018b).
As mentioned above, there is no public access to Lake Carmel, limiting the involvement
of non-governmental organizations (NGOs), sportsman groups, other organizations, and
other members of the public.

5. Monitoring Efforts
5.1 Lake Monitoring Activities
Sampling of Lake Carmel has been conducted as part of CSLAP from 1986-1990 and
then again in 2016 and 2017. Section 6 details the physical, chemical, and biological
condition of Lake Carmel based on data collected through the CSLAP program. HABs
monitoring has been conducted through CSLAP since 2013.
Lake Carmel was sampled in 2013 by the NYSDEC as part of the Lake Classification
and Inventory (LCI) Monitoring Program, conducted to support NYSDEC water quality
assessments and management activities. The LCI data set for Lake Carmel includes

14 | HABS ACTION PLAN – LAKE CARMEL
monthly water quality samples collected between June and September, and depth
profiles (0 to 2 meters) of temperature, pH, conductivity, and dissolved oxygen.
5.2 Tributary Monitoring Activities
No known programs are in place for monitoring Stump Pond Stream, one of the two
tributaries entering the lake from the north. The United States Geological Survey
(USGS) has provided an identifier number and name (“Stump Pond Stream at Mouth at
Kent Corners, NY”) for a stream monitoring site on Stump Pond Stream located just
upstream of its entry to Lake Carmel; however, on-line water quality data for this stream
site are not available (USGS 2018).
The section of the Middle Branch of the Croton River that discharges to Lake Carmel
from the north is monitored by the NYCDEP as part of its efforts to maintain water
quality protection of New York City’s water supply system. These monitoring efforts
include recording current conditions and providing a long-term record for trend analysis,
with a sample collection program focusing on TP, dissolved oxygen, turbidity, and
pathogens (as measured by fecal coliform levels). NYCDEP maintains one water quality
sampling station on the Stump Pond Stream between Lake Carmel and Stump Pond, an
18-acre pond located approximately 2.5 miles upstream of Lake Carmel (NYSDEC
2008).

6. Water Quality Conditions
Trends in water quality conditions were assessed using data from 1986 to 1990 and
2016- 2017 collected by CSLAP as well as the 2013 NYSDEC LCI data. Trend analysis
is challenging due to the large time gap in the available water quality data; however,
trends were evaluated using a nonparametric correlations coefficient (Kendall’s tau, τ)
to determine if time trends were significant (p-values less than 0.05). Water quality data
used in this analysis were limited to those that were collected under a State-approved
Quality Assurance Project Plan (QAPP), and analyzed at an Environmental Laboratory
Accredited Program (ELAP) certified laboratory. Note that long-term trends presented
below are intended to provide an overview of water quality conditions, and that
continued sampling will better inform trend analyses over time.
Table 1 provides a regional summary of surface total phosphorus (TP) concentrations
from Lake Carmel compared to New York State Lakes. In freshwater lakes, phosphorus
is typically the nutrient that limits plant growth; therefore, when excess phosphorus
becomes available from point sources or nonpoint sources, primary production can
continue unchecked leading to algal blooms. Note that the form of phosphorus is an
important consideration when evaluating management alternatives (Section 13).

15 | HABS ACTION PLAN – LAKE CARMEL
Table 1. Regional summary of surface total phosphorus (TP) concentrations (mg/L, ± standard
 error) for New York State lakes (2012-2017, CSLAP and LCI), and the average TP concentration
 (± standard error) in Lake Carmel (2016-2017).
                                                                               Average TP Lake
                               Number of Lakes        Average TP (mg/L)         Carmel (mg/L)
          Region
                                                                                2016 and 2017
 NYS                                 521                0.034 (± 0.003)                -
 NYC-LI                               27                0.123 (± 0.033)                -
 Lower Hudson                         49                0.040 (± 0.005          0.047 (± 0.005)
 Mid-Hudson                           53                0.033 (± 0.008)                -
 Mohawk                               29                0.040 (± 0.009)                -
 Eastern Adirondack                  112               0.010 (± 0.0004)                -
 Western Adirondack                   88                0.012 (± 0.001)                -
 Central NY                           60                0.024 (± 0.005)                -
 Finger Lakes region                  45               0.077 (± 0.022)                 -
 Finger Lakes                         11                0.015 (± 0.003)                -
 Western NY                           47                0.045 (± 0.008)                -

Regionally, the data provided in Table 1 indicate that the average TP concentration in
Lake Carmel is greater than the average concentration found throughout the Lower
Hudson region. Further, the average TP concentration is more than two times greater
than the New York State water quality guidance value of 0.02 mg/L, which suggests that
future management actions to protect water quality should likely focus on reducing TP
concentrations. Excessive inputs of phosphorus and nitrogen may result in the
formation of HABs when environmental conditions are suitable (see Section 9).
Water clarity (based on Secchi depth, m), TP (mg/L), and chlorophyll-a (µg/L)
concentrations are used to assess trophic state using New York State criteria (Table 2).
Based on water quality sampling in Lake Carmel in 2016 and 2017, these indicators
reflected eutrophic (high productivity) conditions.
 Table 2. New York State criteria for trophic classifications (NYSFOLA 2009) compared to
 average Lake Carmel values in 2016 and 2017 (CSLAP, ± standard error).
      Parameter          Oligotrophic         Mesotrophic         Eutrophic     Lake Carmel
                                                                                (2016-2017)
 Transparency (m)              >5                 2-5
6.1 Physical Conditions Water clarity can be related to the amount of suspended material in the water column including sediment, algae, and cyanobacteria. Lake Carmel has lower water clarity and higher nutrient and algae concentrations than other lakes in the Lower Hudson region (CSLAP 2016). Specific factors that appear to have contributed to this condition are provided in the following sections. Appendix A includes estimated wave heights in Lake Carmel from 2006 to 2017 during the months of June through November, wave heights and direction were modeled using wind speed and directions from the Danbiry Municipal Airport. The modeled wave heights indicated that the height of waves was generally greater in the northern and southern portions of the lake. Note that most estimated wave heights in Lake Carmel over this time period were less than or equal to 0.2 meters. Based on these estimates, an evaluation of the potential of re-suspension of lakebed sediments by waves indicated that for water depths greater than 1.2 meters (4 feet), re-suspension is unlikely to occur in an average year. Thus, most of the lake bed is generally not susceptible to re- suspension by waves. Water clarity, as represented by Secchi depth, has generally increased (τ = 0.286) over time (Figure 4) although this trend was not statistically significant (p = 0.322). Figure 4b shows a pattern of increased clarity from 2013 to 2016-2017. Early season (e.g., June) water clarity in Lake Carmel were greater than 2 m in 2016 and 2017 and then decreased to less than 2 m) throughout the remainder of the sampling months (Figure 4b). This seasonal trend in water clarity was observed in 2013, but water clarity remained less than 2 m throughout the growing season. Secchi disk transparency readings occasionally exceeded the 1.2-meter (4 feet) New York State Sanitary Code requirements for siting new bathing beaches (NYSDOH 2018). Such trophic indicators should continue to be monitored for any changes. 17 | HABS ACTION PLAN – LAKE CARMEL
Figure 4. (a) Historic (1986-1990) and (b) recent (2013, 2016, 2017) Secchi depth (m) measurements at
Lake Carmel.

Maximum water temperatures in Lake Carmel were between 25°C (77°F) and 30°C
(86°F) in all years sampled except for the 2017 sampling period where maximum water
temperatures were observed to be 24°C (75°F). No long-term trends in water
temperature were observed (p > 0.05). Typical seasonal variations in temperature are
shown for all sampling seasons (Figure 5). Temperature depth profiles conducted
during the LCI sampling in 2013 indicate that Lake Carmel was weakly stratified during
the months of June, July, and September (Figure 6). The absence of thermal
stratification in August indicates mixing in Lake Carmel during the growing season.
Additional temperature profiles collected in Lake Carmel will provide further
understanding into temperature-driven stratification and the overall mixing regime of the
lake. These temperature profiles could be compared to the patterns observed in 2013,
and be used to document and refine estimates of internal loading in Lake Carmel (when
coupled with dissolved oxygen profiles, see Section 6.2). Understanding temperature
changes within a waterbody seasonally, as well as annually, is important in

18 | HABS ACTION PLAN – LAKE CARMEL
understanding HABs. Most cyanobacteria taxa grow better at higher temperatures than
other phytoplankton which give them a competitive advantage at higher temperatures
(typically above 25°C) (Paerl and Huisman 2008).

Figure 5. (a) Historic (1986-1990) and (b) recent (2013, 2016, 2017) surface water temperature (°C) at
Lake Carmel.

19 | HABS ACTION PLAN – LAKE CARMEL
Figure 6. Temperature (°C) depth (m) profiles in Lake Carmel from June to September in 2013 (LCI).

6.2 Chemical Conditions
Dissolved oxygen (DO) profiles also indicate thermal stratification during summer, with
notable DO depletion observed at 2 meters depth and anoxic conditions (e.g., no
oxygen) measured in July 2013 (Figure 7). Thermal stratification during summer
effectively isolates the deeper water layers from atmospheric inputs of oxygen, creating
a finite pool of DO. Loading of organic matter to the deep layers and sediments of
productive lakes increases the consumption of the DO pool, resulting in a progressive
reduction in DO concentrations during summer stratification (Wetzel 2001).
The increase in DO at 2 meters depth and the corresponding decrease at the surface in
August 2013 (Figure 7) indicates a mixing event and breakdown of thermal
stratification. This is supported by the lack of a vertical gradient in the corresponding
August temperature profile (Figure 6). These temperature and dissolved oxygen
profiles suggest that summer thermal stratification is generally weak and temporary in
Lake Carmel. When mixing occurs, phosphorus accumulated in the bottom water layers
during periods of anoxia becomes available to support algal growth and potentially
HABs. Further data collection of the temperature and dissolved oxygen profiles in Lake
Carmel will provide insight into internal nutrient loading dynamics over time, and
indicate if this pattern observed in 2013 is typical.

20 | HABS ACTION PLAN – LAKE CARMEL
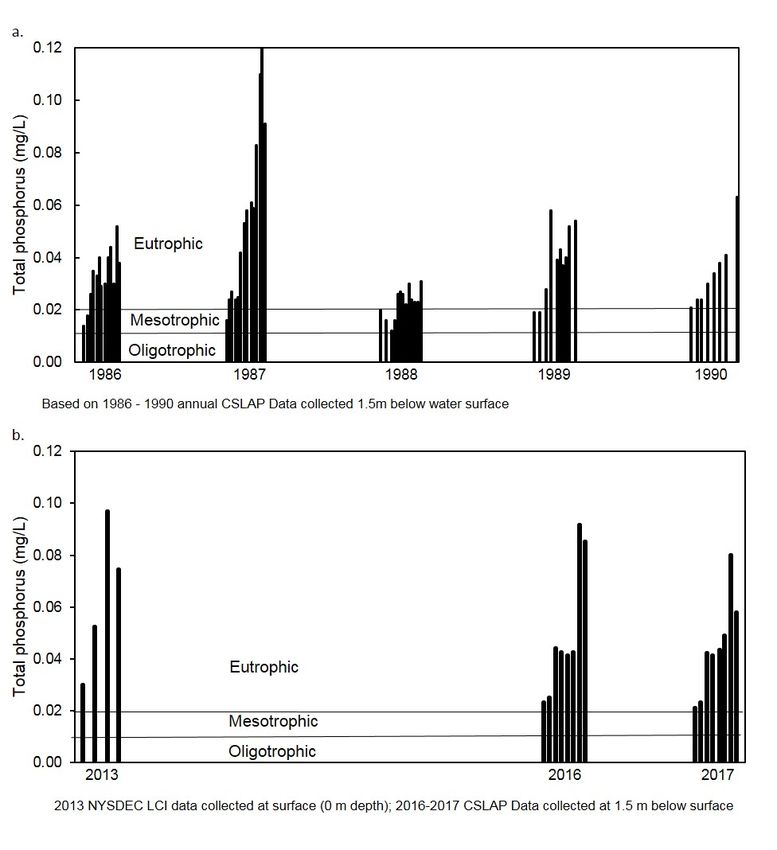
Figure 7. Depth (m) profile of dissolved oxygen (DO) concentrations (mg/L) in Lake Carmel from June to
September 2013 (LCI).

Average summer total phosphorus (TP) concentrations in Lake Carmel are indicative of
eutrophic conditions (concentrations >0.02 mg/L) (Figure 8). Trends in annual average
TP concentrations suggest a non-significant increase (p = 0.322, τ = 0.286) over time,
although, unusually high concentrations in 1987 may reduce the general increasing
trend in TP. For example, average TP concentrations in 2017 (0.045 mg/L) were 2-
times greater than in 1988 (0.023 mg/L). Seasonal trends in TP concentrations were
observed, with the lowest concentrations observed earlier in the growing season (June)
and maximum concentrations near the end of the growing season (August and
September). Large increases in TP concentrations in August and September of 2013
may be associated with lake mixing in August (as suggested by the temperature and
DO data). TP at the beginning of the growing season (June) approaches concentrations
of 0.01 mg/L. Maximum annual TP concentrations from 2013-2017 were between 0.08-
0.1 mg/L in all years sampled. Periods of increased TP concentrations in Lake Carmel
increase the likelihood of the occurrence of HABs (see Section 9).
Trends in total nitrogen (Figure 9a), based on average annual values, were not able to
be calculated due to limited data availability. Previous nitrogen concentrations indicate
eutrophic conditions (> 0.6 mg/L, Canfield et al. 1983). The sum of nitrate (NO3-) and
nitrite (NO2-) was greater in 2013 compared to 2016 (Figure 9b) and average ammonia
concentrations increased from 2016 (0.046 mg/L ± 0.01) to 2017 (0.11 mg/L ± 0.13).

21 | HABS ACTION PLAN – LAKE CARMEL
Figure 8. (a) Historic (1986-1990) and (b) recent (2013, 2016, 2017) total phosphorus (TP)
concentrations (mg/L) in Lake Carmel.

22 | HABS ACTION PLAN – LAKE CARMEL
Figure 9. (a) Total nitrogen (TN) and (b) ammonia and nitrite/nitrate concentrations (mg/L) in Lake
Carmel from 2013 (LCI), and 2016 to 2017 (CSLAP).

The relative concentrations of nutrients other than phosphorus may contribute to
cyanobacteria growth. Ratios of total nitrogen (TN) to total phosphorus (TP) in lakes can
be used as a suitable index to determine if algae growth is limited by the availability of
nitrogen or phosphorus (Lv et al. 2011). Cyanobacteria blooms are typically rare in
lakes where mass based TN:TP ratios are greater than 29:1 (Filstrup et al. 2016, Smith
1983). This is thought to occur because cyanobacteria can take up and use nitrogen
more efficiently than algae and thus be more competitive when nitrogen becomes
limiting. This ratio is higher than the ratio when nitrogen is the limiting nutrient (TN:TP
You can also read