MASTER PLAN - 2011 Economic Development Plan - Town of Newmarket - Newmarket NH
←
→
Page content transcription
If your browser does not render page correctly, please read the page content below

Town of Newmarket

   MASTER PLAN

          Chapter 6
Economic Development Plan

           2011
        186 Main Street
      Newmarket, NH 03857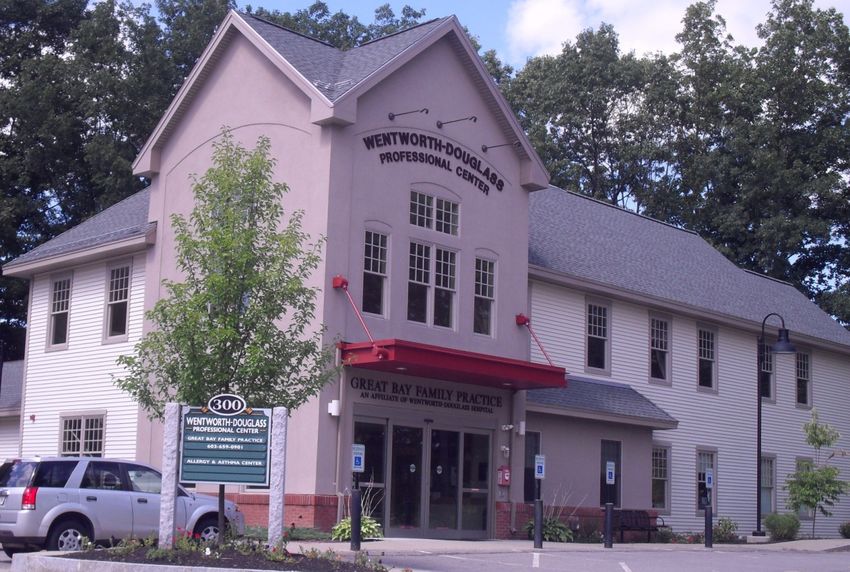
Town of Newmarket Master Plan, 2011
Chapter 6 Economic Development

                 Credits and Acknowledgements
The Economic Development Chapter was adopted by the Newmarket Planning Board on
August 9, 2011.

Members of the Newmarket Planning Board
John Badger, Chairman
Valerie Shelton, Vice Chairman
Peter Roy
Janice Rosa
Elizabeth C. Dudley
Justin Normand
Eric Botterman (Town Council Representative)
Adam Schroadter, Alternate
Frederick “Rick” McMenimen, Jr., Alternate
James Bergeron, Alternate to the Town Council, ex-officio

This Chapter was prepared by the Newmarket Planning Department with assistance from Mettee
Planning Consultants and the Economic Development Committee, which consisted of the fol-
lowing volunteers:

Economic Development Committee
John Badger, Planning Board Chairman
Peter Roy, Planning Board
Eric Botterman, Town Council
Adam Schroadter
Gerry O’Connell
Michael Provost
John Ahlgren
John Sexton, Russound Inc.
Ed Wojnowski, Town Administrator
Diane Hardy, Town Planner

The Newmarket Planning Board thanks the Economic Development Committee for its contribu-
tions, guidance and technical advice, which was invaluable to the development of this chapter of
the Town’s Master Plan.

                                                                                               i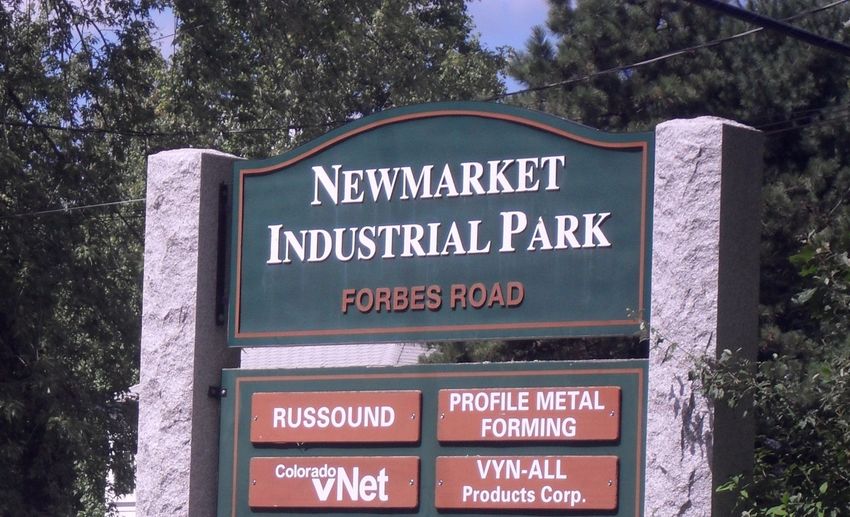
Town of Newmarket Master Plan, 2011
Chapter 6 Economic Development

                           Table of Contents
  Table of Contents

  List of Tables

  List of Figures

  A. Introduction

  B. Economic Goal and Objectives

  C. Economic Analysis
     1. Population
     2. Employment
     3. Major Employers
     4. Wages
     5. Median Family Income
     6. Unemployment
     7. Foreclosures
     8. Employment Projections
     9. Educational Attainment
     10. Location
     11. Commuting Patterns
     12. Primary Economic Nodes
     13. Water and Sewer
     14. Access and Transportation
     15. Assessed Valuation
     16. Local Taxes and Tax Rates

   D. Recent Economic Activity
      1. Downtown Revitalization
      2. Mill Redevelopment
      3. Other

   E. Challenges and Opportunities
      1. Challenges--Physical and Institutional
      2. Opportunities for Business
      3. Existing Areas for Business and Commercial Growth
      4. Current Infrastructure
      5. Community Revitalization Districts under NH RSA 79-E
      6. Other Opportunities for Economic Growth
      7. Organizations Involved in Economic Development

                                                                ii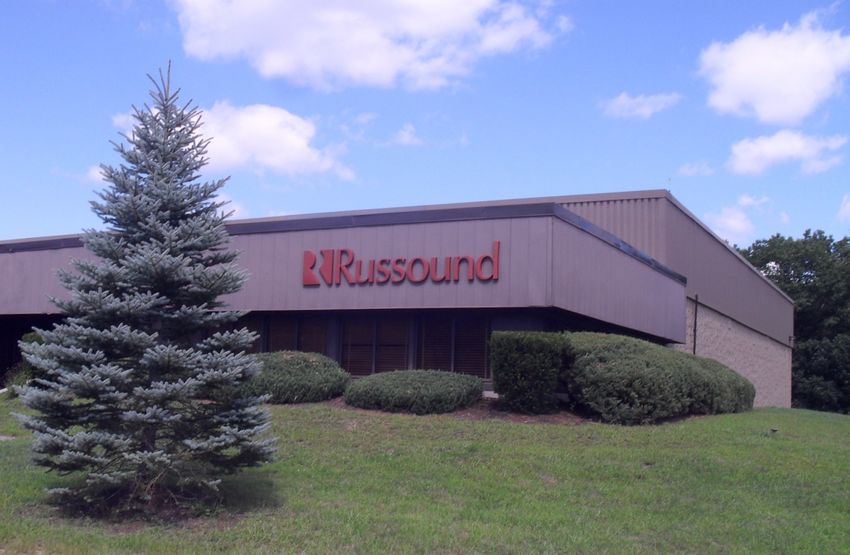
Town of Newmarket Master Plan, 2011
Chapter 6 Economic Development

   F. Action Plan

   G. Implementation Guide

References

Appendices

   Appendix A        Newmarket’s Assets and Liabilities
   Appendix B        Partners and Resources for Economic Development
   Appendix C        Tools for Economic Development
   Appendix D        Newmarket Businesses, 2010
   Appendix E        Commercial and Industrial Development since 2001

                                      List of Tables
6-1    Population Trends, 1980-2009
6-2    Population Projections, 2010-2030
6-3    Average Annual Covered Employment in Newmarket
6-4    Employment by Sector in Newmarket, 2009
6-5    Top Employers in Newmarket
6-6    Median Family Income
6-7:   Foreclosure Data for Newmarket, REDC Region, County, and New Hampshire
6-8    Unemployment, 2000 -2010
6-9    Long-Term Employment Projections for Rockingham County, 2008-2018
6-10   Educational Attainment
6-11   Miles from Newmarket
6-12   Commute to Work
6-13   Town Assessor Land Use by Value
6-14   Newmarket Property Tax Rate History, 2000-2009

                                  List of Figures

6-1    Population Change: 1970-2008
6-2    Population Age Distribution
6-3    Average Weekly Wages – Newmarket, Selected Occupations, 2009
6-4    Average Annual Unemployment Comparisons: 2000-2010
6-5    Newmarket in Relationship to the Region
6-6    Where Newmarket Residents Work
6-7    Where Workers in Newmarket Live
6-8    Downtown TIF District
6-9    Black Bear TIF District
6-10   Community Revitalization District under NH RSA 79E

                                                                                iii
Town of Newmarket Master Plan, 2011
Chapter 6 Economic Development

                                 A. Introduction
The State of New Hampshire and both Strafford and Rockingham Counties have seen substantial
economic change in the past ten years. During the early part of the decade, an economic boom
resulted in significant jobs and housing growth, increased commercial building and increased
individual buying power. By the end of the decade, the Seacoast experienced a serious economic
downturn that saw the downsizing of businesses, a slowdown in housing construction and sales,
and a high unemployment rate. More recently, the Seacoast area has experienced a mild eco-
nomic recovery, as demonstrated through rising employment and wages. Much of this growth
has tended to be in high paying technology employment and professional/management occupa-
tions. All of these changes have affected the economy of local communities, including Newmar-
ket.

Like the state and the Seacoast region, the town of Newmarket has undergone numerous changes
in the past decade, in terms of population growth, school enrollment, employment and income.
Although the unemployment rate crept up from a low in 2000 of 2.3% to 5.0% in 2010, for
Newmarket, it was still lower than Rockingham County or the state, both of which were above
6%. In addition, Newmarket’s full value tax rate of $20.51/ $1,000 of assessed valuation com-
pares favorably with surrounding communities and other communities in Strafford and Rocking-
ham Counties. Furthermore, its assessed valuation has increased significantly since 2000.

Once a strong manufacturing center, Newmarket lost much of its industrial base between 1960
and 1990, with the closure of several manufacturing operations resulting in the loss of significant
jobs, including those associated with United Technology, Suflex, and a furniture manufacturing
company. However, during the 1990’s and early 2000’s, the town experienced significant com-
mercial development on Route 108 south of the downtown, including the Irving Gas Station,
Brook’s Pharmacy, McDonald’s, and the Kent and Pelczar Funeral Home. The other substantial
commercial property in Newmarket consists of the buildings in the Newmarket Industrial Park
on Forbes Road off NH Route 108. The total assessed value of the property in this industrial
park amounts to approximately $7.36 million. Appendix E shows the extent of commercial and
industrial development in Newmarket since 2001.

Newmarket’s economic future will, in large part, be shaped by the Town’s commitment to eco-
nomic development activities. Such activities may include the maintenance and continued en-
hancement of the downtown business center and the development of suitable areas for new busi-
nesses or business expansion. Such efforts will have a positive impact on the Town’s tax base
and employment, as well as on its quality of life.

                                                                                                 4
Town of Newmarket Master Plan, 2011
Chapter 6 Economic Development

                  B. Economic Goal and Objectives
Pursuant to RSA 674:2, a Master Plan may include an “economic development section”, which
proposes actions to suit the community’s goals, given its economic strengths and weaknesses in
the region. As part of the master planning process, an Economic Development Committee was
formed, as a subcommittee of the Planning Board, and was charged with updating Chapter 6 of
the Master Plan. The Committee engaged in a brainstorming session in January 2010, which
identified the town’s assets and liabilities. Appendix A provides the full list, but, in summary,
the Committee identified several key assets:

   •   The historic character of the community and its quality of life, as exemplified by cultural
       and architectural resources, such as the historic downtown, quality open spaces and sce-
       nic views of the Lamprey River and Great Bay, the walkability of the downtown, the
       Heritage Festival and Farmer’s Market

   •   The link to the University of New Hampshire, with access to its academic and technical
       resources

   •   Good infrastructure, including public transportation, roads, water and sewer systems, ac-
       cess to major arterials such as NH Routes 4 and 101 and the interstate system

   •   A business friendly climate within a state with no sales or income tax and with some lo-
       cal resources for economic development, such as the Newmarket Community Develop-
       ment Corporation (NCDC)

   •   A very active and engaged citizenry, with many volunteer boards and organizations

Liabilities were also identified:

   •   Town’s location is somewhat “off the beaten path”

   •   The lack of readily available industrial sites with direct access, water and sewer

   •   Institutional disadvantages, such as the lack of an organizational structure within town
       government for economic development with staff and resources

From this process the following economic development strategy was formulated to guide future
planning efforts.

                                                                                                5
Town of Newmarket Master Plan, 2011
Chapter 6 Economic Development

Newmarket’s Economic Development Strategy

Goal
     The Town of Newmarket should work to retain its current businesses, while
     providing opportunities for economic growth and activities, which will strength-
     en the town’s economic base, provide employment for residents, and enhance its
     position in the regional economy.

Objectives
1.      Retain Newmarket’s existing business and industrial base.

2.      Encourage and attract development of new diversified business and industry con-
        sistent with the Town’s vision.

3.      Continue to revitalize downtown Newmarket.

4.      Initiate an economic development program to oversee economic development ac-
        tivity in Newmarket.

5.      Ensure Newmarket’s land use policies and regulations are consistent with the local
        economic development goal.

6.      Provide a level of public infrastructure and services, which enables economic de-
        velopment in a cost-effective manner.

7.      Support and expand opportunities for cultural activities, local arts, and tourism.

8.      Update and enhance Newmarket’s entrepreneurial and technology assets.

9.      Establish a regional approach to economic development activities.

10.     Identify new economic enterprises which residents and taxpayers want in Newmar-
        ket.

                                                                                             6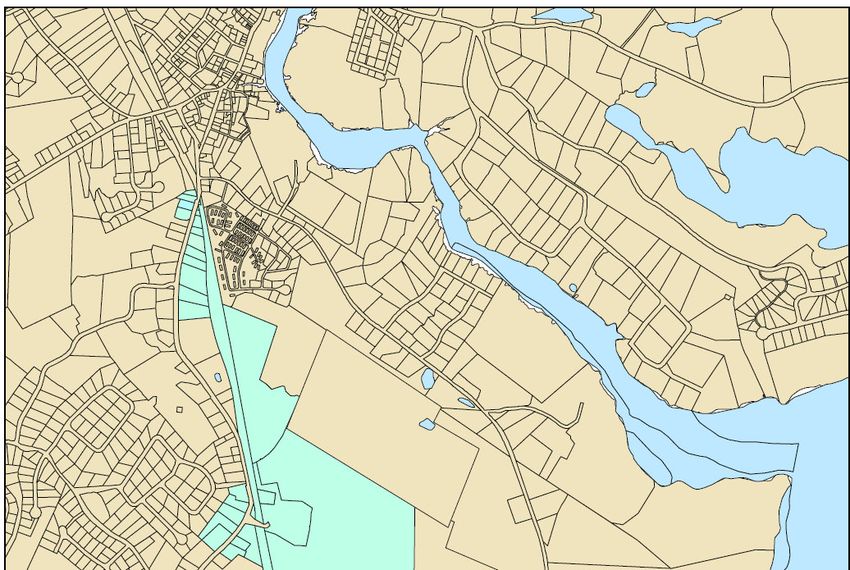
Town of Newmarket Master Plan, 2011
Chapter 6 Economic Development

                               C. Economic Analysis
Population—Newmarket has been growing at a greater rate than Rockingham
and Strafford Counties
Based on newly released data from the U.S. Census Bureau, Newmarket had a population of
8,936 in 2010, representing an increase of 909 persons, or 11.3% since 2000, and an increase of
1,779 persons since 1990, or a 24.9% increase over that 20-year period. (See Figure 6-1 and
Table 6-1. The biggest jump in population came during the period between 1980 and 1990
when Newmarket grew by 66.8%.

                              Figure 6-1. Population Change: 1970-2010
                10,000
                                                                            8,936
                  9,000
                                                               8,027
                  8,000
                                                   7,157
                  7,000

                  6,000
                  5,000                 4,290
                  4,000     3,361
                  3,000
                  2,000
                  1,000
                      0
                             1970       1980        1990        2000           2010

                 Source: U.S. Census Bureau, 1970-2010; N.H. Office of Energy and Planning, 2011.

By comparison, Newmarket grew more quickly than either Strafford or Rockingham Counties as
shown in Table 6-1.

Table 6-1: Population Trends, 1980-2010
 Population Trends
1980-2010
               1980      1990      % Increase 2000                 % Increase         2010      % Increase
                                   1980-90                         1990-2000                    2000-2010
Newmarket        4,290     7,157        67.0%   8,027                 11.3%             8,936       11%

 Strafford       85,408     104,233         22%         112,223           8%          123,143       10%
 County
 Rockingham      195,224    245,845         29%         277,359           11%         295,223       6%
 County
Source: U.S. Census Bureau and N.H. Office of Energy and Planning, 2011

                                                                                                          7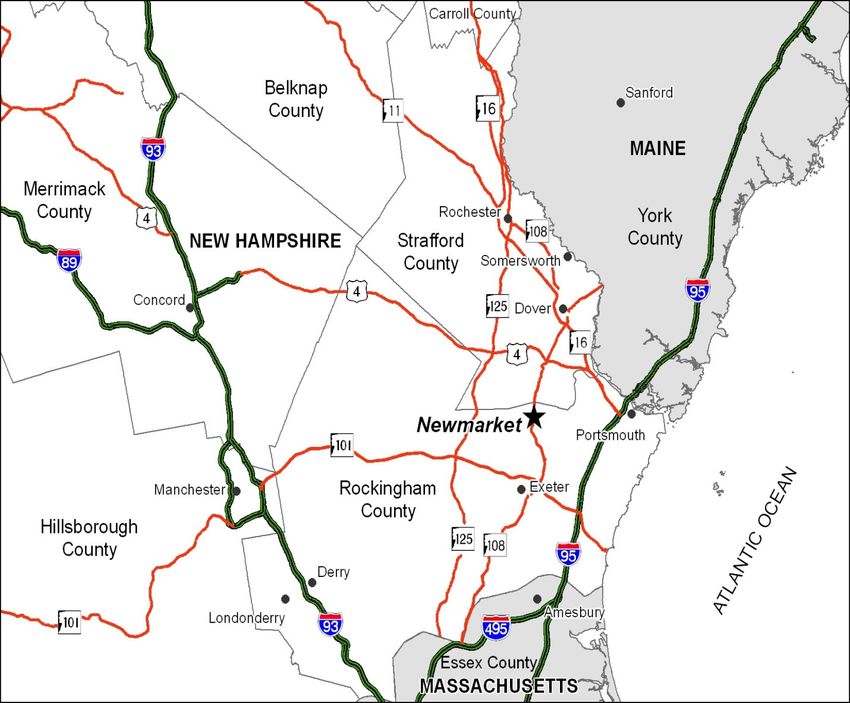
Town of Newmarket Master Plan, 2011
Chapter 6 Economic Development

Population projections for future growth of the community are provided by the New Hampshire
Office of Energy and Planning (NH OEP). Between 2010 and 2030 they predicted Newmarket’s
population would increase by 10%. Using the 2010 population as a base, by 2020 the population
will increase by 223 to 9,159 and to 9,864 by 2030, an increase of 928 as shown in Table 6-2.
By comparison Strafford County as a whole is expected to grow by 12% from 2010 to 2030 and
Rockingham County by 15% over this same period.

Table 6-2 Population Projections: 2010-2030
                                                                                        Increase   % Increase
                          2010       2015          2020        2025        2030        2010-2030   2010-2030

 Newmarket                  8,936      9,159        9,388       9,623          9,864       928       10%

 Strafford County**       123,143 124,469        128,712      133,224    137,863       14,720        12%

 Rockingham
                          295,223 308,256        317,621      328,253    339,421       44,198        15%
 County**

   Source: 2010 U.S. Census Bureau
       * NH OEP Planning Population Projections for Municipalities, 2007
       * * NH OEP Interim Population Projections for New Hampshire Counties, 2010

According to the U.S. Census Bureau, the largest age group in Newmarket is the age 35-54
group (29.3%), followed by the age 20-34 group (27.3%) and the age 5-19 group (15.3%). The
median age of Newmarket residents is 35.8, which is slightly lower than Strafford County at 36.9
and considerably lower than Rockingham County at 42.2 and the State of New Hampshire at
41.1.

Figure 6-2 Population by Age Group for Newmarket, Strafford County, Rockingham County
           and the State of New Hampshire 2010

    35.0%

    30.0%

    25.0%

    20.0%                                                                              Newmarket
    15.0%                                                                              Rockingham County
    10.0%                                                                              Strafford County
     5.0%                                                                              New Hampshire

     0.0%
              Under   Ages 5 to   Ages 20-     Ages 35    Ages 55   Ages 65
              Age 5      19         34          to 54      to 64    and over

Source: US Census Bureau, American Community Survey 2010

                                                                                                           8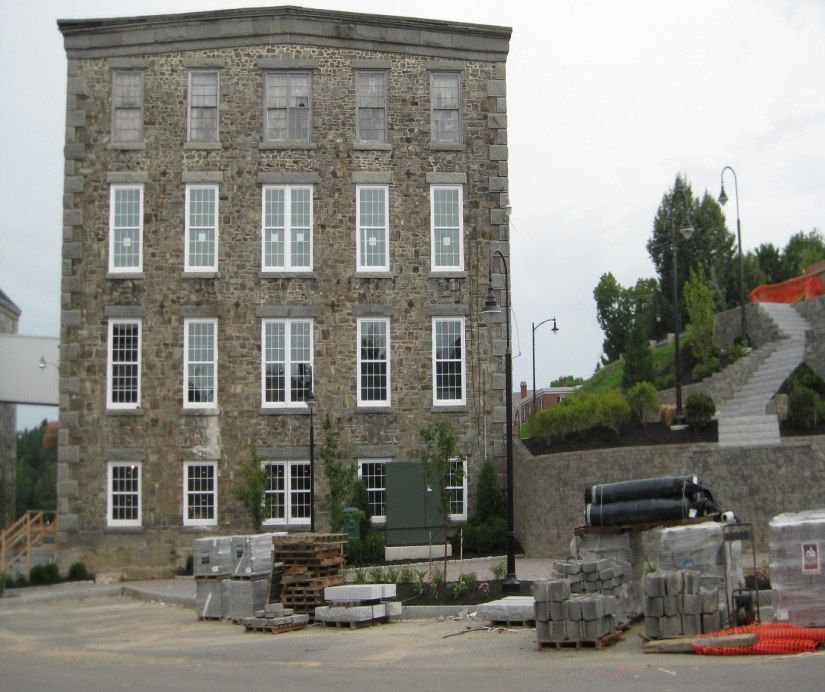
Town of Newmarket Master Plan, 2011
Chapter 6 Economic Development

Employment—More firms, but fewer jobs since 2000

                             Based on estimates provided by the New Hampshire Department
    According to 2010 data
                             of Employment Security, Newmarket’s employment base in
    from the NH Economic     2009 was approximately 1,269 jobs. (See Table 6-3.) Between
    and Labor Market Infor-  2000 and 2009, Newmarket’s total employment base declined by
    mation Bureau, Newmar-   26%, representing a loss of 458 jobs. This decline was felt solely
    ket has a labor force of within the private sector, as public sector employment actually
    6,245 and an unemploy-   increased by 71 employees over that same period. The largest
                             job losses were in manufacturing (374 jobs), construction (54
    ment rate of 5.0 %.
                             jobs), and arts and entertainment (60 jobs). On the other hand,
                             the number of private businesses increased slightly from 130 to
                             142 over this same period, indicating, while there may be more
firms in Newmarket, the number of employees per firm generally is less.

           Table 6-3: Average Annual Covered Employment in Newmarket1
                                                     2000            2005         2009
            Number of Private Businesses                130            149         142
            Number of Employees                       1,480          1,210         924
            Average Annual Weekly Wage                 $543           $665        $771
            Number of Public Entities                    7               7            6
            Number of Employees                        274             321         345
            Average Annual Weekly Wage                $513           $ 642        $756
            Total Employment                         1,754           1,531        1,269
            Source: NH Employment Security 2009

                            Workers at the Silk Mill in Newmarket 1903-1907
                                Source: Newmarket Historical Society

1
 Covered employment is defined as all employment except those workers who are self-employed. Wage data has
not been corrected to account for inflation.
                                                                                                             9
Town of Newmarket Master Plan, 2011
Chapter 6 Economic Development
Table 6-4 provides the overall employment distribution by sector in Newmarket for 2009. The
largest employment sectors are educational services (232 jobs or 20.6%), manufacturing (173
jobs or 15.4%) and health care and social assistance (171 jobs or 15.2%). In spite of the loss of
jobs over the past decade, manufacturing still represents a significant sector in Newmarket’s
economy.
Table 6-4: Employment by Sector in Newmarket, 2009
# of
Employment Sector Employees %
1 Accommodations and Food Services 105 9.3
2 Administrative and Waste Services 43 3.8
3 Educational Services 232 20.6
4 Finance and Insurance 20 1.8
5 Health Care and Social Assistance 171 15.2
6 Manufacturing 173 15.4
7 Other Services (except Public Administration) 53 4.7
8 Professional and Technical Services 70 6.2
9 Public Administration 101 9.0
10 Real Estate, Rental and Leasing 35 3.1
11 Retail Trade 110 9.8
12 Transportation and Warehousing 12 1.1
Total all Industries 1125 100.0
Source: NH Department of Employment Security 2009
Major Employers
There are over 150 businesses in Newmarket. These range in size from small retail businesses
on Main Street to moderately sized manufacturing plants in the Newmarket Industrial Park. Ta-
ble 6-5 is a listing of the top five major employers in Newmarket. A list of Newmarket busi-
nesses is presented in Appendix D and a list of commercial and industrial development that has
occurred in Newmarket since 2001 is illustrated in Appendix E.
Table 6-5: Top Employers in Newmarket
Business Product Employees
Russound Inc. Audio, video 160
SAU 31 School District 242
Town of Newmarket Municipal Services 163
Lamprey Health Care Medical services 67
Seacoast Sports Clubs at Great Bay Physical Fitness 47
Source: Planning Department Survey 2011
10Town of Newmarket Master Plan, 2011
Chapter 6 Economic Development
Wages—In spite of job losses, wages are increasing
As shown in Table 6-3, despite a decline in jobs in the private sector, annualized average weekly
wages increased by $228, or 42%, in the private sector. Although the public sector had a slightly
lower average wage in 2009 ($756 versus $771 in the private sector), wage gains over this period
kept pace, with an increase of $243 or 47%.
Figure 6-3 shows the range of average weekly wages for selected occupations in 2009, with Pro-
fessional/Technical occupations receiving over $1,300 per week while Accommodations/Food
Services employees received only $272 per week.
Figure 6-3: Average Weekly Wages–Newmarket, Selected Occupations, 2009
$1,321
$1,400
$1,146
$1,200
$1,000
$708 $726
$800
$630
$600
$400 $272
$200
$0
Source: NH Department of Employment Security, Economic and Labor Market Information Bureau
11Town of Newmarket Master Plan, 2011
Chapter 6 Economic Development
Median Family Income—Based on HUD regional data
Another measure of Newmarket’s economic strength is median family income. In the off-census
years, this data is compiled by U.S. Department of Housing and Urban Development (HUD) by
regions or counties. Newmarket is within the Portsmouth-Dover-Rochester HUD Fair Market
Rent Area (HFMA) for median family income data. Similar to wage trends, the median family
income in the HFMA rose by 15% from $70,900 to $81,600, a bigger jump than the state as a
whole. (See Table 6-6.) The regional median family income is also now higher than the state’s.
Table 6-6 Median Family Income
2007 2010 Change % Change
Portsmouth - Dover- Rochester
HMFA $70,900 $81,600 $10,700 15.1%
State of New Hampshire $71,200 $78,000 $ 6,800 9.6%
Source: New Hampshire Housing Finance Authority, HUD Adjusted Median Family Income, 2007-2010
Foreclosures
Real Data Corporation publishes summaries of New Hampshire real estate sales and other public
records. This includes foreclosure data for Rockingham County and the state of New Hamp-
shire. Table 6-7 shows the number of annual foreclosed deeds for Newmarket, the Comprehen-
sive Economic Development Strategy (CEDS) region is the Regional Economic Center of South-
ern New Hampshire (REDC), its sub regions, the county, as well as state wide.
Table 6-7: Foreclosure Data for Newmarket, REDC Region, Rockingham County, and
New Hampshire
Year-to-Year Change % of 2010 Housing
Stock
Town/Area 2008 2009 2010 2008- 2009- 2008- 2009- 2008 2009 2010
2009 2010 2009 2010
Newmarket 16 15 27 -1 12 -6.25 80.0%
0.4% 0.4% 0.7%
CEDS 172 156 181 -16 25 -9.3 16.0%
0.4% 0.3% 0.4%
Eastern Towns 1.
CEDS 300 278 343 -22 65 -7.3 23.4% 0.8% 0.7 0.9%
Central Towns 2.
CEDS 753 630 715 -123 85 -16.3 13.5% 0.7% 0.6% 0.7%
Western Towns 3.
CEDS Region 1225 1064 1239 -161 175 -13.1 16.4% 0.6% 0.6% 0.7%
Rockingham 805 686 820 -119 134 -14.8 19.5% 0.6% 0.4% 0.6%
County
New Hampshire 3563 3467 3953 -96 486 -2.7 14.0% 0.6% 0.6% 0.6%
Source: Real Data Corporation compiled by the New Hampshire Housing Finance Authority, 2010
2010 Housing Stock data from the US Census Bureau
1. CEDS Eastern Towns: East Kingston, Exeter, Greenland, Hampton, Hampton Falls, Kensington, New Castle, Newfields,
Newington, Newmarket, North Hampton, Portsmouth, Rye, Seabrook, South Hampton, and Stratham.
2. CEDS Central Towns: Atkinson, Auburn, Brentwood, Candia, Chester, Danville, Deerfield, Epping, Fremont, Hampstead,
Kingston, Newton, Northwood, Nottingham, Plaistow, Raymond, and Sandown.
3. CEDS Western Towns: Derry, Hudson, Litchfield, Londonderry, Merrimack, Nashua, Pelham, Salem, and Windham.
12Town of Newmarket Master Plan, 2011
Chapter 6 Economic Development
In 2010, Newmarket had 27 out of the 820 foreclosures in Rockingham County and 27 out of the
3953 in the state. During the 2008-2009 time period, Newmarket, along with other communities
in eastern CEDS region fared better than the rest of Rockingham County and the state. However,
with the significant increase in the number of foreclosures in 2009-2010, the town’s foreclosure
rate overall was comparable to the CEDS region as a whole in the year 2010, and slightly worse
than the state’s and the rest of Rockingham County. According to the 2011 Rockingham
Comprehensive Economic Development Strategy (CEDS), six communities in the region (Deer-
field, Epping, Fremont, Raymond, Sandown and Kensington) experienced a foreclosure rate of
1% or greater. When compared to other communities, the number of foreclosures in Newmarket
is small given the number of housing units, especially during a significant downturn in the na-
tional economy, which suggests Newmarket has weathered the recession better than others.
Unemployment—From 2.3% in 2000 to 5.0% in 2010
Another measure of the health of the local and regional economy is the rate of unemployment.
Based on data from the New Hampshire Department of Employment Security since 2000 and
shown in Table 6-8, Newmarket’s annualized unemployment rate has increased from 2.3% (its
lowest rate in the decade) to 5.0% with a significant jump between 2008 and 2010.
Table 6-8: Unemployment, 2000 -2010
2000 2002 2004 2006 2008 2010
Newmarket 2.3% 4.1% 3.1% 2.9% 3.1% 5.0%
Rockingham County 3.0% 5.5% 4.7% 3.9% 4.2% 6.3%
State of New Hampshire 2.7% 4.5% 3.9% 3.5% 3.8% 6.1%
Source: NH Department of Employment Security
Similar increases in unemployment occurred for both the county and state. Throughout the decade
Newmarket has fared better than both Rockingham County and the state with its current rate a full
percentage point lower than the State’s and 1.3% lower than the county’s (See Figure 6-4.)
Figure 6-4: Average Annual Unemployment Comparisons: 2000-2010
8.0
7.0
Unemployment Rate %
6.0
5.0 State of New
Hampshire
4.0
Rockingham County
3.0
Newmarket
2.0
1.0
Source: New Hampshire
0.0 Department of Employment
2000 2001 2002 2003 2004 2005 2006 2007 2008 2009 2010 Security
13Town of Newmarket Master Plan, 2011
Chapter 6 Economic Development
Employment Projections—Biggest gains in the service sector
The NH Department of Employment Security recently completed projections of employment for
each county for the period of 2008 to 2016. For Rockingham County, employment is expected
to grow to 15,655 jobs. Table 6-9 shows projections of employment by the North American In-
dustry Classification System (NAICS). The businesses that are expected to provide the greatest
gains in employment are the service industry, professional, scientific and technical services,
health care, and social assistance. Manufacturing and utilities are expected to lose jobs.
With just over 1,260 private sector employees, Newmarket comprises less than 1% of the coun-
ty’s employment. Economic change affecting the entire region, will also affect Newmarket. Em-
ployment in Newmarket will likely increase at a rate similar to that of the region, or by 10-11%,
by the year 2018. It is estimated the greatest proportion of growth will be in the private sector.
The fluctuations experienced in Newmarket since 2000 have mirrored the regional and state
economy, although Newmarket has generally experienced lower unemployment, as shown in
Figure 6-4. This relative stability is the result of a strong employment market in the Seacoast.
However, with a relatively small number of local businesses, the addition or loss of only a few
can have a significant effect on total employment numbers.
Newmarket Mills circa 1912
Source: Newmarket Historical Society
14Town of Newmarket Master Plan, 2011
Chapter 6 Economic Development
Table 6-9: Long-Term Employment Projections for Rockingham County, 2008-2018
NAICS Estimated Projected 2008-2018 Change
Code Industry 2008 2018 Numeric Percent
Total Employment (incl. Self-employed) 151,329 166,984 15,655 10.3%
101 Goods Producing Industries 22,409 22,829 420 1.9%
11 Agriculture, Forestry, Fishing and Hunting 243 252 9 3.7%
21 Mining 154 174 20 13.0%
23 Construction 6,402 7,240 838 13.1%
31-33 Manufacturing 15,610 15,163 -447 -2.9%
102 Service Providing Industries 116,646 131,009 14,363 12.3%
22 Utilities 1,062 908 -154 -14.5%
42 Wholesale Trade 6,724 7,381 657 9.8%
44-45 Retail Trade 25,075 26,453 1,378 5.5%
48-49 Transportation and Warehousing 4,910 5,305 395 8.0%
51 Information 2,715 3,043 328 12.1%
52 Finance and Insurance 5,451 5,760 309 5.7%
53 Real Estate and Rental and Leasing 1,838 2,022 184 10.0%
54 Professional, Scientific, and Technical Services 7,235 8,911 1,676 23.2%
55 Management of Companies and Enterprises 2,383 2,559 176 7.4%
56 Administrative and Waste Management Services 8,327 9,866 1,539 18.5%
61 Educational Services 11,195 12,629 1,434 12.8%
62 Health Care and Social Assistance 14,152 18,049 3,897 27.5%
71 Arts, Entertainment, and Recreation 2,925 3,535 610 20.9%
72 Accommodation and Food Services 12,233 13,393 1,160 9.5%
81 Other Services (Except Government) 4,524 5,008 484 10.7%
Government 5,897 6,187 290 4.9%
Self-employed and Unpaid Family Workers 12,274 13,146 872 7.1%
NOTE: 1 Employment for public schools and colleges is included in sector 61, Educational Services
Source: New Hampshire Department of Employment Security
Educational Attainment—Newmarket citizens have relatively high ed-
ucational attainment
As shown in Table 6-10: Educational Attainment, Newmarket compares well to Strafford and
Rockingham Counties and the state for educational attainment. In 2000, for individuals over 25
years, over 91% had a high school diploma compared to a little over 90% for Rockingham Coun-
ty and just about 87% for Strafford County and the state. Similarly for college or higher educat-
ed individuals, Newmarket has a higher percentage than the other jurisdictions. Based on the
American Community Survey data for 2005-2009, this trend continued with a large increase in
college or higher educated individuals in 2005-2009 from 32.9% to 42%. For employers, this
indicates Newmarket has a highly educated workforce to fill a wide variety of skilled technical
15Town of Newmarket Master Plan, 2011
Chapter 6 Economic Development
and professional jobs. For the Town government and non-profit agencies, it indicates a pool of
volunteers and leaders available to assist with community functions.
Table 6-10: Educational Attainment*
Rockingham Strafford
Educational Level Newmarket County County New Hampshire
2005- 2005- 2005- 2005-
2000 2009 2000 2009 2000 2009 2000 2009
High School graduate
or higher 91.3% 95.6% 90.5% 93.0% 86.4% 89.2% 87.4% 90.5%
Bachelor's Degree or
higher 32.9% 42.0% 31.7% 36.0% 26.4% 29.4% 28.7% 32.4%
Source: U.S. Census Bureau 2000, American Community Survey (ACS) 5 year Estimates 2005-2009
*For population 25 years and older.
Location – Newmarket is easily accessible
Newmarket is located in Rockingham County in southeastern New Hampshire. It is easily ac-
cessible from Routes 4, 108, 125, 33, 101 and Interstate 95. Its location ties it primarily to the
Portsmouth/Dover/Rochester Metropolitan Statistical Area (MSA). Its influence extends south to
Exeter, east to Greenland and west to Route 125. Figure 6-5 shows Newmarket in relation to the
various centers within the region.
Figure 6.5: Newmarket’s Relationship to the Region
Source: Strafford Regional Planning Commission, 2011
16Town of Newmarket Master Plan, 2011
Chapter 6 Economic Development
Commuting Patterns – Over 80% of commuters drive to work
Commuters working in other communities are likely to travel to specific destinations within a
50-mile radius of Newmarket. Table 6-11 identifies regional employment centers, the distance
from Newmarket and notable employment opportunities
Table 6-11: Miles from Newmarket to Nearby Cities
Boston, MA 58 Major regional employment center—financial, professional
and banking
Concord, NH 40 State capital; government and legal center
Dover, NH 9 Major medical center and major insurance company
Durham, NH 4 University of New Hampshire
Exeter, NH 8 Medical Center; Phillips Exeter Academy
Manchester, NH 36 Largest NH city; multiple businesses
Portsmouth, NH 14 Portsmouth Naval Shipyard, professional services finance,
commercial and tourism
Table 6-12 displays how Newmarket, Strafford Region, and state residents traveled to work in
2009. As a whole, Newmarket residents used their cars for commuting more than residents from
surrounding towns (except for Epping), and the Strafford Region. Newmarket residents did use
cars slightly more than state residents on average. It appears a large majority of workers travel to
work by car, mostly to other Seacoast communities. Newmarket workers also tend to use other
means of commuting less than other workers in nearby communities and the state. Relatively few
residents work at home. Newmarket residents, who did commute, traveled a similar distance as
the average resident in Strafford County and the state and much less than the average Epping res-
ident, but much more than the average Durham resident. With 28% of Newmarket residents
commuting within and to Newmarket and Durham, it would seem more people might take ad-
vantage of the COAST and Wildcat public transportation systems.
Table 6-12: Commute to Work
Work Average
Car Public at Travel Time
Car Pool Transit By Foot Other Home (min)
Newmarket 83.3% 8.2% 0.9% 0.9% 2.0% 4.6% 28.4
Durham 55.3% 9.6% 6.1% 23.4% 2.1% 4.5% 17.9
Lee 78.3% 5.0% 1.6% 4.1% 2.0% 8.9% 25.0
Epping 84.8% 7.9% 0.7% 1.6% 0.5% 4.5% 35.8
Newfields 81.4% 4.1% 1.1% 2.1% 1.9% 9.4% 26.0
Strafford Region Average 77.5% 11.7% 1.6% 4.5% 0.7% 3.9% 25.1
State of New Hampshire 81.5% 8.6% 0.7% 3.2% 1.2% 4.8% 25.4
Source: 2005-2009 American Community Survey US Census Bureau
17Town of Newmarket Master Plan, 2011
Chapter 6 Economic Development
Eighteen percent (18%) of Newmarket residents who are in the labor force work in Newmarket.
Another eighteen percent (18%) work in Portsmouth. (See Figure 6-6.) Most of the remaining
employees work in nearby Seacoast communities while thirteen percent (13%) work in either
Massachusetts or Maine.
Figure 6-6: Where Newmarket Residents Work
Percentage of Newmarket Residents Who Work In:
1% Other States
7% MA
6% ME 18% Newmarket
27% Other
Seacoast Towns
18% Portsmouth
13% Exeter
10% Durham
Total Workers = 3,973
Source: US Census Bureau, 2000 and NH Office of Energy and Planning
This represents the most recent and best available data
18Town of Newmarket Master Plan, 2011
Chapter 6 Economic Development
Forty-nine percent (49%) of the Newmarket workforce is drawn from within the town as shown
in Figure 6-7. The next highest number of commuters comes from Dover at 10%. Most other
workers come from Seacoast communities with a small number from Maine (5%) and Massa-
chusetts (2%). Another 2% come from other states.
Figure 6-7: Where Workers in Newmarket Live
Percentage of Commuters Who Work in Newmarket
2%MA 2% Other
States
5% ME
20% Other 49%
Seacoast Newmarket
Communities
5% Lee
7% Exeter
10% Dover
Total Commuters = 1022
Source: 2000 US Bureau of Census
The represents the most recent and best available data
19Town of Newmarket Master Plan, 2011
Chapter 6 Economic Development
Primary Economic Nodes
Downtown Newmarket
Newmarket’s central business district is primarily zoned as M-2, a mixed-use zone, and M-1, a
mill district zone. The mill district consists of only about 12 acres that encompass the mill build-
ings, portions of which are used for residential use (Bryant Rock and Rivermoor Landing) and
mixed commercial/residential use (Newmarket Mills). Constructed in the 1800’s, the mills have
held a prominent place in the history of Newmarket. Their redevelopment has been a primary
goal of the Town under the direction of the Newmarket Community Development Corporation
(NCDC). The Newmarket Mills are located on the banks of the Lamprey River and the area has
been designated a Tax Increment Finance (TIF) District. The mills are also part of a historic dis-
trict, which is listed on the National Register of Historic Places.
Route 108 Corridor
This area includes most of the commercial properties along Route 108 north and south of the
downtown except for some existing residential properties at the base of Great Hill and south to
Forbes Road. This area is in the B-1 (General Business) Zoning District. Much of this area is
currently developed with a mixture of residential and business uses, especially south of the rail-
road crossing as described in Section A. Introduction. There are also several undeveloped par-
cels along this corridor, including one adjacent to the Newmarket self storage facility and anoth-
er one adjacent to the Seacoast Sports Club.
North of the downtown, there is also a mix of residential and business activities. There are a
number of auto service related enterprises, as well as professional offices, a laundromat, and a
hardware store. There are also several undeveloped parcels along this corridor, including one at
3 North Main Street and the vacant parcel across from the bowling alley. In 2003, the Town
adopted new zoning provisions for properties fronting on sections of NH Route 108 to promote
appropriate infill development and greater opportunities for mixed-use development.
Newmarket Industrial Park
This 25 + acre industrial park ex-
tends from Route 108 on the west
to New Road on the east and is
separated into two parcels by the
Pan Am Railway line. Highway
access to the site is by means of
New Hampshire Route 101 from
the west and east, Interstate Route
95 from the south and N.H Route
108 from the north.
Newmarket Industrial Park
Source: Newmarket Planning Department
20Town of Newmarket Master Plan, 2011
Chapter 6 Economic Development
The area was previously a sand and gravel pit, from which significant amounts of materials were
removed.
Newmarket Industrial Park, 2011
Source: Newmarket Planning Department
The Industrial Park was originally developed in the early 1980’s to attract “small, clean” indus-
trial facilities to the town. At present, there are four business enterprises in the Newmarket In-
dustrial Park-Russound Inc., Vyn-All, and Profile Metal Forming. There are five buildings, two
of which are fully occupied by Russound Inc. All of the lots within the Industrial Park west of
the Pan Am Railroad right-of-way have been developed and the Town has been pursuing the de-
velopment of the eastern portion of the Industrial Park, in the area which has become known as
the Black Bear Commercial and Industrial Business Park.
Water and Sewer
Newmarket is serviced by a water and sewer system that covers most of the area around the
downtown extending from the Durham town line in the north, to the Newmarket Industrial Park
to the south and west, to include most of the R-3 residential zone. Additionally, there is one
small area at the end of Cushing Road, on Great Bay at Moody Point, which is served by sewer.
Well functioning water and sewer systems are critical to economic growth and development in
Newmarket.
21Town of Newmarket Master Plan, 2011
Chapter 6 Economic Development
Sewer
At present, the wastewater treatment facility has an annual flow of approximately 580,000 gal-
lons per day (gpd). The Town’s National Pollutant Discharge Elimination System (NPDES)
permit allows for 850,000 gpd, or a 270,000 gallon excess capacity. A recent 20-year build-out
study was conducted, by the Town, to determine what, if any, additional sewer capacity might be
required. Based on the current rate of growth, the available land area (net buildable area) and
development density based on current zoning, it was determined that approximately 905,000 gal-
lons of capacity might be required, approximately 55,000 gallons greater than what is currently
permitted.
Much of the equipment at the treatment facility has exceeded its expected useful life and obtain-
ing replacement and repair parts is difficult. In the near future, the discharge permit limits for
the wastewater treatment plant are going to become more stringent as a result of water quality
problems in Great Bay. The existing facility won’t be able to meet those new limits. The Town
plans to move ahead with a new wastewater treatment plant upgrade and improvements to two of
the Town’s pumping stations.
Water
Newmarket’s public water system serves approximately 5,000 of the town’s residents and has
approximately 2,000 water service connections. The water system withdraws water from two
groundwater sources: the Bennett and Sewell Wells. These wells are located in the Newmarket
Plains Aquifer, a sand and gravel aquifer off Route 152, west of the downtown. The water dis-
tribution system consists of a 750,000-gallon water tank, approximately 22 miles of water lines,
over two hundred hydrants, and a booster station located on Folsom Drive.
In 2010, the Town commissioned an engineering study to evaluate current and projected water
needs into the future, which resulted in a ten year capital improvement plan. It was determined,
by 2030, the average daily demand for water would exceed 550,150 gpd. To meet projected wa-
ter demands, the Town will need to increase the supply and storage capacity and make improve-
ments to the water distribution system. The report identified four projects for implementation,
including the development of the MacIntosh Well, a new water storage tank and water main,
pump station upgrades, and development of a new well on the Tucker property. (Source:
AECOM, Town of Newmarket Water System Update and Capital Improvement Plan, October
27, 2010.) The Town is moving forward with a “high priority” project to improve the hydraulics
of the system, by increasing the size of the water transmission line from Route 108 (near the car
wash) to the Great Hill Tank to 16 inches in diameter.
Access and Transportation
Newmarket has direct access to a regional roadway network. It is serviced by a major state
highway—NH Route 108—that runs north-south from the Massachusetts border north to Roch-
ester and the Maine state border. This roadway is linked to I-95, by US Route 4 in Durham and
NH Routes 33 and 101 in Stratham, allowing rapid access to markets in Portland, Maine (60
miles) and Boston, Massachusetts (58 miles), as well as other markets via the interstate system.
(See Figure 6.5 Newmarket’s Relationship to the Region.)
22Town of Newmarket Master Plan, 2011
Chapter 6 Economic Development
The Pan Am Railway provides rail freight service and Amtrak provides passenger service. The
railroad line runs along Route 108 and borders the Newmarket Industrial Park. The nearest pas-
senger stations are in Durham and Exeter. Public transportation is available with destinations
throughout the Seacoast, including the main campus of the University System of New Hampshire
in Durham. Newmarket is within close proximity to the Manchester-Boston Regional Airport
(35 miles west) and the Port of New Hampshire (17 miles east), as well as the airport at Pease
International Tradeport that handles unscheduled commercial air cargo and international flights
for charters and the military. There is also a regional bus service, C and J Trailways, to and from
Boston and New York City.
Assessed Valuation--Eighty-five percent of the town’s total valuation comes
from residential uses (up to 4 units).
A town’s assessed valuation is not only an indicator of its land use patterns and relative prosperi-
ty compared to other communities, but is also a gauge of the zoning regulatory choices it has
made regarding the mix of residential, commercial, and industrial property in the town. It is also
an indicator of its economic sector strength.
Table 6-13 provides a breakdown of the major Town assessor land use categories and the total
assessed value of each, both in terms of buildings and land, for the period between 2000 and
2009. The total assessed value of all property in Newmarket now stands at approximately $719
million. On a town-wide basis, 85% of the total Town assessment is in residential development
(single family, duplexes, and triplexes) including manufactured housing, with about 23% of the
residential assessment in undeveloped residential lands. Commercial/industrial assessment is
approximately 14% and utilities comprise less than 1%. The commercial category also includes
multi-family buildings (of greater than 4 units.) According 2009 data from the Newmarket Tax
Assessor, commercial apartments accounted for $60,399,900 of total land value: includes
$46,049,000 value in buildings and $14,350,900 in land.
From 2000 to 2009, the residential building (up to 4 units) value increased by nearly
$354,807,363 million or roughly 142%, while the commercial and industrial portion increased by
nearly $65,629,000 million or 150% percent.
23Town of Newmarket Master Plan, 2011
Chapter 6 Economic Development
Table 6-13: Town Assessor Land Use by Value
% Increase
Land Use/Year 2000 2005 2009 2000-2009
Land in Current Use 1. $ 496,547 $ 533,353 $ 506,003 2%
Residential $249,850,137 $561,797,539 $604,657,500 142%
Buildings 177,652,300 160,909,239 428,256,100
Lands 67,968,237 6,574,200 167,207,800
Manufactured
Housing 4,229,600 394,314,100 9,193,600
Commercial/Industrial 43,473,460 123,815,200 109,102,900 150%
Buildings 34,024,700 42,593,300 72,033,200
Lands 9,448,760 81,221,900 37,069,700
Utilities 2,707,500 4,761,000 4,887,500 81%
Total $296,527,644 $690,907,092 $719,154,895 143%
Source: Town of Newmarket Assessor 2010
1. Current Use refers to vacant land which is undeveloped and is greater than 10 acres in size. It includes open
space, farmland, forest land, wetlands, or unproductive land. Landowners who wish to develop land are
subject to a Land Use Change Tax (LUCT).
Local Taxes and Tax Rates
Table 6-14 presents the changes in the local equalized property tax rate over the last decade.
According to the New Hampshire Department of Revenue Administration, Newmarket’s full
value tax rate per thousand of assessed total value was at its highest in the year 2000, peaking at
$23.44. It declined to $17.65 in 2005 and then started to climb again through 2009.
Table 6-14: Newmarket Property Tax Rate History, 2000-2009
2009 State
2000 2005 2008 2009
Rank 1.
Newmarket $23.44 $17.65 $20.64 $20.51 140
Durham $26.99 $22.84 $26.72 $27.07 211
Lee $23.29 $20.57 $26.26 $28.42 214
Epping $17.06 $15.89 $19.72 $21.58 159
Exeter $25.62 $17.92 $20.23 $22.05 167
Greenland $13.38 $13.17 $12.82 $13.76 42
Newington $10.39 $ 7.46 $ 6.97 $ 7.60 10
Stratham $16.63 $14.88 $17.29 $17.89 84
Dover $20.25 $16.88 $19.33 $21.70 162
Portsmouth $15.89 $14.19 $15.01 $15.54 57
Newfields $17.92 $18.24 $20.96 $28.43 149
Source: NH Department of Revenue Administration
1. Ranking order based on lowest to highest of full value tax rate
24Town of Newmarket Master Plan, 2011
Chapter 6 Economic Development
Newmarket’s 2009 full value or equalized tax rate2 of $20.51 per thousand is lower than that of
the surrounding communities of Lee, Durham, and Newfields and ranks near the middle in com-
parison to all communities in the state. By comparison Berlin, ranked at 220 out of 234 commu-
nities, has a tax rate of $41.40, while Newington is ranked 10th with a rate of $7.60. Over the
past ten years, Newmarket has managed to keep its rate relatively consistent compared to several
neighboring communities where rates have increased substantially.
The tax rate of one community, compared to that of others in the region, can influence the mar-
ketability of property in a town. Relatively low taxes may positively influence the value of
homes or businesses in a community, especially if nearby towns have appreciably higher taxes.
Lower property tax rates are also one of the elements that are advantageous when attracting new
commercial, retail, and light industrial firms as well as retaining existing business establishments
which may be looking to relocate to other communities.
Newmarket Mills Redevelopment
Source: Newmarket Planning Department, 2011
2
Equalized Tax Rate or Full Value Tax Rate is based on having all communities at 100% valuation. This technique
allows communities to be compared in terms of tax burden.
25Town of Newmarket Master Plan, 2011
Chapter 6 Economic Development
D. Recent Economic Activity
Downtown Revitalization
Newmarket has been involved in a multi-phase revitalization program in the downtown, which
has spanned several decades. The Town has recently completed a $6.8 million Main Street Re-
construction Project, which involved the replacement of water, sewer, and drainage facilities, the
removal of unsightly overhead wires, installation of new lighting and underground utilities, new
sidewalks, crosswalks, landscaping, and pedestrian and streetscape improvements. The overall
purpose of this project was to enhance the live-ability and vitality of Newmarket’s Business Dis-
trict.
Streetscape Improvements in Downtown Newmarket
Source: Mike Hoffman
During the construction of the project, the Newmarket Business Association (NBA) initiated a
"We Dig Newmarket" program, in cooperation with the Newmarket Community Development
Corporation, Lamprey Arts and Cultural Association (LACA), and the Newmarket Recreation
Department. This initiative brought events to downtown in order to maintain attention on the
revitalization process that was underway. The following events were held in the downtown area:
Summer Serenade Series, Halloween Haunt, live music, and the Ice Cream Social. Since renova-
tions have been completed in the downtown, several new businesses have arrived.
Mill Redevelopment
The granite, “trap rock”, and concrete buildings, along Main Street and the Lamprey River, were
purchased by the Newmarket Community Development Corporation (NCDC) from the “Essex
Corporation” in 1997. The NCDC previously owned the mill buildings across the river on Bay
26Town of Newmarket Master Plan, 2011
Chapter 6 Economic Development
Road, which were redeveloped and sold in 2001. Today, that complex is known as “Bryant
Rock” and houses 36 condominium and rental units. The Newmarket mills are an integral part
of the historic town center and main business district in Newmarket. The downtown is the driv-
ing economic engine of Newmarket. Existing uses include retail shops, professional and person-
al services, Town offices, the post office, churches, parks and residences. The Town’s public li-
brary is located on the corner of Elm and Main Street across from the mills.
In 2009, the NCDC selected Newmarket Mills, LLC to redevelop the two historic mills on the
east side of the Lamprey River. The development plan includes 120 units of residential units,
including 16 artist live/work lofts, 35,000 square feet of commercial/retail space, and 5,000
square feet of civic space devoted to the arts and culture. The mill redevelopment project will
include extensive public amenities, including a terraced courtyard, and various connections with
the downtown, and a riverwalk along the Lamprey River. The second phase of the project in-
volves development of 30,000 square feet of commercial/retail space and construction of a park-
ing structure. Recently, the Town has received a transportation enhancement grant to construct
an enclosed pedestrian bridge to connect the Newmarket Mills, with parking on the westerly side
of Main Street.
As part of the project the Newmarket Mills LLC submitted an application to the Newmarket
Town Council for Tax Relief for a three year period under Chapter 79-E, Community Revitaliza-
tion Tax Relief Incentive. This process was widely supported, by the Town Council and Plan-
ning Board. Given the economic realities of the real estate market and the tightening of under-
writing requirements, this mechanism proved to be an effective tool to help the raise the equity
that was needed in order to make this project financially feasible for the developer from a lend-
ing perspective. The project was also financed through private financing, federal historic preser-
vation tax credits and “New Market” tax credits available through the New Hampshire Business
Finance Authority.
Newmarket Mills Redevelopment, 2011
Source: Strafford Regional Planning Commission
27Town of Newmarket Master Plan, 2011
Chapter 6 Economic Development
In 2008, the Suflex Company, a long time Newmarket employer in the mills, closed its doors re-
sulting in the loss of 38 jobs. (Source: New Hampshire Workforce Office 2008-2009). One of the
first endeavors of the Newmarket Mills LLC was to fit up 12,000 square feet of the space for-
merly occupied by the Suflex Company for manufacturing, commercial and warehousing in the
N and N-1 mill buildings. In April 2010 New England Footwear, makers of GoLite and ZT high
performance running shoes, became the first tenants in the mill, relocating from the Pease Inter-
national Tradeport. The firm, which created 13 new jobs, now occupies 5,500 square feet of the
space on the first floor of the mills for a retail outlet, office space, and warehousing.
In January 2011, the second tenants were announced. A custom bicycle frame manufacturer, In-
dependent Fabrication, from Somerville, Massachusetts will be occupying 11,500 square feet,
also in the N and N1 buildings along Main Street. The space will include room for production, a
fit studio, offices, a showroom and amenities for the employees. A third company, BaileyWorks,
which makes handmade messenger bags and gear, will occupy another 3,000 square feet. The
company will be moving from a location in Portsmouth. Initially, 15 new jobs will be created,
and another 5 jobs are expected to be added within a year. These are very highly skilled jobs,
with starting salaries over $50,000 a year. In addition, Chinburg Builders Inc. has opened a “De-
sign Center” within the mills for marketing the residential units. Apartments within the mill are
expected to be ready for occupancy in the fall of 2011.
The Newmarket mills project has been the cornerstone of the town’s revitalization program. It
supports local economic development, by strengthening the central business district, encouraging
new investment and jobs, and expanding the tax base. The economic viability of Newmarket’s
downtown will be greatly enhanced through the rehabilitation of the underutilized mill buildings
for new housing, retail, commercial and civic space, which will bring new residents and visitors
and spur even further development and business activity. The project will also preserve a cultur-
ally and historically significant local landmark, which will be listed on the National Register of
Historic Places.
Other Economic Development Activity
The most recent major commercial development involved the Newmarket Business Park on Exeter Road.
In 2006, the Wentworth Douglas Professional Center and an adjacent medical complex was built which
added approximately 19,500 square feet of com-
mercial and office space to the inventory. During
the past few years, there has been little busi-
ness activity due to the economic recession. In
2008 Newmarket Storage expanded its self-
storage business, with the addition of an 8,400
square foot storage building and Shearwater
Investment Corporation installed a modular
storage structure for Vyn All, a vinyl product
manufacturer, at 12 Forbes Road, at the New-
market Industrial Park. For further discussion
of recent economic activity, see Appendix E,
Commercial and Industrial Development in
Newmarket since 2001.
Newmarket Business Park
Source: Newmarket Planning Department 2011
28Town of Newmarket Master Plan, 2011
Chapter 6 Economic Development
E. Challenges and Opportunities
Challenges are both Locational and Institutional
While Newmarket has a number of assets and opportunities for continued economic growth and
development, it also has challenges. These include the Town’s relative geographic situation.
Newmarket has locational disadvantages, when compared to other communities like Portsmouth,
Newington, Greenland and Dover, which are on major roadways or waterways. In order for
Newmarket to effectively compete for its share of market, the Town needs to have readily avail-
able business and industrial sites to offer that are not only accessible and easy to develop, but
also are serviced by water and sewer.
Another challenge for the Town is the lack of an organizational structure for economic develop-
ment, one fully staffed with resources to establish a visible and consistent economic development
program to work with existing businesses and attract new ones. An economic development func-
tion within Town government could be instrumental in facilitating the development process for
prospective developers.
Newmarket Provides Numerous Opportunities for Business
Although, Newmarket faces several challenges to further its economic development goal, the
Town has numerous existing opportunities for growth including:
• Zoned areas for business growth,
• Water and sewer infrastructure, and
• Business enhancement districts, such as the Tax Increment Finance (TIF) and community
revitalization district, as allowed by state enabling laws.
Existing Areas for Business and Commercial Growth
Currently, there are about 680 acres in Newmarket zoned for business and industrial use. These
zones and their corresponding acreages include:
• 53 acres in the M-2 zone
• 71 acres in the B-1 zone
• 295 acres in the B-2 zone
• 263 acres in the B-3 zone
Note: Acreage data based on the recently completed Sewer Build-Out Analysis
29Town of Newmarket Master Plan, 2011
Chapter 6 Economic Development
M-1 Zone
The M-1, Mill Zone is located to the east of NH Route 108 in the downtown that incorporates the
Downtown Tax Increment Finance (TIF) District. It includes all of the major mill structures.
This zone is built out, but much of the mill space is underutilized and is currently being convert-
ed to business activity. (See Figure 6.8)
Figure 6.8: Downtown TIF District
30Town of Newmarket Master Plan, 2011
Chapter 6 Economic Development
M-2 Zone
The M-2 Zone is located in the downtown area of Newmarket incorporating most of the retail
and high density residential area west of Route 108. This area generates much retail economic
activity, although it is mostly built out.
Main Street Downtown Newmarket 2011
Source: Strafford Regional Planning Commission
B-1 Zone
The B-1 Zone straddles Route 108 north and south of the downtown. As noted earlier, the sec
tion of this district south of the railroad crossing on Route 108 to Kent and Pelczar’s Funeral
Home is already built out, primarily with numerous
commercial and retail services. It provides minimal
opportunity for new business growth except for a
small area adjacent to Railroad Avenue near the rail-
road tracks. However, it is prime for the conversion
of residential uses to commercial and mixed-use de-
velopment. The zoning in the B-1 zone should be
examined and revised, as necessary, to provide more
flexibility and assure opportunities for this type of
development within this district. The Newmarket
Business Park is located in the B-1 Zone.
Source: Newmarket Planning Department
North of downtown, while there are several commercial enterprises, there is potential for addi-
tional commercial activity. Recently, the Town was approached by a developer interested in
building an 80,000 to 90,000 square foot mixed-use community shopping center on North Main
Street. The developer envisions a center that will include a grocery store, pharmacy, restaurant,
and bank, and offers a full range of services to Newmarket residents. The center could be based
on a village or traditional “Main Street” design concept with denser, more compact buildings,
which blend with the architectural and historic character of the Town. The center, as proposed,
31Town of Newmarket Master Plan, 2011
Chapter 6 Economic Development
would provide divided landscaped parking aisles, green space and courtyards with benches and
room for social interaction, events, and food vendors.
B-2 Zone
In contrast to the B-1 zone, most of the B-2 zone is currently undeveloped. The B-2 zone pri-
marily consists of lands located in the southern half of town on the easterly side of Route 108. It
includes the existing Newmarket Industrial Park and land behind the Newmarket self-storage fa-
cility, as well as land on the opposite side of the Pan Am Railroad right-of-way, known as the
Black Bear Tax Increment Finance (TIF) District.
A TIF is a special tax district used to promote commercial and industrial development. A
TIF provides financing for public infrastructure improvements (sewer, water, roads) using
the new tax revenue created by the new, expanded, or renovated commercial property within
the district. After a TIF district is established, the base value and corresponding taxes are set
as a baseline. Any increase in property value within the district (through new construction,
expansion, or renovation) will result in an “incremental” increase in taxes above the baseline.
All or a part of this increase is used to pay for infrastructure improvements (sewer, water,
roads, etc.) within the district. When used properly, these districts can be used to encourage
businesses to locate and expand in Newmarket
Black Bear Tax Increment Finance District
The Black Bear TIF District, established in 1998, includes, in part, what was previously referred
to as Phase 2 of the Newmarket Industrial Park. (See Figure 6.9). The railroad right-of-way has
been a major impediment to development of this area. The District was originally comprised of
approximately 140 acres and, in 2004; the Town added 21 acres to the TIF, with the purchase of
the Wilson property. Because of its large size and proximity to Route 108, this area, along with
the downtown mills, is considered to have the best potential for substantial commercial and in-
dustrial development in Newmarket.
Over the past 13 years, there have been a number of proposals considered for this area, but there
have been no commitments to build. The most recent activity was in 2009: a proposal was
brought forward to locate a Boise-Cascade warehouse of 100,000 square feet for a lumber prod-
uct and distribution facility. A fiscal impact study was conducted, by the Town, which conclud-
ed that the taxable value of the proposal was not sufficient to cover the costs of the requested
public investment given the necessary infrastructure improvements.
32You can also read