DRAFT OREGON BLACK BEAR MANAGEMENT PLAN - OREGON DEPARTMENT OF FISH AND WILDLIFE 21 MARCH 2012 - ODFW
←
→
Page content transcription
If your browser does not render page correctly, please read the page content below
Attachment 2

 1

 2         DRAFT
 3

 4   OREGON BLACK BEAR
 5   MANAGEMENT PLAN
 6
 7
 8
 9
10

11
12
13
14
15
16

      OREGON DEPARTMENT OF
        FISH AND WILDLIFE
          21 MARCH 2012

17
18
19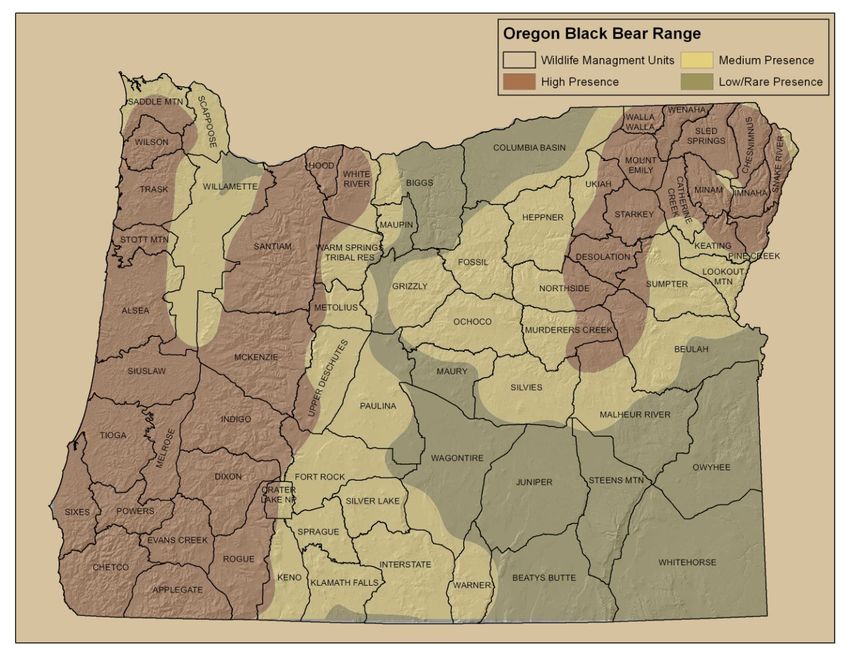
Oregon Department of Fish and Wildlife 2
                                                           Oregon Black Bear Management Plan DRAFT

20                                     ACKNOWLEDGMENTS
21
22
23   The Department acknowledges the following contributors to the current Oregon Black Bear
24   Management Plan:
25
26   Herman Biederbeck, District Wildlife Biologist, North Coast Watershed District Office,
27           Tillamook
28   Julia M. Ter Beest, Oregon State University, veterinary student
29   Dr. Julia Burco, District Veterinarian, South Willamette Watershed District Office, Corvallis
30   Dr. Doug Cottam, District Wildlife Biologist, Newport Field Office, Newport
31   Elizabeth Curry, Office Specialist, South Willamette Watershed District Office, Corvallis
32   Dr. Colin Gillin, State Wildlife Veterinarian, South Willamette Watershed District Office,
33           Corvallis
34   Richard Green, Wildlife Laboratory Biologist, South Willamette Watershed District Office,
35           Corvallis
36   Dr. Tim L. Hiller, Carnivore-Furbearer Coordinator, Wildlife Division, Salem
37   Joel Hurtado, Assistant Staff Biologist, Wildlife Division, Salem
38   Dave Immell, Assistant Project Leader, Roseburg Regional Office, Roseburg
39   Dr. DeWaine Jackson, Research Projects Supervisor, Roseburg Regional Office, Roseburg
40   Jeff Kern, Wildlife GIS Analyst, Fish Division, Salem
41   Keith Kohl, Special Projects Coordinator, Wildlife Division, Salem
42   Steve Niemela, Assistant District Wildlife Biologist, Rogue Watershed District Office, Central
43           Point
44   David Nuzum, Assistant District Wildlife Biologist, North Coast Watershed District Office,
45           Tillamook
46   Julie Schneider, Habitat Connectivity Biologist, Wildlife Division, Salem
47   Tom Thornton, Game Program Manager, Wildlife Division, Salem
48   Dr. Don Whittaker, Ungulate Species Coordinator, Wildlife Division, Salem
49   Miranda Wood, Conservation Strategy GIS Analyst, Fish Division, Salem
50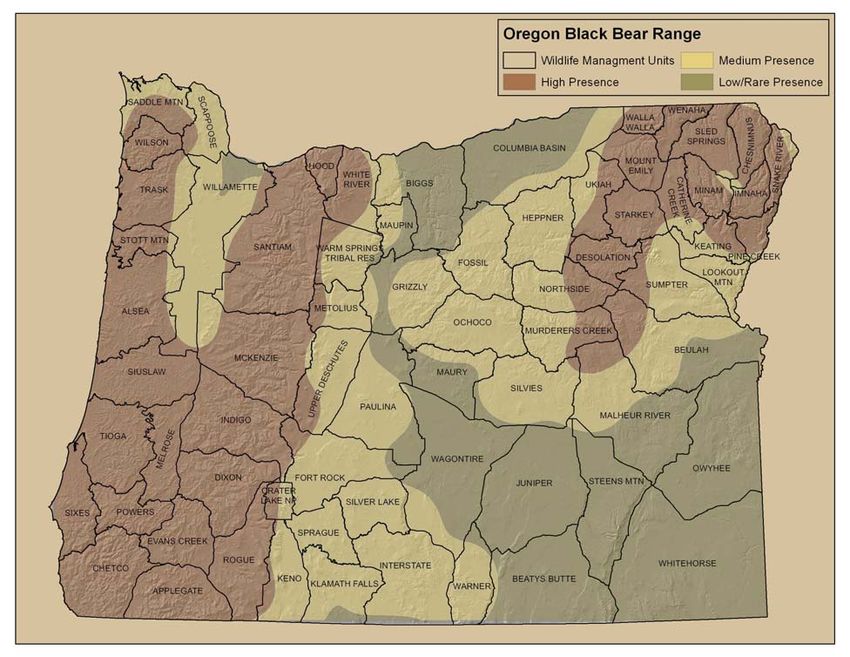
Oregon Department of Fish and Wildlife 3
                                                           Oregon Black Bear Management Plan DRAFT

51                          OREGON BLACK BEAR MANAGEMENT PLAN:
52                                       EXECUTIVE SUMMARY
53
54   The 2012 Oregon Black Bear Management Plan updates the 1993–1998 Oregon Black Bear
55   Management Plan. During the planning and revision process, stakeholder groups were invited and
56   provided input for the plan. A public comment period also was utilized during the revision process
57   to inform the public of the intent of the plan, how black bears are managed in Oregon, and for the
58   Department to consider public input on bear management.
59
60   The plan includes information on biology and ecology of bears, with a focus on Oregon; historical
61   and current management approaches; and biological data collection. The plan also establishes a set
62   of 4 objectives designed to balance ecological, social, and economic considerations for informed
63   decision making when managing populations of black bears. These objectives are not considered
64   mutually exclusive; therefore, some level of trade-off is to be expected under certain situations.
65
66   Objective 1 is to maintain a healthy and stable bear population while considering other wildlife
67   population objectives and the level of human-bear conflicts. Management of individual species
68   should include considerations related to an ecosystem-based management approach. Management of
69   other wildlife species, such as deer and elk, may affect management of bears, including those related
70   to population abundance. Therefore, objectives should be balanced and trade-offs should be
71   acknowledged. The distribution of bears also affects management decisions, such as loss of habitat
72   that may result in an increase in human-bear interactions and conflicts.
73
74   Objective 2 is to work to reduce the number of human-bear conflicts that result in the removal (lethal
75   and nonlethal) of bears. Many human-bear conflicts may be addressed through preventative
76   measures. This is often the most cost-effective and socially acceptable approach in comparison to
77   lethal and non-lethal removal of problem bears. Once bears become habituated to humans or
78   human-supplied foods, the number of options available to effectively resolve these issues becomes
79   very limited and the effort associated with these limited options increases significantly.
80
81   Objective 3 is to develop, refine, and evaluate population abundance estimation through modeling
82   techniques. Major advancements in statistical approaches have occurred during the past 2 decades,
83   including complex modeling procedures designed to more fully account for environmental variation,
84   reduce uncertainty in estimation, and increase predictive capabilities. This results in an increased
85   ability to make informed management decisions; however, such complex approaches often require
86   additional staff training or contracts with academic institutions.
87
88   Objective 4 is to continue to improve basic understanding of black bear management and ecology
89   through applied research. There is a large amount of basic information on black bear ecology.
90   There are specific questions that could be addressed in Oregon that would be beneficial for
91   management of black bears.
92
93   During the early part of the 20th Century, predators were subjected to high levels of take because of
94   real or perceived threats to human health or safety and conflicts with agriculture/livestock. Many of
95   our native predators have reestablished and are now very common in Oregon. The Oregon
96   Department of Fish and Wildlife recognizes the high value of our native wildlife, including
Oregon Department of Fish and Wildlife 4
                                                            Oregon Black Bear Management Plan DRAFT

 97   predators, and manages for a balance between sustainable populations and acceptable levels of
 98   conflicts, which is challenging at times. Public attitude toward black bears (and other wildlife
 99   species) has changed during the past several decades, and increasing black bear populations have
100   increased the complexity of certain management issues. State wildlife agencies have been,
101   “…caught in the middle and try to maintain a balance with their management strategies,” (Pelton
102   2000:390) as they shift from goals related to population recovery to goals related to regulation of
103   abundance. The mission of the Oregon Department of Fish and Wildlife is to protect and enhance
104   Oregon’s fish and wildlife populations and their habitats for use and enjoyment by present and future
105   generations. This plan is the strategy of the Oregon Department of Fish and Wildlife to meet its
106   mission for management of black bears in Oregon.
107
108
109
Oregon Department of Fish and Wildlife 5
Oregon Black Bear Management Plan DRAFT
110 OREGON BLACK BEAR MANAGEMENT PLAN:
111 TABLE OF CONTENTS
112
113
114
115 ACKNOWLEDGMENTS .................................................................................................................... 2
116 EXECUTIVE SUMMARY .................................................................................................................. 3
117 INTRODUCTION ................................................................................................................................ 6
118 GOAL AND OBJECTIVES ................................................................................................................. 7
119 BIOLOGY AND ECOLOGY OF BLACK BEARS ............................................................................ 8
120 TAXONOMY, DISTRIBUTION, AND ABUNDANCE ................................................................................. 8
121 HABITAT .......................................................................................................................................... 10
122 REPRODUCTION ............................................................................................................................... 11
123 MORTALITY ..................................................................................................................................... 11
124 FORAGING AND PREDATION ............................................................................................................. 12
125 PARASITES AND DISEASES ............................................................................................................... 12
126 MANAGEMENT OF BLACK BEARS IN OREGON ...................................................................... 14
127 HISTORY .......................................................................................................................................... 14
128 HUNTING ......................................................................................................................................... 14
129 Hunting Methods ........................................................................................................................ 14
130 Season Structure.......................................................................................................................... 15
131 HUMAN-BEAR CONFLICTS ............................................................................................................... 16
132 Human Safety.............................................................................................................................. 18
133 Damage and Nuisance................................................................................................................. 19
134 BIOLOGICAL DATA COLLECTION ..................................................................................................... 23
135 Harvest Data................................................................................................................................ 23
136 Population Monitoring ................................................................................................................ 26
137 OBJECTIVES AND STRATEGIES ................................................................................................... 31
138 LITERATURE CITED ....................................................................................................................... 34
139 APPENDIX I: HISTORY OF BLACK BEAR MANAGEMENT IN OREGON ................................................ 41
140 APPENDIX II: CURRENT OREGON REVISED STATUTES ASSOCIATED WITH BLACK BEARS ............... 43
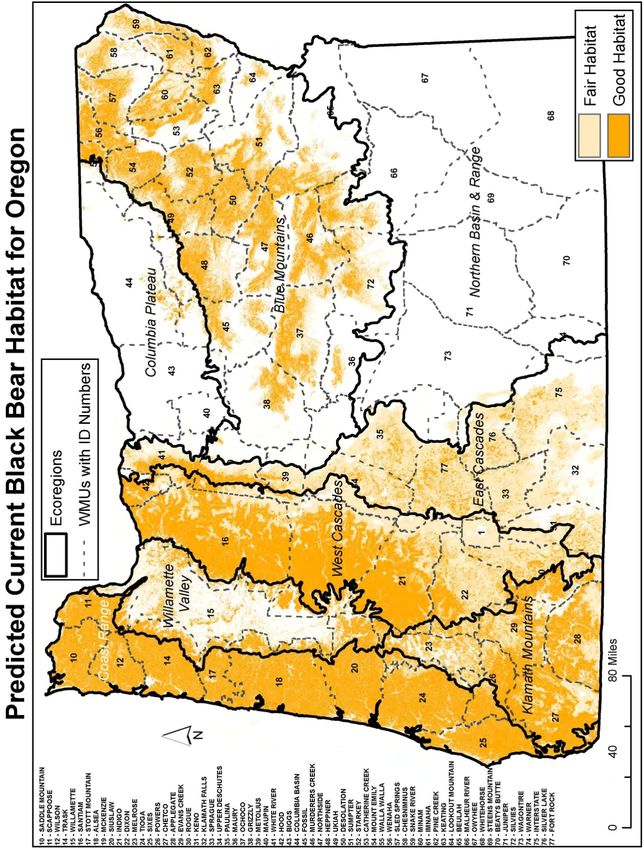
141 APPENDIX III: CURRENT ESTIMATED DISTRIBUTION OF HABITAT ................................................... 47
142 FOR BLACK BEARS IN OREGON ............................................................................................................ 47
143 APPENDIX IV: DEFINITION OF TERMS .............................................................................................. 48
144 APPENDIX V: REVIEW PROCESS OF BEAR PLAN ............................................................................... 49
145 APPENDIX VI: GUIDELINES FOR HANDLING BLACK BEARS ............................................................. 51
146 APPENDIX VII: GUIDELINES FOR HANDLING BLACK BEAR CUBS .................................................... 56
147
148Oregon Department of Fish and Wildlife 6
Oregon Black Bear Management Plan DRAFT
149 INTRODUCTION
150
151 During the early part of the 20th Century, predators were subjected to high levels of harvest and
152 control because of real or perceived threats to human health or safety or the ability of humans to
153 make a living. Several predatory species were very uncommon during this time. After a period of
154 protection (see Appendix I), many of our native predators have reestablished and are now very
155 common in Oregon. The Oregon Department of Fish and Wildlife (ODFW or Department)
156 recognizes the high value of our native wildlife, including predators, and manages for a balance
157 between sustainable populations and acceptable levels of conflicts, which is challenging at times.
158 Public attitude toward black bears (and other wildlife species) has changed during the past several
159 decades, and increasing black bear populations have actually increased the complexity of certain
160 management issues. State wildlife agencies have been, “…caught in the middle and try to maintain a
161 balance with their management strategies,” (Pelton 2000:390) as they shift from goals related to
162 population recovery to goals related to regulation of abundance.
163
164 Although many Oregonians may never observe a black bear under natural conditions, they find
165 satisfaction in the knowledge that the persistence of black bear populations in Oregon is not
166 threatened. Black bears are very difficult to observe and survey due to their secretive and solitary
167 nature and their naturally low population densities under most conditions; for these reasons some
168 people may believe that bears are low in abundance. Consequently, they may recommend increased
169 efforts to protect bears. However, in North America, there are an estimated 750,000 to 918,000
170 black bears (estimated by Herrero et al. 2011 using data from Hristienko and McDonald 2007), and
171 the population seems to be increasing in abundance and distribution during the past several decades.
172 Based on trends in number of sightings, number of damage complaints, and harvest statistics,
173 Oregon's black bear population is thought to be stable or increasing in most areas. The current
174 statewide black bear population is estimated to be between 25,000 and 35,000 animals, although
175 estimating statewide abundance of bears is difficult (see Population Monitoring).
176
177 A number of wildlife laws pertain to bear management in Oregon and provide the Department
178 direction on which to base current management goals (Appendix II). Oregon Revised Statute (ORS)
179 496.004 classifies the black bear as a game mammal and gives the Department responsibility for
180 management of bears. The statute related to Wildlife Policy (ORS 496.012) directs the Department
181 to manage wildlife "...to provide the optimum recreational and aesthetic benefits for present and
182 future generations of the citizens of this state...." Goals of this policy state that wildlife will be
183 maintained at optimum levels; utilization of wildlife will be orderly and equitable; and wildlife
184 populations will be regulated in a manner that is compatible with the primary uses of the lands and
185 waters of the state and provide optimum recreational benefits to the public. A third statute, ORS
186 498.012, pertains to wildlife damaging land, livestock, or agricultural or forest crops and allows a
187 landowner or lawful occupant of the land to take any bear that is causing damage without first
188 obtaining a permit from the Department. In 1994, a ballot initiative (Measure 18) passed, resulting
189 in ORS 498.164, which prohibits the use of bait to attract or take black bears, or the use of one or
190 more dogs to hunt or pursue black bears or cougars. However, the Department may directly use
191 these methods, or allow an authorized agent to do so, to implement specific management programs
192 of the Department (e.g., damage control, research). Hunting seasons for bear and the removal of
193 specific animals in conflict with human interests are two ways the Department meets its statutory
194 obligations, including to provide recreational opportunities, address public safety, maintain bearOregon Department of Fish and Wildlife 7
Oregon Black Bear Management Plan DRAFT
195 populations at levels compatible with the primary land use, and to provide optimum benefits for
196 present and future generations.
197
198 Oregon's first black bear management plan was developed in 1987 for the purpose of guiding bear
199 management through 1992 (ODFW 1987). The original plan identified several management
200 concerns and developed management strategies to address those concerns. In 1993, the Oregon Fish
201 and Wildlife Commission (Commission) approved the 1993–1998 Oregon Black Bear Management
202 Plan, which the Department relied on for many years for guidance (ODFW 1993). This current
203 update of the Oregon Black Bear Management Plan has been long awaited by many, including the
204 Department, and is intended to focus on what has changed since the previous plan and on applying
205 what has been learned about black bear management during the past 2 decades. The Department
206 will update this plan as warranted based on sufficient amounts of new information and changes in
207 management approaches. As with the previous bear management plans, the Department continues to
208 develop efficient and effective bear management strategies to meet objectives within its personnel
209 and fiscal resource limitations.
210
211
212 SUMMARY OF GOAL AND OBJECTIVES
213
214 GOAL: Manage black bear populations to attain the optimum balance among species
215 protection, recreational uses, habitat availability, primary land uses, and other wildlife species.
216
217 OBJECTIVE 1. Maintain a healthy and stable bear population while considering other wildlife
218 population objectives and the level of human-bear conflicts.
219
220 OBJECTIVE 2. Work to reduce the number of human-bear conflicts that result in the removal (lethal
221 and nonlethal) of bears.
222
223 OBJECTIVE 3. Develop, refine, and evaluate population abundance estimation through modeling
224 techniques.
225
226 OBJECTIVE 4. Continue to improve basic understanding of black bear management and ecology
227 through applied research.
228
229 For more information on strategies to meet objectives, see OBJECTIVES AND STRATEGIES
230 section at the end of the plan.
231Oregon Department of Fish and Wildlife 8
Oregon Black Bear Management Plan DRAFT
232 BIOLOGY AND ECOLOGY OF BLACK BEARS
233
234 TAXONOMY, DISTRIBUTION, AND ABUNDANCE
235
236 Black bears (Ursus americanus) are the smallest of the 3 North American species of bears.
237 Currently, 16 subspecies are generally recognized, with U. a. altifrontalis in western Oregon and U.
238 a. cinnamonum in eastern Oregon (Hall 1981, Larivière 2001). Black bears are distributed
239 throughout much of the U.S. (except southwestern arid and Midwestern agricultural regions) and
240 Canada, and south through interior Mexico (Larivière 2001). Black bear populations are stable or
241 increasing across most of their range, with a North American estimate of over 600,000 about a
242 decade ago (Pelton 2000) to between 750,000 and 918,000 more recently (estimated by Herrero et al.
243 2011 using data from Hristienko and McDonald 2007).
244
245 In Oregon, relative densities of bears are highest in the Coast and Cascade Ranges and the Blue
246 Mountain region in the northeast, and lowest in the arid southeastern region (Fig. 1). During 1930–
247 1933, the bear population in Oregon was estimated to be 9,000 animals (Bailey 1936). A 1980
248 planning update by the Department identified 21,700 mi2 (56,203 km2) of bear habitat in Oregon
249 with an estimated population of 18,000 black bears (ODFW 1987). During the early 1990s, the
250 estimated statewide black bear population was nearer to 25,000 animals occupying approximately
251 40,000 mi2 (103,600 km2) of habitat (ODFW 1993, Van Dyke 1993). This was based on estimates
252 of 0.9 bears/mi2 (0.35 bears/km2) in western Oregon and 0.3 bears/mi2 (0.12 bears/km2) in eastern
253 Oregon. Akenson et al (2001) used dogs to estimate abundance of black bears in the Blue
254 Mountains of eastern Oregon and estimated annual bear densities of 0.7 bears/100 mi2 (0.3 bears/
255 km2) in 1996 and 0.5 bears/mi2 (0.2 bears/km2) in 1997. Current estimates of black bear habitat in
256 Oregon include about 17,080 mi2 (44,236 km2) of fair habitat and 26,807 mi2 (69,429 km2) of good
257 habitat, a cumulative amount of about 46% of the state (Table 1; see Appendix III for a habitat map).
258 Although methods used to estimate relative density (Fig. 1) and habitat quality (Appendix III) were
259 different, there is general agreement between these sets of information. Similarly, there is not
260 always a direct relationship between animal density and habitat quality (Van Horne 1983). During
261 2003–2004, the Department implemented a study on 2 sites in southwestern Oregon using baited
262 hair-snares to assess their use in collecting data for population estimation purposes (see Immell and
263 Anthony 2008). Based on DNA analysis of hair samples, bear densities during the study averaged
264 0.5 bears/mi2 (0.2 bears/km2) and 0.6 bears/mi2 (0.2 bears/km2) on the 2 sites. Such densities were
265 comparable to or somewhat more conservative than those estimated in adjacent states where
266 densities of at least 1 bear/mi2 (0.39 bears/km2) were documented (Poelker and Hartwell 1973 [WA],
267 Piekielek and Burton 1975 [CA], Beecham 1980 [ID]).
268
269 Similar to most species of bears, male black bears are often substantially (10–70%) larger and
270 heavier than females (McLean and Pelton 1990). Pelage color of black bears varies greatly and
271 includes many shadings of black and brown. Early reports indicated that black phases outnumbered
272 brown phases four to one in western Oregon. Black bears in eastern Oregon were reported as three
273 brown to every two black color phases sighted. Observation records from Wallowa County during
274 1984–1986 classified color phases of black bears as 46% brown, 26% black, 24% blonde, and 4%
275 cinnamon. This preponderance of brown-phase black bears could explain some occasionally
276 reported grizzly bear sightings in northeastern Oregon.
277Oregon Department of Fish and Wildlife 9
Oregon Black Bear Management Plan DRAFT
Table 1. Estimated amount of current habitat for black bears in Oregon.
Amount of Fair Amount of Fair Amount of Good Amount of Good
Ecoregion Habitat (mi2) Habitat (km2) Habitat (mi2) Habitat (km2)
Blue Mountains 3,583 9,278 6,463 16,740
Coast Range 835 2,163 7,282 18,859
Columbia Plateau 46 119 166 430
East Cascades 5,989 15,512 1,454 3,765
Klamath Mountains 1,625 4,209 3,537 9,161
Northern Basin and
Range 135 350 5 14
West Cascades 4,219 10,927 6,214 16,095
Willamette Valley 648 1,678 1,685 4,365
Total 17,080 44,236 26,806 69,429
278
279 Black and grizzly bears were both native to Oregon; however, most grizzly bears (Ursus arctos)
280 disappeared from the state by about 1900. Bailey (1936) indicated Oregon at one time had three
281 subspecies of grizzly bears. The Klamath grizzly (U. a. klamathensis) was found throughout the
282 Cascade Mountains and western Oregon valleys from California to the Columbia River. As late as
283 1933, the U.S. Forest Service estimated one or two Klamath grizzlies still lived in the Cascades.
284 Eastern Oregon was home to the Idaho grizzly (U. a. idahoensis) and a smaller subspecies, the Small
285 Yellowstone Park grizzly (U. a. mirus). Grizzlies were reportedly killed or seen east of Prineville as
286 late as 1885 and 1891. The last grizzly bear in Oregon was taken in 1937 near Billy Meadows
287 Guard Station in Wallowa County.
288Oregon Department of Fish and Wildlife 10
Oregon Black Bear Management Plan DRAFT
289
290
291 Fig. 1. Relative density of black bears in Oregon during early 21st Century.
292
293
294 HABITAT
295
296 Black bears may persist under a wide range of habitat conditions, although the semi-arid shrub-
297 steppe ecoregion in southeastern Oregon is poor habitat for black bears. Habitat quality and quantity
298 changes through time, not all habitat is suitable for all species at all times, and habitat management
299 may differ greatly based on land ownership (e.g., private, state, federal). During the early 1990s, the
300 quantity of habitat in Oregon suitable for black bears was estimated to be 40,000 mi2 (103,600 km2)
301 (ODFW 1993, Van Dyke 1993). In southwestern Oregon, presence of bears was positively
302 associated with open-canopy mature and pole-sapling stands, as well as riparian areas, but bears
303 seemed to avoid roads (Vander Heyden and Meslow 1999).
304
305 Home-range sizes of female black bears in the central Cascades of Oregon averaged about 39.0 km2
306 (15.1 mi2; Vander Heyden and Meslow 1999). This estimate was relatively high, suggesting that
307 habitat quality may be less than ideal, or that bear densities were low relative to habitat quality.
308 Average annual home-range sizes were 21.3 km2 (8.2 mi2) for adult females, 27.6 km2 (10.7 mi2) forOregon Department of Fish and Wildlife 11
Oregon Black Bear Management Plan DRAFT
309 sub-adult females, 133.5 km2 (51.5 mi2) for sub-adult males and 140.6 km2 (54.3 mi2) for adult
310 males in the central Cascades during 1993–1998 (ODFW, unpublished data). In Washington, mean
311 home-range size of male black bears was almost 4 times that of females (Koehler and Pierce 2003).
312
313 Hibernation may be initiated under the conditions of low or decreasing food availability and
314 decreasing temperatures. Hibernation occurs during late fall to early spring in most areas, and may
315 or may not occur in southern latitudes and in some coastal areas that have mild winter conditions
316 (Hellgren and Vaughan 1989, Graber 1990, Hellgren et al. 1997). In southeastern Oregon, females
317 entered dens 24 days earlier than males (7 Nov vs. 1 Dec) (ODFW, unpublished data). Pregnant
318 females stayed in dens longer (174 days) than other bears and females with cubs were the last to
319 emerge during spring (28 Apr). Bull et al. (2000) examined the use of den sites by hibernating bears
320 in the Blue Mountains of northeastern Oregon and found that bears used hollow trees or logs (41%),
321 ground excavations (37%), and caves or rock structures as den sites (22%) during winter. In
322 southwestern Oregon, 82% of dens were associated with trees, 15% with rocky outcroppings and
323 caves, and very few were excavated beneath logs or were ground nests (ODFW, unpublished data).
324
325 REPRODUCTION
326
327 Most female black bears in Oregon breed for the first time at 3–4 years old (Lindzey and Meslow
328 1980). Mating generally occurs in June and July, implantation is delayed until late November to
329 early December, and gestation is generally 60–70 days (Wimsatt 1963, Eiler et al. 1989, Hellgren et
330 al. 1990). In southeastern Oregon, the average date of parturition was 21 January (ODFW,
331 unpublished data). Litter size ranges from 1 to 4; in comparison to black bears in the eastern U.S.,
332 black bears in the western U.S. generally have a smaller litters and a later mean first age to
333 reproduction (see Kasworm and Thier 1994). Cubs stay with the females 16 to 18 months after birth,
334 typically leaving in late spring prior to the breeding season.
335
336 MORTALITY
337
338 Black bears are relatively long-lived, occasionally reaching 20 years of age or more in the wild
339 (Keay 1995). In Oregon, black bears have very occasionally exceeded 20 years of age, with 2 bears
340 estimated at 30 years old based on mortality data (ODFW, unpublished data). At continental scales,
341 there is evidence that differences in survival and reproductive rates exist, with adult bears in western
342 North America having higher survival and lower productivity than adult bears in eastern North
343 America, which tend to have lower survival but are more productive (Beston 2011). As with most
344 species, survival estimates vary by sex, age, in space and time, and to some degree by estimation
345 method. In Oregon, males 1–5 years old had lower survival than females of the same age, but
346 survival estimates were similar for male and female bears >6 years old (Lindzey and Meslow 1980).
347
348 There are few natural predators of adult black bears, but young bears may be killed by predators
349 such as cougars, bobcats, and coyotes, or by other black bears (see Larivière 2001). The primary
350 causes of known mortality for adult black bears in Oregon are hunter-harvest and removal because
351 of damage and safety concerns. Other less common causes include vehicle and train collisions,
352 illegal take, and accidental mortality, such as unknown injury requiring euthanasia.
353Oregon Department of Fish and Wildlife 12
Oregon Black Bear Management Plan DRAFT
354 FORAGING AND PREDATION
355
356 Although black bears are included in Order Carnivora, they are omnivores and eat a wide variety of
357 plants and animals. Diets of black bears change seasonally and are based on food availability
358 (Kolenosky and Strathearn 1987). Depending on availability, foods such as berries, acorns, skunk
359 cabbage, and other herbaceous plants are very important for bears to store fat prior to hibernation.
360 When available, bears will catch and consume deer fawns and elk calves, and feed on carrion (Bull
361 et al. 2001, Larivière 2001). Invertebrates may provide a consistent source of protein for bears
362 throughout the year (Bull et al. 2001). In areas near human dwellings, bears may be attracted to
363 garbage, bird feeders, gardens, orchards, and beehives as food sources.
364
365 Predation by bears on ungulates is primarily limited to deer fawns and elk calves. Of 21
366 radiomarked white-tailed deer (Odocoileus virginianus) fawns in Minnesota, mortalities were evenly
367 split between gray wolves (Canis lupus) and black bears (Kunkel and Mech 1994). Ozoga and
368 Verme (1982) concluded that a significant loss of fawns to black bears may be possible, although
369 their study was limited to an enclosure. Researchers have also found evidence that black bears may
370 negatively affect recruitment of calves in a reintroduced population of elk in the eastern U.S.
371 (Yarkovich et al. 2011), but research has also suggested that predation appears to have a larger affect
372 at lower ungulate densities (Zagar and Beechum 2006). In Idaho, elk calf survival seemed to be
373 influenced by birth weight, habitat structure, and black bear and cougar harvest (presumably in
374 relation to their respective densities); calf mortality through predation by black bears was described
375 as additive (i.e., in addition to, rather than replacing, other sources), and the authors suggested that a
376 spring bear season may be effective for improving calf survival (White et al. 2010). The actual
377 significance of predation of ungulates by black bears is likely dependent on a complex relationship
378 involving bear densities, ungulate densities, presence and densities of other predators, weather
379 conditions, and alternate food availability (e.g., Zagar and Beechum 2006, Griffin et al. 2011).
380
381 PARASITES AND DISEASES
382
383 Although identifying mortalities of bears with clinical signs of disease is much less common than
384 other mortality sources (Binninger et al. 1980, Forrester 1992), black bears may be exposed to a
385 wide variety of pathogens. These include bacterial (brucellosis, plague, Salmon Poisoning Disease),
386 viral (infectious canine hepatitis, parvovirus), fungal pathogens, and parasitic diseases (Trichinella,
387 Giardia, tapeworms, and many ectoparasites such as ticks and fleas) (Samuel et al. 2001, Williams
388 and Barker 2001). Many of these pathogens cause little or no disease symptoms in bears and some
389 may occur in black bears in Oregon.
390
391 Very few bacterial, viral, or fungal agents have been identified as causing clinical disease in free-
392 ranging bears. Infectious canine hepatitis could pose a threat to bears exposed to unvaccinated,
393 infected domestic dogs (C. l. familiaris) in the interface between human dwellings and bear habitat.
394 This is a debilitating disease of wild and domestic canid species and often results in mortality. In
395 free-ranging black bears, clinical signs include vomiting, paralysis, convulsions, and mortality.
396 Most die within 12 hours of first showing clinical signs (Pursell et al. 1983, Collins et al. 1984).
397
398 One bacterial disease occurring in bears is known as Salmon Poisoning Disease, or Elokomin Fluke
399 Fever, and is specific to the Pacific Northwest. This disease is caused by a bacterium carried by aOregon Department of Fish and Wildlife 13
Oregon Black Bear Management Plan DRAFT
400 liver fluke (Nanophyetus salmincola), which has a complicated life cycle involving snails and
401 salmonid fish. Immature encysted flukes infect salmonids, which are in turn eaten by bears.
402 Clinical signs in bears may include lethargy, diarrhea, and anorexia (Rogers and Rogers 1976,
403 Foreyt 2001). This disease may be fatal to bears, but if they survive an infection, they are likely to
404 have life-long immunity; the effect is similar for domestic dogs. There is no evidence that this
405 disease affects humans.
406
407 Of the pathogens most prevalent in Oregon bears, parasites, both internal and external, are the most
408 commonly observed. Parasites of bears include tapeworms, fleas, and ticks (Rogers and Rogers
409 1976, Worley et al. 1976). There is no evidence that parasites are a significant cause of mortality in
410 bears; however, some parasites such as Baylisascaris, a roundworm similar to one that infects
411 raccoons, may present a public health risk for humans.
412
413 Trichinosis is a disease of many wild and domestic carnivores and omnivores, and may be found in
414 bears and swine due to their predatory and scavenging nature. Trichinosis is caused by the nematode
415 roundworm Trichinella spiralis. Adult nematodes inhabit the tissue of the host’s small intestine.
416 Larvae penetrate the intestine and travel through the bloodstream to other parts of the body where
417 they invade muscles and form cysts. Animals become infected when they eat meat containing
418 encysted larvae (Dick and Pozio 2001). Bears with trichinosis may not show any outward signs of
419 disease; however, migrating larvae have been known to cause painful muscle tissues in humans.
420 Trichinosis in bears or other game animals poses a zoonotic risk to consumers of inadequately
421 cooked infected meat (Worley et al. 1976). During 2006, approximately 200 tongues from Oregon
422 black bears were evaluated for trichinella cysts. Only 2 samples (1%) contained evidence of
423 trichinella infection (Michael Kent, Oregon State University, personal communication).
424
425 Baylisascariasis is a less commonly reported parasitic infection in black bears, but one with zoonotic
426 potential (Jenness 1997). Clinical signs of Baylisascaris sp. infection in wildlife include a loss of
427 balance, circling, abnormal posture, and blindness. A similar and more common roundworm found
428 in raccoons presents a public health risk, particularly to small children playing in urban
429 environments where raccoons may exist. Although the roundworm species associated with black
430 bears is less infective to humans and has not been found in Oregon, the risk of human exposure can
431 be diminished by avoiding contact with wild animal feces.
432
433 Mange is a disease caused by a mite. One type of mange is caused by a mite that occupies the host’s
434 hair follicles and may cause hair loss, sometimes over large areas on the back of the neck, ears, face,
435 and limbs (Forrester 1992, Foster et al. 1998). This type of mite is not infective to humans or
436 domestic animals. Another type of mange that has been observed on black bears is Sarcoptic
437 (Sarcoptes scabiei) mange (Schmitt et al. 1987). This species of mange causes scab-like erosions of
438 the skin and is spread by direct contact between infected and uninfected individuals. Although this
439 disease is very rare in bears and has not been observed in Oregon, it can be transmitted to humans.
440
441
442Oregon Department of Fish and Wildlife 14
Oregon Black Bear Management Plan DRAFT
443
444 MANAGEMENT OF BLACK BEARS IN OREGON
445
446 HISTORY
447
448 Oregon's management of black bears has changed significantly through time (Appendix I). From
449 Euro-American settlement until 1924, no management protections existed for black bears in Oregon.
450 From 1925 through 1940, portions of southern Oregon had regulated hunting seasons but harvest
451 restrictions did not exist elsewhere in the state. During 1941–1942, a 1-month statewide hunting
452 season with a bag limit of 1 bear was implemented. Seasons with unrestricted harvest resumed in
453 1943 and continued through 1961.
454
455 In 1961, the Oregon Legislature granted the Oregon State Game Commission (now the Oregon
456 Department of Fish and Wildlife) authority to declare the black bear a game mammal except in those
457 areas where damage could be expected. Bear were not considered a game mammal in most of the
458 state, which remained open to year-round hunting; a limited season was imposed for the Cascades
459 and the Rogue River Canyon. All lands within one mile of the Rogue River between Grave Creek
460 and Lobster Creek were closed to bear hunting in 1965. Black bears were fully placed under the
461 management jurisdiction of the Oregon State Game Commission in 1970 when declared a game
462 mammal statewide. The use of dogs to hunt or pursue bears (or cougars) and the use of bait to
463 attract or hunt bears for recreational purposes became prohibited with the passage of Measure 18 in
464 1994. Since then, season structure has remained relatively unchanged, but hunters adapted to use
465 primarily spot-and-stalk techniques and opportunistic harvest of bears while pursuing deer and elk
466 (see Hunting Methods).
467
468 High demand for bear parts, such as gall bladders and paws, in Asian cultures has contributed to
469 most Asian bear species being listed as threatened or endangered (see Twiss and Thomas 1999 for
470 background information). The general prohibition of the sale of black bear parts in North America
471 was implemented to deter potential illegal trade of this species. In 1973, Oregon Revised Statute
472 498.022 was enacted and prohibits the sale, exchange, or trade of wildlife, except as provided by the
473 State Fish and Wildlife Commission. Exceptions to this statute are provided in Division 200 of
474 Oregon Administrative Rules; no exception has been made for the sale, exchange, or trade of black
475 bears or parts of black bears.
476
477 HUNTING
478
479 Hunting Methods
480
481 The use of bait or dogs for hunting bears generally results in hunters being more selective for certain
482 sex-age classes of bears in comparison to other methods (Litvaitis and Kane 1994, Malcolm and Van
483 Deelen 2010). Measure 18 in 1994 resulted in ORS 498.164, which prohibits the use of bait to
484 attract or take black bears, or the use of 1 or more dogs to hunt or pursue black bears or cougars, for
485 recreational purposes in Oregon. Prior to 1994, the use of dogs and bait accounted for 31% and 14%
486 respectively of the bear harvest in Oregon (ODFW 1993). Much (40%) of the harvest was (and
487 currently is) through incidental take by hunters in pursuit of other species, primarily during deer andOregon Department of Fish and Wildlife 15
Oregon Black Bear Management Plan DRAFT
488 elk seasons. The remainder of the pre-1994 harvest was through spot-and-stalk techniques,
489 accounting for 15% of the total harvest. Note that these values represent the percent harvest by
490 method and are not an indication of the efficacy of any particular harvest method. Since 1994,
491 hunters have continued to use opportunistic encounters to harvest bears, expanded the use of spot-
492 and-stalk techniques, and expanded or developed alternative methods.
493
494 Season Structure
495
496 For black bears, Oregon currently has controlled spring hunts from early or mid-April to late May,
497 and a general fall season from August to November in eastern Oregon and August to December in
498 western Oregon. The spring controlled hunt generally involves an application process whereby a
499 limited number of tags are randomly assigned to applicants to limit the number of hunters.
500 Southwestern Oregon is an exception to this process, with hunts based on a limited number of tags
501 offered on a first-come, first-served basis. Controlled hunts are based on an allocation of tags by
502 wildlife management unit or for an area comprised of multiple units.
503
504 The general fall season involves an unlimited number of tags available to hunters, but overall hunter
505 success is typically very low, particularly since 1994 when the use of dogs and bait became
506 prohibited (see Hunter-Harvest Statistics). The most recent version of the Oregon Big Game
507 Regulations contains the most current information on season structures and other regulatory details
508 discussed in the plan.
509
510 In Oregon, it is illegal for hunters to harvest cubs less than one year old or females with cubs less
511 than one year old. Concerns have existed about spring bear seasons, specifically in regards to the
512 potential harvest of females with cubs resulting in orphaned cubs. Not all female black bears
513 reproduce every year because of sexual immaturity, poor physical or poor reproductive condition, or
514 because they have yearlings (i.e., the previous year’s cubs) with them. Two studies (Alt 1982,
515 Kolenosky 1990) suggested that on average approximately one-third of female bears were traveling
516 with cubs. A study in Manitoba concluded that the number of cubs orphaned due to harvest of
517 female bears during spring hunting seasons was, “Oregon Department of Fish and Wildlife 16
Oregon Black Bear Management Plan DRAFT
533 season is also conducive to taking male bears because generally, females with cubs are the first to
534 enter dens for hibernation and the last to emerge during spring, whereas males tend to have the
535 shortest hibernation period and earliest emergence (as cited in Lariviere 2001; ODFW, unpublished
536 data).
537
538 HUMAN-BEAR CONFLICTS
539
540 The Department groups most human-black bear conflicts into two categories: human safety and
541 damage (e.g., agricultural, nuisance). Black bears may easily adapt to living in close proximity to
542 humans. Most non-agricultural conflicts in Oregon occur in rural and urban residential areas, and
543 recreational areas such as campgrounds. Usually there is one common denominator among human-
544 bear conflicts: food. The food habits of bears in urban and suburban environments include both
545 natural and human-associated foods. Garbage dumps in or near cities were historically an
546 anthropogenic source of food for bears, and although open dumps are largely a thing of the past,
547 bears continue to live in those communities. Conflicts with nuisance bears typically involve garbage
548 cans, bird feeders, feed storage sheds, or food kept in automobiles. If proper precautions are not
549 taken, some of these attractants may concentrate bears and result in localized increases in human-
550 bear conflicts. Access to foods provided through human activities may almost double the
551 reproductive potential of black bears (Rogers 1987). In 2011, ORS 496.731 established a
552 prohibition on knowingly placing food, garbage or other attractants for black bears (and certain other
553 wildlife species) with few exceptions. The most common conflicts related to agricultural damage
554 involve timber production, vineyards, orchards, bee hives, and less frequently, depredation of
555 livestock. Damage may be extensive on local scales in some situations.
556
557 Oregon has several statutes that define legal procedures for resolution of human-bear conflicts
558 (Appendix II). The most encompassing of these statutes is Oregon Revised Statute (ORS) 498.012:
559 Taking of wildlife causing damage, posing a public health risk or public nuisance. This statute
560 allows people to take a black bear, without first obtaining a permit from the Department, for damage
561 to land, livestock, agricultural, or forest crops; ORS 498.012 also defines a nuisance bear as a bear
562 that causes loss or harm upon gardens, ornamental plants, trees, pets, vehicles, boats, structures, or
563 other personal property. Human safety is defined in ORS 498.166: Bears or cougars posing threat to
564 human safety. This statute allows the taking of bears causing human-safety issues without first
565 obtaining a permit, defines reporting requirements, and provides a definition of threat to human
566 safety in terms of bear behavior. Damage caused by bears (or cougars) shall not be compensated by
567 wildlife funds under ORS 496.306.
568
569 The Department typically receives hundreds of damage and nuisance complaints annually (Table 2).
570 Poor growing conditions for vegetation, especially berry-producing plants, during certain years (e.g.,
571 2010) tend to result in more human-bear conflicts. The Department has a policy for handling
572 conflicts with black bears (Appendix VII), which follows a step-wise progression that usually starts
573 with providing advice or educational materials. In situations where property damage or threats to
574 public safety occur and advice regarding non-lethal control fails, the Department may consider
575 capture and relocation of problem bears. Generally, the Department will euthanize bears that are in
576 poor physical condition, have been habituated to human foods, or that cannot be captured safely.
577
578Oregon Department of Fish and Wildlife 17
Oregon Black Bear Management Plan DRAFT
Table 2. Trends in black bear complaints, damage, harvest, and other mortality in Oregon during 1992–
2011. Complaint and mortality data are current through 12 March 2012 and 6 March 2012,
respectively, based on check-in of bears. Numbers may change as late data are added.
Number of Mortalities by Source
Number of Number of Hunter-
Year Complaintsa Tags Soldb Harvestc Damaged Human Safetye Otherf Total
1992 291 17,838 960 215 0 9 1,184
1993 436 18,355 1,346 138 0 1 1,485
1994 327 18,412 1,450 154 3 2 1,609
1995 537 14,685 686 200 5 4 895
1996 561 23,364 1,007 231 9 7 1,254
1997 599 25,893 812 246 13 8 1,079
1998 828 29,743 1,053 274 18 10 1,355
1999 904 34,723 1,037 269 20 18 1,344
2000 322 41,060 1,223 223 17 8 1,471
2001 461 44,661 884 200 36 20 1,140
2002 479 46,980 1,148 178 39 17 1,382
2003 326 48,130 1,129 190 24 18 1,361
2004 326 43,716 221 15 20
2005 298 44,785 1,087 268 19 20 1,394
2006 275 46,482 1,277 197 18 15 1,507
2007 323 51,720 1,225 187 7 17 1,436
2008 602 53,847 1,183 268 45 52 1,548
2009 365 50,387 1,223 210 25 48 1,506
2010 920 57,711 1,639 388 30 83 2,140
2011 384 57,472 1,346 352 22 52 1,772
a
Number of complaints received during the calendar year. Sightings not associated with damage or a
public safety concern are included as complaints prior to 2000.
b
Includes controlled spring, general fall, and additional tags (including Sports Pac licenses).
c
No harvest survey conducted during 2004.
d
Number of animals killed as a result of damage during a calendar year.
e
Animals killed as a result of real or perceived threat to humans or pets.
f
Includes roadkill, accidental, found dead, or illegal kill.
579
580Oregon Department of Fish and Wildlife 18
Oregon Black Bear Management Plan DRAFT
581 Only non-threatening bears that have not caused damage may be considered as potential candidates
582 for relocation, provided public safety is not compromised and a suitable relocation area exists. Most
583 human-bear conflicts in Oregon are resolved using advice or non-lethal solutions. In an effort to
584 educate the public to prevent conflicts with bears, the Department provides information (e.g.,
585 brochures, presentations, web sites) on how homeowners, hikers, and campers can live with bears
586 (see Living with Black Bears at http://www.dfw.state.or.us/wildlife/living_with/black_bears.asp). In
587 addition, the Department issues news releases informing local communities of bear problems and
588 solutions and may post signs in areas when there is a bear causing human-safety concerns.
589
590 The vast majority of human-bear conflicts that result in bears being killed occur in western Oregon.
591 In 2010, of the 418 bears killed for causing damage or for human-safety issues, most (>90%)
592 occurred in western Oregon. Most of the bears killed were causing damage to forest crops (see
593 Timber Industry below). A relatively low number of bears are killed for reasons related to human
594 safety or nuisance. The Department provides advice to citizens about non-lethal control techniques,
595 especially to reduce conflicts with these particular issues.
596
597 Human Safety
598
599 As with other large carnivores (or omnivores), there may be a real or perceived issue of human
600 safety in relation to black bears. Attacks by black bears on humans are rare, and are usually related
601 to bears that are conditioned to humans or sources of food provided through human activities
602 (Herrero and Fleck 1990). During 1900–2009, there were at least 63 human fatalities in North
603 America as the result of attacks by black bears, with the majority (86%) occurring between 1960 and
604 2009 (Herrero et al. 2011).
605
606 Only four cases of human-bear interactions have been documented in Oregon in which a human
607 received injuries; there are no documented human mortalities in Oregon as the result of black bears.
608 The first documented attack occurred during August 1988 in Wallowa County. According to the
609 report, a local resident of Wallowa Valley was attacked by a bear while working in the Ferguson
610 Ridge area southwest of Wallowa Lake. The person was apparently chased up a tree and bitten by a
611 black bear. Although details are lacking, it appears that the victim’s dog may have agitated the bear.
612 The second known documented injury occurred on 31 May 2008, in Douglas County, and was the
613 result of a hunter searching for a bear that had been wounded during hunting. The bear attacked the
614 hunter and was dispatched by the hunter with the aid of another person. The hunter had injuries to
615 his arm and received medical treatment. A third documented incident occurred on 29 June 2008, at a
616 residence in Sandy. The resident sustained minor injuries when she checked on a noise on the porch
617 and a bear swatted her leg. The bear apparently had been attracted to garbage cans and bird seed.
618 Area residents were informed of preventative measures to implement to prevent attracting bears.
619 After extensive culvert-trapping and darting efforts, a female and two cubs were captured. It could
620 not be confirmed that this female was the correct bear, so it was relocated with the cubs to a different
621 area. The fourth and most recent documented bear attack in Oregon was similar to the second
622 incident described above. On 24 August 2009, near Coos Bay, a bear believed to be dead attacked
623 the hunter. The hunter was able to dispatch the bear, and was treated for a bite wound to his leg.
624Oregon Department of Fish and Wildlife 19
Oregon Black Bear Management Plan DRAFT
625 Damage and Nuisance
626
627 Agricultural Producers
628
629 Black bears are omnivores and farm crops can be attractive sources of food. Fruit orchards,
630 especially apples, can attract bears. Bears will not only eat the fruit, but often damage or destroy the
631 trees by breaking branches and trunks as they climb and forage. Extensive damage may also occur to
632 vineyards for similar reasons. In addition to honey production, farms often have bee hives to help in
633 pollination of fruit trees and shrubs, such as blackberries. Bears can destroy apiaries as they search
634 for the bee larvae and honey; the economic loss can be substantial. Bears occasionally kill livestock
635 (e.g., goats, sheep, cattle) and domestic fowl (e.g., chickens, turkeys). Although few black bears kill
636 livestock, once they exhibit the behavior they often continue to do so (Hygnstrom 1994).
637
638 Forest Management
639
640 Forest management is conducted by private landowners and government agencies, primarily county,
641 state, and federal land management agencies; forest management goals among groups may differ
642 substantially. Damage to trees by black bears was reported as early as the turn of the 20th Century,
643 and examinations of harvested timber indicated this behavior occurred prior to that time (U.S.
644 Department of Agriculture [USDA] 2003). However, it was not until the 1940s, when intensive
645 forest management became common, that foraging on trees by black bears was identified as a
646 problem for timber production (Pierson 1966). Black bears damage trees through their spring
647 foraging activities in coastal regions from northern California to Alaska, and portions of the Rocky
648 Mountains, New England, and Japan (see Noble and Meslow 1998). In Oregon, damage to
649 commercial timber by black bears is almost exclusively limited to the western portion of the state
650 (USDA 2003). Primarily during the months of May and June (although timing may vary from year
651 to year apparently in response to weather conditions that affect the timing of plant growth), black
652 bears peel the bark of trees to eat the sugar-rich sapwood (phloem) by scraping it from the surface
653 with their teeth (Poelker and Hartwell 1973, Schmidt and Gourley 1992). This behavior is referred
654 to as tree-peeling.
655
656 Black bears exhibit a preference for the healthiest and fastest-growing trees such as those in recently
657 thinned or fertilized stands (Mason and Adams 1989, Kanaskie et al. 1990, Schmidt and Gourley
658 1992) because these silvicultural practices may increase sugar concentrations in the lower bole of the
659 tree (Kimball et al. 1998). In western Oregon, Douglas-fir (Pseudostuga menziesii) and western
660 hemlock (Tsuga heterophylla) are the most common species on which black bears forage, with
661 western red cedar (Thuja plicata) peeled to a lesser extent (Kanaskie et al. 2001). Barnes and
662 Engeman (1995) studied the effect of black bear damage on timber resources in the Cascade Range
663 west of Sisters in a stand that lacked Douglas-fir. Bears fed on young, fast-growing lodgepole pine
664 and ignored ponderosa pine, subalpine fir, and grand fir that were also available.
665
666 Black bears generally peel trees near the base of the tree (the trunk or bole), and utilize trees that are
667 15–30 years old. Damaged boles can significantly reduce quality of “butt logs,” which are often the
668 most valuable section of trees. Sometimes older trees may be damaged, but often higher up the bole
669 (Schmidt and Gourley 1992). The peeling and feeding behavior may result in trees that are
670 completely or partially girdled. Complete girdling results in killing the tree, and partial girdling canOregon Department of Fish and Wildlife 20
Oregon Black Bear Management Plan DRAFT
671 cause mortality to trees or reduce growth and vitality of trees that survive (Pierson 1966, Schmidt
672 and Gourley 1992, Kanaskie et al. 2001). Tree-peeling has been hypothesized to be a learned
673 behavior whereby cubs learn from females (Schmidt and Gourley 1992). In Oregon, data suggested
674 most bears taken on timber damage sites are young males (ODFW 1993). Energetics may also play
675 a role during spring, as damage may be higher in areas where bears have diets containing relatively
676 high proportions of grasses and forbs as opposed to areas with bears having diets dominated by
677 berries (Noble and Meslow 1998).
678
679 Damage to young timber stands can be extensive. Damage through tree-peeling can negatively
680 affect the economic value and health of timber stands (Kanaskie et al. 1990). Tree damage may
681 accumulate over the 10–20-year period when trees are most vulnerable to bear peeling (Schmidt and
682 Gourley 1992, Kanaskie et al. 2001). Bears may peel up to 70 trees/day during the spring months,
683 but damage to stands may be highly variable (Schmidt and Gourley 1992). Damage through tree-
684 peeling in individual stands may vary from a few trees to more than 75% of the trees (Hartwell and
685 Johnson 1988, Mason and Adams 1989, Schmidt and Gourley 1992). On the east side of the
686 Cascades, a study indicated that 18% of affected trees suffered damage to over 75% of their
687 circumference and were expected to die based on the fate of previously damaged trees in the study
688 area (Barnes and Engeman 1995).
689
690 In an effort to assess bear damage to timber resources, the Oregon Department of Forestry initiated
691 ongoing aerial surveys in western Oregon in 1988. A combined aerial survey and ground-
692 verification effort conducted in 1989 covered 2.4-million forested acres (almost 1 million ha) and
693 estimated 347,000 conifers were damaged annually by bears. Of the damaged trees, about one-third
694 were killed by complete girdling, and about two-thirds were damaged but alive (Kanaskie et al.
695 1990). In 2000, a similar aerial survey and ground verification covered >6.4-million forested acres
696 (2.6 million ha) and an estimated 55,180 trees were damaged annually, of which one-third had died
697 (Kanaskie et al. 2001). In 2010, about 7.7-million forested acres (3.1 million ha) were aerially
698 surveyed, but only data on current-year mortality (without ground verification) were collected
699 (Oregon Department of Forestry, unpublished report). Although the proportional area of timber
700 damaged may not seem significant, damage is often concentrated locally and may significantly
701 impact individual landowners. Nolte and Dykzeul (2002) suggested a present-day annual financial
702 loss of $11.5 million to the timber industry as the result of damage from black bears.
703
704 Between 2003 and 2008, 140–229 black bears were killed annually in Oregon as a direct result of
705 damage to timber. Many bears killed for damage control were in Coos and Curry counties in
706 southwestern Oregon. As part of the 2005 legislative budget process, the Oregon Legislative
707 Assembly directed the Department to implement a study evaluating the economic impact of bear-
708 related damage to timber in Coos and Curry counties in southwestern Oregon. Objectives were to
709 identify the potential extent and amount of damage due to black bears peeling trees, and to estimate
710 the potential economic impacts including number of jobs and income lost in Coos and Curry
711 counties resulting from black bear damage to commercial forests. Aerial surveys (fixed-wing and
712 helicopter) were conducted in 2006 where 8,675 acres (3,511 ha) were identified as potentially
713 damaged by black bears in Coos and Curry counties. Nearly 2,000 acres (810 ha) of the potentially
714 damaged sites were randomly selected and the extent and intensity of bear damage to the timber
715 stands was measured. These data were used to model timber yield with and without damage for
716 industrial forest lands in the counties. Multipliers for timber-associated jobs (7.1/million board-feet)You can also read