Maryland Chesapeake Bay Oyster Management Plan (May 2019)
←
→
Page content transcription
If your browser does not render page correctly, please read the page content below
Larry Hogan, Governor

                                            Jeannie Haddaway-Riccio, Secretary

Maryland Chesapeake Bay Oyster Management
             Plan (May 2019)
                                                   Fishing and Boating Services
                                                       580 Taylor Ave. B-2
                                                      Annapolis, MD 21401

                                             Toll free in Maryland: 877-620-8367
                                               Out of state call: 410-260-8300
                                             TTY Users call via the MD Relay 711

                                                   dnr.maryland.gov/fisheries

 The facilities and services of the Maryland Department of Natural Resources are available to all without regard to race, color, religion, sex,
                                     sexual orientation, age, national origin or physical or mental disability.

                    This document is available in alternative format upon request for a qualified individual with disability.

                                                                                                                   05/2019 | DNR 17-012319-117

Preface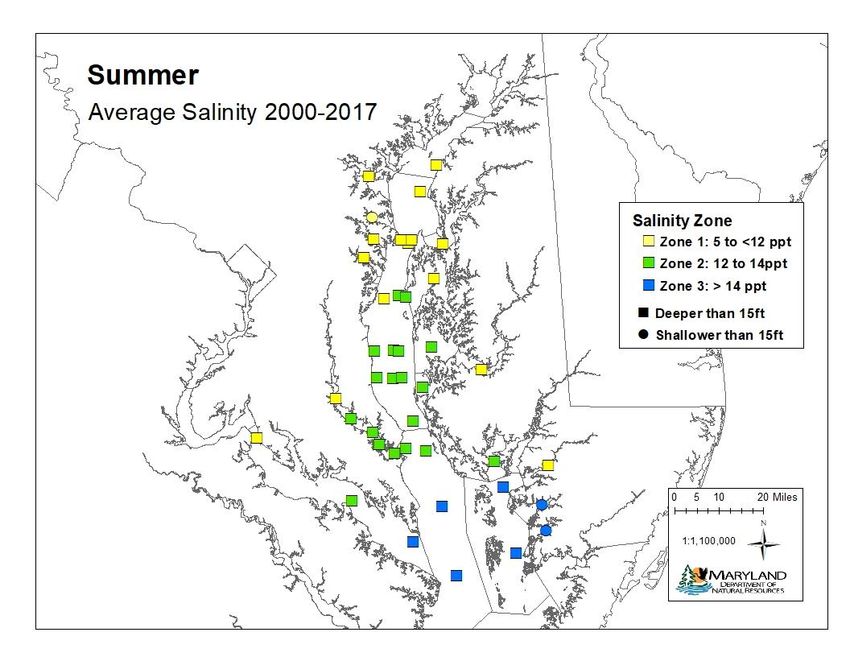
Fishery Management Plan Background

Fishery Management Plans (FMPs) serve as a framework for conserving and wisely using
fishery resources. An FMP provides a format for undertaking management measures throughout
Maryland state waters. In addition, FMPs allow the Department of Natural Resources to
specifically address issues that are unique to Maryland resources. The goal of an FMP is to
protect the resource while allowing sustainable harvest. For example, the Atlantic States Marine
Fisheries Commission (ASFMC) states that the main objective of fisheries management is to
“allow enough harvest to sustain and build the fishing and seafood industries while protecting the
productivity and sustainability of the marine ecosystems.” Therefore, ecological, economic and
sociological factors affecting the resource are considered in the process. Elements of a plan
include: quantifying biologically appropriate levels of harvest; identifying habitat requirements
and recommending protection and restoration measures; expanding single-species management
to include ecosystem-based approaches; monitoring the status of the resource, including fishery-
dependent and independent surveys; and defining and enforcing management recommendations.

Development of an FMP begins with the Maryland Department of Natural Resources Fishing
and Boating Services staff preparing a draft document. Guidelines for the contents of a plan have
been delineated in Natural Resources Article, §4-215, Annotated Code of Maryland. Staff review
previous management measures, current monitoring data and results, stock assessment
conclusions, scientific research data, ecosystem and socioeconomic factors, and other relevant
data and information. The plan development team defines goals, objectives, strategies and
options/actions for addressing problems/issues. The plan is then reviewed by the Department’s
advisory commissions such as the Sport Fisheries Advisory Commission (SFAC), Tidal Fisheries
Advisory Commission (TFAC), Oyster Advisory Commission (OAC) and Aquaculture
Coordinating Council (ACC). After review by the advisory bodies, the plan undergoes a 30-day
public comment period. Public comment is incorporated in the final version of the plan when
practicable and then the final plan is adopted by the appropriate Maryland authorities.

Upon adoption of an FMP, the appropriate management entities will advance the recommended
actions. In some cases, regulatory and statutory actions may be necessary to fully implement a
management action and must go through the appropriate process, including scoping and public
comment. The progress of FMP implementation is tracked and the status of the stock and fishery
is annually updated. If the status of a stock changes significantly and management strategies are
changed accordingly, amendments and revisions to the plan may be recommended.

                Maryland Chesapeake Bay Oyster Management Plan, Maryland Department of Natural Resources, 5/16/2019
                                                                                                                  1
Table of Contents
1.0 Introduction                                                                                                      3

2.0 Oyster Management                                                                                                9
    2.1 Goal                                                                                                         9
    2.2 Objectives                                                                                                   9
    2.3 Adaptive Management                                                                                         10
    2.4 Salinity Influences on Oyster Populations                                                                   12
    2.5 Partners                                                                                                    14

3.0 Substrate                                                                                                       15

4.0 Stock Status                                                                                                    18
    4.1 Biological Reference Points                                                                                 19

5.0 Sanctuaries                                                                                                     26
    5.1 Oyster Gardening for Sanctuary Enhancement                                                                  30

6.0 Fishery Management                                                                                              32
    6.1 Fishery Management Areas                                                                                    33
    6.2 Harvest Reserves Areas                                                                                      36
    6.3 Rotational Harvest Areas                                                                                    37
    6.4 Seed Areas                                                                                                  38
    6.5 Opening and Closing Oyster Bars                                                                             40
    6.6 Replenishment Plantings                                                                                     41
    6.7 Public Health and Oyster Harvest                                                                            43
    6.8 Recreational Harvest                                                                                        46

7.0 Aquaculture                                                                                                     47

8.0 Monitoring                                                                                                      50

9.0 Socioeconomic Considerations                                                                                    53

10.0 Enforcement                                                                                                    55

11.0 Ecosystem Considerations                                                                                       57

12.0 Research Needs                                                                                                 60

Glossary                                                                                                            63

References                                                                                                          68

Figures                                                                                                             73

Appendix A. Description of Oyster Management Tools                                                                  87

                     Maryland Chesapeake Bay Oyster Management Plan, Maryland Department of Natural Resources, 5/16/2019
                                                                                                                       2
1.0 Introduction
Life History
The Eastern oyster, Crassostrea virginica, is native to coastal waters from the Gulf of St.
Lawrence in Canada to the Atlantic coast of Argentina (Carriker and Gaffney, 1996). It is
common in estuaries and coastal areas of reduced salinity and can occur as extensive reefs or
'bars' on hard to firm bottoms in both the intertidal and subtidal zones (Carriker and Gaffney,
1996). As is typical of animals that have evolved to inhabit an environmentally variable estuarine
environment, oysters can tolerate a broad range of both temperatures and salinities (Shumway,
1996). In Maryland, sub-freezing temperatures and ice scouring restrict oyster bars to the
subtidal zone (Galtsoff, 1964).

In Maryland’s Chesapeake Bay, variable salinity and temperature regimes are the primary
environmental determinants of oyster population dynamics given their influence on reproduction,
growth and mortality (Shumway, 1996). Mortality rates are interrelated with temperature and
salinity because of the presence of two oyster protozoan parasites, Perkinsus marinus (Dermo
disease) and Haplosporidium nelsoni (MSX). Dermo disease was identified in Chesapeake Bay
oysters in 1949 but did not become a major problem until the mid-1980s (Ford and Tripp, 1996).
MSX appeared in Chesapeake Bay in 1959, and by the 1970s had dramatically reduced oyster
densities in Virginia's high salinity oyster habitat (National Research Council, 2004). MSX is
active at temperatures above 10°C although it is intolerant of salinities below 10 parts per
thousand (ppt) (Ford and Tripp, 1996). The highly lethal Dermo disease proliferates most rapidly
at temperatures between 25° and 30°C and salinities greater than 15 ppt, but survives at much
lower temperatures and salinities (Ford and Tripp, 1996). During the latter part of the 20th
century, these diseases had a devastating impact on oyster populations in Chesapeake Bay,
although they acted on a population that was already compromised by poor water quality, fishing
pressure and habitat loss (National Research Council, 2004). The presence of these two
pathogens adds complexity to oyster population dynamics in Chesapeake Bay because associated
mortality rates may vary substantially among years and spatially within the same year depending
on where oysters are located within Chesapeake Bay. A recent study by the Virginia Institute of
Marine Science demonstrated Chesapeake Bay wild oysters are developing increased resistance
to these diseases but it is still unknown how the resistance was developed (Virginia Marine
Institute of Science 2019). Future research on this topic could provide important insight for
overcoming the negative impact of these diseases on oyster populations.

                Maryland Chesapeake Bay Oyster Management Plan, Maryland Department of Natural Resources, 5/16/2019
                                                                                                                  3
Gametogenesis and spawning in oysters are directly correlated with water temperature
(Shumway, 1996). In Chesapeake Bay, oysters begin gametogenesis in the spring and spawning
can occur from late May to late September but generally peaks in late June/early July (Shumway,
1996; Thompson et al., 1996). The larval stage lasts for about 2 to 3 weeks, depending on food
availability and temperature. Larval growth rates increase rapidly with increasing temperature;
the fastest rates occur near 30°C. Larvae appear to migrate vertically, particularly at later stages
and tend to concentrate near the bottom during the outgoing tide and to rise in the water column
during the incoming tide, thus increasing their chances of being retained in the estuary (Kennedy,
1996; Shumway, 1996).

Oysters are either male or female (the reported incidence of simultaneous hermaphroditism is
less than 0.5 percent) but may change sex over the winter when they are reproductively inactive.
Generally, oysters function as males when they first mature which can happen as early as 6
weeks post settlement (Thompson et al., 1996). As individuals grow, the proportion of functional
females in each size class increases, with an excess of females occurring among larger (and
presumably older) animals (Galtsoff, 1964). As oysters grow larger and heavier, their annual
fecundity (number of eggs produced) increases. In addition, oyster fecundity rises very quickly
with increasing shell height so that even a small increase in the number of older, larger oysters
will cause a large increase in reproductive potential (Mann and Evans, 1998).

There is no definitive study of the longevity of the oyster. Several ages have been proposed, the
most common being 20 years (Sieling, ca. 1972; Buroker, 1983; Mann et al., 2009; NOAA-CBO,
2018), but the statements are either unsupported or make questionable inferences from other
sources. Oysters from plantings in Maryland have been reported to survive at least 9 years
(assuming no natural reproduction in these areas; Paynter et al., 2010).

Current Status
Maryland’s oyster population is currently estimated at a historically low abundance and the
decline can be attributed to many factors, including harvest pressure, lack of habitat, disease
mortality, reduced water quality and the interactions among these factors. The role of degraded
water quality and its impact on the oyster resource has a dual nature: oysters are negatively
impacted by sedimentation, turbidity and anoxic conditions, which can inhibit oyster restoration,
yet oysters have the potential to improve water clarity by removing algae and suspended solids
from the water through their suspension-feeding activities.

Since 1939, the department and its predecessor agencies have been conducting a Fall Oyster
Dredge Survey in Maryland to assess the overall health of the oyster population. The data
collected by the dredge survey provide critical information for conducting an oyster stock
assessment. Five types of indices are calculated from the dredge survey: the Spatfall Intensity

                 Maryland Chesapeake Bay Oyster Management Plan, Maryland Department of Natural Resources, 5/16/2019
                                                                                                                   4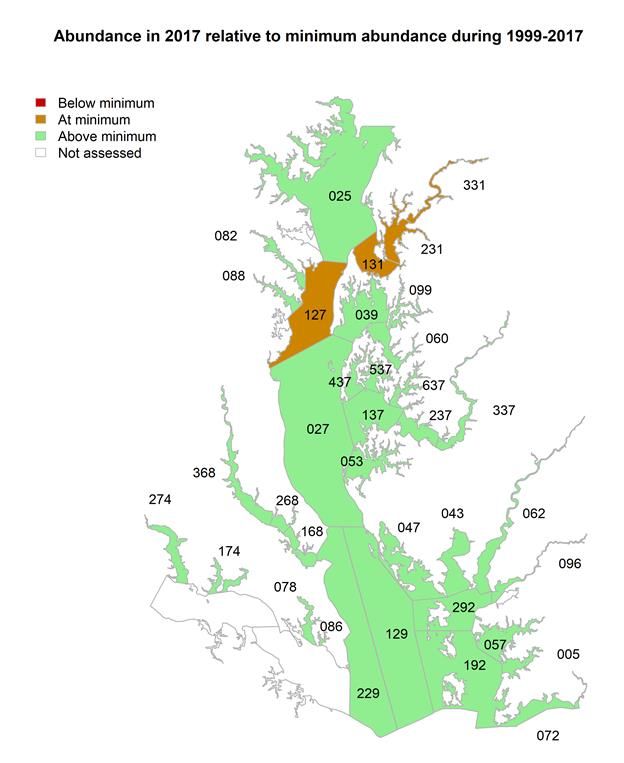
Index, obtained from a subset of 53 oyster bars, is a measure of recruitment success and the
potential increase in the population; the Oyster Disease Indices, derived from a subset of 43
oyster bars, document disease infection levels; the Total Observed Mortality Index, calculated
from the 43 oyster bar Oyster Disease Indices subset, is an indicator of annual mortality rates of
post-spat stage oysters; the Biomass Index measures the number and weight of oysters from the
43 oyster bar Oyster Disease Indices subset relative to the 1993 baseline; and starting in 2005,
the Cultch Index is a measure of oyster habitat from the 53 oyster bar Spatfall Intensity Index
subset (Tarnowski, 2018).

In 2017, the 33-year median value of the Spatfall Intensity Index was 23.6 (spat per bushel of
material) (Figure 1). The index ranged from a minimum of 2.0 in 1996 to 276.7 in 1997. On
average, Tangier Sound, St. Mary’s River and Broad Creek have the highest spatfall values.

In 2017, the Total Observed Mortality Index, an indicator of annual natural mortality, was 14
percent (Figure 2). The Total Observed Mortality Index over 33 years has ranged from a low of 7
percent in 2012 to a high of 58 percent in 2002. The index correlates closely with disease
intensity and prevalence. The mean Dermo disease prevalence was 69 percent in 2017 and mean
infection intensity for dermo disease was 2.5. MSX disease mean prevalence was 3 percent in
2017. Since 1990 when disease information is reported in the Annual Fall Survey, the annual
mean for Dermo prevalence has ranged from 38% to 93%, dermo intensity has ranged from 1.2
to 3.8, and MSX has ranged from 0.1% to 29%.

The Biomass Index is a relative measure of how the oyster population is doing over time. It
accounts for recruitment, individual growth, natural mortality and harvesting in a single metric.
In assessing the size of the population, the Biomass Index integrates both the abundance of
oysters and their collective body weight. The Biomass Index has ranged from 0.53 in 2002 to
2.09 in 2013 and was 1.4 in 2017 (Figure 3).

The Cultch Index is a relative measure of oyster habitat and was 0.83 bushels per 100 feet in
2017. Cultch is crucial for providing hard substrate for oyster setting as well as habitat for the
myriad of other organisms associated with the oyster community.

For the purpose of the Fall Oyster Dredge Survey, cultch is defined as primarily both oysters
(live and dead) and shell. Although 13 years is a comparatively short time frame for discerning
long-term trends in the Cultch Index, a distinctive pattern emerged over this period (Figure 4). A
three-year rolling average was used to smooth out the interannual variability inherent in the
index (the average is associated with the terminal or third year). The increase in the Cultch Index
during the early 2010s reflects improvements in recruitment and survivorship during this period,
especially the strong spatsets in 2010 and 2012. The growth and good survivorship of these year
classes contributed substantially to the index. The subsequent decline may be due to the removal

                 Maryland Chesapeake Bay Oyster Management Plan, Maryland Department of Natural Resources, 5/16/2019
                                                                                                                   5
of these oysters and lower recruitment, as well as ongoing taphonomic processes such as burial,
degradation, etc. (Tarnowski, 2018).

Maryland’s Oyster Fishery
The oyster fishery in Maryland has been managed since the early 1800s (Kennedy and Breisch,
1983). Oysters in Maryland’s Chesapeake Bay are harvested by private aquaculture (discussed in
section 7.0), the recreational fishery (discussed in section 6.6) and the commercial fishery. Peak
historical harvest in the 1880s was 15 million bushels, but at that time, the harvest was loosely
managed and New England fishermen were rapidly removing oysters from the bay to supply
national demand. Oyster populations were dramatically impacted as shown by the great declines
in harvest. Harvest was relatively stable from about the 1920s to the mid-1980s as management
efforts increased. After the 1980s, oyster populations were greatly impacted by the diseases
MSX and dermo which were first noted in oyster populations during the 1950s and 1960s. Given
current harvest regulations and the effects of disease, harvest statistics beginning in the 1980s
provide a more realistic picture of today’s harvest. Since 1980, commercial harvest has ranged
from 2.5 million bushels (1980) to 25,843 bushels (2003) (Figure 5). More recent harvest data,
such as data during the time period associated with the 2018 stock assessment (1999 to 2017),
ranges from 431,013 bushels (2014) to 25,843 bushels (2003).

As required by Natural Resources Article, §4-701, Annotated Code of Maryland, individuals
must have a Maryland commercial fishing license to commercially harvest oysters on public
bottom. In addition to their annual license renewal fee, these licensees must pay an annual
surcharge fee of $300 in order to activate their license to harvest oysters prior to each season.
This allows the department to identify a subset of licensees that are active in an oyster season.
Maryland regulation limits the number of commercial licenses for the harvest of oysters to 737.
Maryland also has a cap of 2,091 commercial fishing licenses that enables the licensee to
participate in a wide variety of fisheries, including oysters. Individuals possessing this 'umbrella'
license must also pay the annual surcharge to harvest oysters. As such, there are 2,828
individuals who have the potential to harvest oysters in any given year (Code of Maryland
Regulations [COMAR] section 08.02.01.05). Since the 1994 oyster season, an average of 804
individuals paid the annual surcharge for oyster harvest (Figure 5). However, this number can
fluctuate dramatically with changes in oyster abundance. For example, the number of surcharges
rose from 599 in the 2011-2012 season to 1,134 in the 2014-2015 season, likely the result of
above average spat sets occurring in 2010 and 2012 that increased the availability of oysters for
harvest. Between the 2009-2010 to 2017-2018 harvest seasons, an annual average of 20 percent
(ranging from 8 percent to 37 percent) of individuals that purchased an oyster surcharge reported
harvesting no oysters.

Unlike many other species, the state and the commercial fishing industry invest in oyster
management through replenishment planting activities. The replenishment plantings are currently

                 Maryland Chesapeake Bay Oyster Management Plan, Maryland Department of Natural Resources, 5/16/2019
                                                                                                                   6
funded by a grant from the Maryland Department of Transportation, revenue from the oyster
bushel tax and revenue from the purchase of an oyster surcharge from the commercially licensed
fishers. The average annual revenue generated from the bushel tax since 1991 is $208,740
(excludes export tax). The oyster surcharge is currently set at $300 and produces an average
revenue of $241,062. There is currently no data available on revenue generated from the
recreational fishery since recreational harvesters are prohibited from selling their oysters.
Furthermore, no information is known regarding revenue from participating in recreational
harvest (e.g. purchasing recreational harvest gear).
Whereas all revenue generated from the oyster bushel tax, export tax, and oyster surcharge go
towards public fishery replenishment plantings of seed and substrate, an annual grant from the
Maryland Department of Transportation funds various functions within the department. The
grant started in 1997 and the amount has ranged from $1.5 million to $2 million dollars annually.
On average about 60% of these funds go towards planting seed and substrate on public fishery
bottom. The remainder of the MDOT funds has been used for operational costs, monitoring, and
sanctuary plantings. Since 2011, the department also has received other funding towards
sanctuary restoration (a federal grant from NOAA and state capital funds).
There are a variety of permissible gears for the commercial harvest of oysters. Gear types are
restricted both in terms of when and where they can be used as well as in their dimensions
(COMAR section 08.02.04). The primary gears are hand tongs, patent tongs, diver, power dredge
and sail dredge. Hand tongs are typically constructed of two wooden shafts ranging from 16 to
30 feet with rakes at the ends to harvest oysters. Patent tongs are similar to hand tongs, except
the patent tongs are suspended from a cable, are larger and heavier and are opened and closed
with hydraulic power. Divers use a surface-supply air hose or, in some cases, SCUBA to collect
oysters, cull them and then send them to the surface. A power dredge is a chain-mesh bag
attached to a frame that is lowered to the bottom using a winch. The dredge is pulled along the
bottom using a motorized vessel to collect oysters and then retrieved. A sail dredge, operated
from a sailboat or skipjack, is typically a chain-mesh bag attached to a frame and pulled across
the bottom using a boat under sail power. Sail dredges are allowed to use an auxiliary yawl boat
to push the skipjack two days per week, which renders them similar to power dredges. The
average harvest per gear type since the 2009-2010 harvest season is 48 percent by power
dredging, 21 percent by patent tongs, 15 percent by hand tongs, 9 percent by sail dredge and 7
percent by diving. The average number of individuals harvesting by gear type is 51 percent by
power dredging, 22 percent by patent tongs, 21 percent by hand tongs, 5 percent by diving and 1
percent by sail dredge (Note: an average of 33 percent of watermen use multiple gears to harvest
throughout the season).
Fishery managers began a more comprehensive and coordinated management of oysters
throughout Chesapeake Bay with the adoption of the Chesapeake Bay Oyster Management Plan
Maryland Chesapeake Bay Oyster Management Plan, Maryland Department of Natural Resources, 5/16/2019
7(1989), subsequent revisions in 1994 and 2004, and an amendment in 2010. In addition, efforts
to rebuild Chesapeake Bay’s native oyster resource have been directed by commitments in the
Chesapeake 2000 Agreement, 2009 Programmatic Environmental Impact Statement, 2010
Maryland’s 10-Point Oyster Restoration Plan and 2014 Chesapeake Bay Watershed Agreement.
Since the oyster management plan addresses more than just the public fishery, the plan uses a
more comprehensive title, the “Maryland Chesapeake Bay Oyster Management Plan,” but is still
considered a fishery management plan as described in the preface.
Maryland Chesapeake Bay Oyster Management Plan, Maryland Department of Natural Resources, 5/16/2019
82.0 Oyster Management
The purpose of the 2019 Maryland Chesapeake Bay Oyster Management Plan (OMP) is to
provide both a general framework and specific guidance for implementing a strategic,
coordinated, multipartner management effort. Representatives from the department developed
the plan with stakeholder input from the oyster industry, environmental groups, academia,
federal agencies and the general public. The plan defines multiple strategies for protecting,
rebuilding and managing the native oyster population. Two source documents provided
information for this plan: the Oyster Management Review 2010-2015 (Maryland Department of
Natural Resources, 2016); and a stock assessment of the Eastern Oyster, Crassostrea virginica,
in the Maryland waters of Chesapeake Bay (Maryland Department of Natural Resources, 2018).
2.1 Goal
The goal of the 2019 Maryland Chesapeake Bay Oyster Management Plan is to conserve, protect
and where possible, rebuild oyster populations to fulfill their important ecological role and to
support the culturally significant oyster fishery and industry throughout the Maryland portion of
Chesapeake Bay.
Achievement of this goal could:
● Produce more oysters than are removed each year by natural mortality and harvest;
● Accelerate recovery of the Chesapeake Bay and improve water clarity by filtering
sediment and phytoplankton from the water, in turn reducing nitrogen and phosphorus
levels;
● Provide ecosystems benefits and ecologically valuable reef habitat for crabs, fish, benthos
and other organisms;
● Result in fishing levels that are consistently around the target within 8 to 10 years;
● Support Maryland's traditional fishing economy and cultural heritage;
● Enhance opportunities for aquaculture; and
● Generate additional revenue from processing, shipping and secondary sales of Maryland
oyster products.
2.2 Objectives
Overarching Oyster Resource Objectives:
1. Develop and implement compatible and equitable management measures for the oyster
resource throughout Maryland’s Chesapeake Bay.
2. Utilize the best available data to support science-based management of the oyster
resource.
3. Include the benefits of ecological services provided by oysters as part of an ecosystem-
based approach to managing the oyster resource.
Maryland Chesapeake Bay Oyster Management Plan, Maryland Department of Natural Resources, 5/16/2019
94. Apply an adaptive management approach to modify or adjust objectives, strategies and/or
actions as monitoring results, scientific data and other relevant information become
available to improve outcomes.
5. Continue oyster population surveys, fishery monitoring programs, and ecological and
ecosystem monitoring, and make improvements as needed.
6. Consider the interactions of different management areas and sector interests (e.g., public
fishery, aquaculture, sanctuaries) in the development of equitable management measures.
7. Develop enforcement strategies that are compatible with the spatially defined
management areas and their specific objectives.
8. Solicit public input on management of the resource for the benefit of all citizens.
9. Take into account socio-economic considerations during management decisions.
10. Ensure adherence to public health requirements during the deliberation of management
decisions.
Sanctuary Objectives:
1. Increase oyster populations to levels that improve important ecological functions and
yield adequate broodstock to sustain regional populations.
2. Improve oyster habitat and increase oyster biomass by utilizing appropriate techniques
considering the influence of environmental conditions.
3. Conserve and protect oyster habitat and biomass through maintenance of sanctuaries so
that a minimum of 20-30% of oyster habitat, and 50% of the 'best bars' are within
sanctuaries.
4. Conduct and complete large-scale restoration in five tributaries by 2025.
5. Support, enhance, and increase ecological restoration activities in other tributaries
throughout the Chesapeake Bay.
Public Fishery Objectives:
1. Achieve a sustainable public oyster fishery.
2. Manage the oyster fishery according to science-based biological reference points through
harvest rates that are based on oyster stock assessments.
3. Manage the oyster fishery using a combination of input and output controls, habitat
modification and stock enhancement to meet targets and thresholds.
Aquaculture Objectives:
1. Support policies and partnerships that increase private investment in oyster aquaculture.
2. Expand oyster aquaculture production in areas of suitable habitat.
2.3 Adaptive Management
Adaptive management is a structured, iterative process of decision-making. It generally involves
a variety of strategies and techniques that can be refined or modified based on input from
Maryland Chesapeake Bay Oyster Management Plan, Maryland Department of Natural Resources, 5/16/2019
10monitoring results, new scientific research data and/or improved understanding from empirical
observations. Since adaptive management is based on a learning process, initial objectives and
actions will most likely need to change over time and will ultimately improve long-term
management outcomes. Adaptive management requires feedback, flexibility and the ability to
adapt and make necessary changes. Implementation of adaptive management could include
establishing or modifying certain parameters of the oyster fishery by public notice to allow
flexibility in developing a sustainable fishery.
Essential elements of adaptive management for oysters include biological considerations, results
from restoration projects, evaluations of fishery management measures and the periodic
reassessment of objectives. Oyster restoration efforts (activities to restore oyster populations for
ecosystem and ecological benefits), replenishment (activities to improve the public fishery for
economic benefits) and fishery management strategies may differ by salinity zone. The extent of
disease mortality, natural recruitment and the results of activities in special management areas
(sanctuaries and public fishery areas) will factor into the determination of the type of habitat and
seed restoration, replenishment efforts and fishery management measures that take place in a
particular salinity zone. Restoration activities will be focused in areas that will maximize the
possibility of success, while optimizing monitoring and funding resources. Geospatial analysis of
relevant data (e.g., salinity, bottom type, environmental conditions, spat settlement history,
disease and biomass estimates, etc.) will aid in the decision-making process. Spatially explicit
population dynamic models that include the major factors influencing mortality and recruitment
rates across multiple salinity regimes, may help to develop appropriate management strategies.
The department will also continue to support restoration activities in tributaries throughout
Chesapeake Bay.
Adaptive Management Strategy 2.3
The department has practiced and will continue to practice a policy of adaptive management.
Before oyster projects are implemented in Maryland’s Chesapeake Bay, the results of previous
efforts will be considered to formulate the best approach for each project.
Action 2.3.1
Utilize the best available data and knowledge from oyster projects collectively to maximize the
success of each project.
Action 2.3.2
Utilize the following essential elements of adaptive management as a guideline to improve the
success of oyster projects in consultation with stakeholders and partners:
1. Project Design: The department will provide as much information as possible about the
methods and performance metrics for each project.
2. Objectives: Project objectives must relate to one or more of Maryland’s oyster objectives.
Maryland Chesapeake Bay Oyster Management Plan, Maryland Department of Natural Resources, 5/16/2019
113. Project Review Process: Project plans and site designations should be evaluated through
an ongoing review process.
4. Monitoring: Projects must specify an adequate monitoring protocol and include, if
necessary, funding to implement the monitoring. Data will be collected in a standardized
format and maintained in compatible databases.
5. Evaluation: Results of projects will be shared among the restoration partners and
stakeholders through the ongoing project review process and through the development of
information management systems.
6. Application: The lessons learned from all of the previous steps will be incorporated into
the next iteration of the adaptive management process starting with the project design,
thereby improving the project outcomes over time.
Action 2.3.3
Utilize public notices to modify oyster fishery parameters as an adaptive management measures.
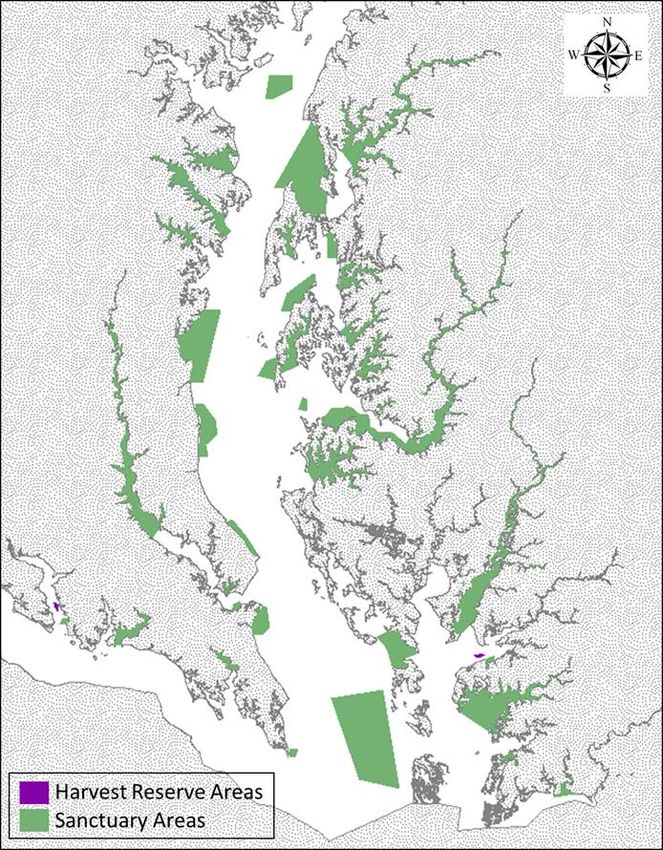
2.4 Salinity Influences on Oyster Populations
Salinity greatly affects oyster reproduction, recruitment and survival as well as the selection and
success of restoration and replenishment activities. All oyster bars in Maryland are located in
mesohaline salinities (5-18 ppt,) but can be divided into three broad zones: low (Zone 1),
moderate (Zone 2) and high (Zone 3). Zone 1 has an average salinity greater than or equal to 5
and less than 1 ppt, Zone 2 has an average salinity greater than or equal to 11 and less than 15
ppt and Zone 3 salinities are greater than or equal to 15 ppt (U.S. Army Corps of Engineers,
Norfolk District. 2009). These zones are governed by freshwater input from rivers, but are
influenced by annual levels of rainfall, wind and tidal mixing. The boundaries of the low- and
high-salinity zones are relatively well-defined, except in extreme climatic events (e.g., drought,
freshet), while the boundaries of the moderate zone fluctuate annually. However, even the low
and high zones can change dramatically due to either severe droughts or record freshets. The best
way to visualize the changing nature of salinity boundaries is to create maps. Two seasons are
represented as examples, spring (April-June) and summer (July-September) (Figures 6 and 7). To
create the maps, salinity data from the Chesapeake Bay Program was averaged from 2000-2017.
By categorizing the mesohaline area of Chesapeake Bay into three zones, some generalizations
about the effects of salinity on oyster life history and different management actions can be
considered. These generalizations are based on long-term salinity patterns and are subject to
modification as environmental conditions dictate.
Zone 1
Zone 1 generally encompasses the portion of the bay above the Bay Bridge in Maryland and the
upper reaches of the Potomac, Choptank, Chester, Patuxent and other tributaries in Maryland.
Maryland Chesapeake Bay Oyster Management Plan, Maryland Department of Natural Resources, 5/16/2019
12Relative to the other zones, Zone 1 is characterized by lower levels of disease and better survival,
but low reproductive capability. It is subject to intermittent, long-term freshets that can result in
substantial mortality, particularly in the upper reaches of the zone. Disease exists in this zone,
but low salinity greatly reduces impacts of disease so there is less disease mortality and oysters
can live longer. However, because of the decreased salinity, spat settlement is very low, often
nonexistent. To increase the oyster population, this area is dependent on planting seed (either
hatchery or wild, natural seed). Continual seed plantings may be needed in areas that are not self-
sustaining through natural recruitment especially at the current low spat settlement levels.
Planting substrate is less cost effective and/or efficient than seed planting as a means to increase
oyster population due to low recruitment.
Zone 2
Zone 2 has fluctuating boundaries based on climatic variation between wet and dry years.
Although Zone 2 appears to be a rather narrow salinity range, it actually encompasses a broad
geographic area. This zone experiences a range of spat settlement from low to moderate to high
due to fluctuating environmental parameters, primarily salinity. Disease mortality can also
fluctuate, generally increasing during drought years and decreasing during wetter periods. When
disease mortality is low, this zone can experience rapid recovery of populations and biomass due
to increased survival in combination with successful recruitment. The reverse can also happen
just as quickly. Replenishment and restoration activities that occur within this area will have
varying results depending on environmental and disease conditions.
Zone 3
Zone 3 is comprised of the lower bay mainstem, including Tangier and Pocomoke sounds.
Salinities in this zone generally fall within what is thought to be the optimal salinity range for
oysters (Shumway, 1996). Although disease pressure can be persistent and mortality rates high,
reproductive capability is maximized so that there is likely to be consistent recruitment of new
oysters. It has been theorized that oysters that survive intense disease epizootics in this zone may
have a genetic disposition toward being more disease-tolerant. This zone may not experience the
dramatic rebounds that are possible in Zone 2 if there are constant, high levels of disease
mortality. Since 2003 disease issues have been low compared to the high disease levels in 1999-
2002. Planting substrate in this zone may be an effective means to increase oyster populations
because there is a higher probability of yearly spat settlement events. Planting seed may be
necessary after high mortality events (e.g., disease related mortality).
Salinity Influences on Oyster Populations Strategy 2.4
Consider the influence of salinity on oyster populations when developing management strategies
and actions for the oyster resource.
Action 2.4.1
Maryland Chesapeake Bay Oyster Management Plan, Maryland Department of Natural Resources, 5/16/2019
13Consider how salinity influences reproduction, growth and mortality (particularly from disease
and freshets) when developing oyster project objectives for sanctuaries and harvest areas.
Action 2.4.2
Continue to closely examine current environmental parameters in each zone since salinity
patterns will vary annually and zonal boundaries will shift and adjust actions as necessary to
reach oyster project outcomes.
2.5 Partners
There are many state, federal and local agencies, organizations, and stakeholders actively
involved in the oyster resource in Maryland and Chesapeake Bay. There are an array of
objectives, directives and interests among the groups. The ultimate goal of the department is a
thriving oyster resource that benefits the ecology, culture and economy of the Chesapeake Bay.
The multi-faceted challenge of managing oysters is bigger than one group can solve alone. It is
in the best interest of all partners to utilize a strategic framework that will focus goals and
objectives, minimize redundancy and optimize the use of limited resources. Working
cooperatively will require a commitment from each group to coordinate with the department for
the planning, monitoring, permitting and implementation of management strategies and actions
for sanctuaries, the public fishery and associated industries and aquaculture.
A coordination process will integrate group effort and ultimately improve oyster outcomes. It is a
continuous process that requires effective leadership and communication to facilitate information
and exchange ideas. Effective coordination involves an accepted organizational structure and
direct interactions through committees and meetings. Each group must take responsibility for
participating in the process.
Partner Strategy 2.5
The department will promote the effective coordination of state, federal and local agencies,
organizations, and stakeholders to meet oyster outcomes for the ecology, culture and economy of
the Chesapeake Bay.
Action 2.5.1
Engage state, federal and local agencies, organizations, and stakeholders in the development and
implementation of effective coordination strategies that maximize cooperation and meet oyster
resource planning objectives and policies.
Maryland Chesapeake Bay Oyster Management Plan, Maryland Department of Natural Resources, 5/16/2019
143.0 Substrate
Oyster larvae require a hard, sediment-free substrate to set upon and metamorphose into oyster
spat. This substrate is often oyster shell. Oysters are unique in that they create the habitat
required for population growth. Shell mass increases when oysters die in place but decreases
when oysters are removed by harvest (Soniat et al., 2014). Planting shell may be able to sustain a
constant shell mass in specific areas over short time periods, but may not be able to maintain a
positive shell budget throughout Maryland’s Chesapeake Bay over the long term. In the absence
of harvest and other anthropogenic effects, the rate of shell accretion through recruitment,
growth and mortality exceeds by some small amount the rate of shell loss (Mann and Powell,
2007). Reefs with higher profiles above the bay bottom appear to promote enhanced oyster
productivity due to less sedimentation and hydrodynamic effects. Low-profile reefs are subject to
sediment deposition on the reef surface thus making the substrate less suitable for recruitment.
Maryland’s Chesapeake Bay is currently shell limited, where shell loss is greater than shell
accretion and there is not enough fresh or dredged shell to replenish and restore all oyster habitat
(Maryland Department of Natural Resources, 2018). Oyster shell plantings in low recruitment
areas may not be the best use of the limited shell available, however, oyster seed (which consist
of live oysters and shell) may be a better option for public fishery replenishment and sanctuary
restoration. Fresh shell comes from shucking houses and dredged shell comes from old shell
deposits buried in the bay bottom. Currently, there are few shucking houses in Maryland and
most fresh shell is being purchased from an out-of-state vendor. The cost of shucked shell
increased from $0.50 per bushel in 2006 to $2.75 per bushel in 2017. There are few deposits of
buried shell left in Maryland’s portion of Chesapeake Bay and the department does not have an
open permit to dredge shell from those remaining deposits at this time. The U.S. Army Corps of
Engineers (USACE), Baltimore District, proffered a provisional permit to the department to
dredge some shell from the Man O’War Shoal on May 17, 2018. Upon the approval of a Water
Quality Certification and Coastal Zone Management Consistency concurrence by the Maryland
Department of the Environment, this permit can be validated by the USACE. The Department is
also exploring other potential shell deposits in the Bay to determine their viability as a source.
Shell can also be recycled from restaurants, the public, food festivals and other events for
hatchery use after they are cleaned and aged, but these supplies are limited.
Due to oyster shell limitations, alternative substrates have been used in restoration projects such
as:
● Biogenic: mixed clam and other shellfish shell and fossilized shell.
● Geologic: sandstone, stone including granite and amphibolite and limestone marl.
● Anthropogenic: porcelain, concrete (including crushed rubble, oyster castles and oyster
reef balls) and stabilized coal ash.
Maryland Chesapeake Bay Oyster Management Plan, Maryland Department of Natural Resources, 5/16/2019
15Many considerations should be examined when selecting substrate for oyster replenishment and
restoration activities. Geologic and anthropogenic substrates may not be preferred in public
fishery areas due to fishing gear constraints. Geologic and anthropogenic substrates could be the
most viable option for oyster sanctuaries but should be used in a manner that does not negatively
impact the Chesapeake Bay (e.g. creating navigational issues by altering the water depth,
introduction of pollution or contaminants, etc.). Using some geologic and anthropogenic
substrates as a foundation in restoration may provide more interstitial space and three-
dimensional structure, thus increasing the ecosystem benefit of reefs as habitat for more species
and increasing surface area for spat settlement. Geologic and anthropogenic substrates can also
be used in combination with natural oyster shell.
Substrate Strategy 3.0
Promote the conservation and protection of natural oyster substrate (oyster shell) and evaluate
and utilize alternative substrates as a method to ensure that the rate of habitat accretion exceeds
loss.
Action 3.0.1
Develop a decision-making process on how to equitably utilize limited natural shell and
alternative substrates for sanctuary restoration, fishery enhancement and aquaculture and make
decisions according to the process.
Action 3.0.2
Explore options for the mitigation of shell loss.
Action 3.0.3
Promote the creation of oyster reefs with higher profiles above the bay bottom to enhance oyster
productivity.
Action 3.0.4
Develop a shell budget that will lead to practical applications, such as but not limited to,
managing shell plantings, enhancing reef restoration, identifying areas of harvest
closures/openings and determining total allowable catch.
Action 3.0.5
Evaluate and develop cost-effective strategies to identify sources and quality of shell and
alternative substrate to supplement oyster habitat throughout Maryland’s Chesapeake Bay.
Action 3.0.6
Maryland Chesapeake Bay Oyster Management Plan, Maryland Department of Natural Resources, 5/16/2019
16Develop comprehensive maps of current oyster habitat within Maryland’s Chesapeake Bay that
include updated oyster bar boundaries and utilize best available data to locate oyster habitat and
ground-truth the best areas for placing available substrate.
Action 3.0.7
Promote and support shell recycling from viable public or private sources.
Action 3.0.8
Evaluate potential strategies including private sector engagement, public-private partnerships
(P3s), and economic incentives to retain processed shell in Maryland.
Action 3.0.9
Evaluate the feasibility and effectiveness of utilizing different alternative substrates in public
fishery areas for the purpose of improving harvest.
Maryland Chesapeake Bay Oyster Management Plan, Maryland Department of Natural Resources, 5/16/2019
174.0 Stock Status
In 2018, the department, in consultation with the University of Maryland Center for
Environmental Science, conducted the first Maryland oyster stock assessment and developed
biological reference points based on the biological characteristics of the oyster population and
other factors affecting the population. In the final year of the stock assessment which was the
2017-2018 season, overfishing was occurring in 19 of the 36 areas assessed. However, the oyster
population was not classified as overfished or depleted (section 4.1). The results of the oyster
stock assessment provide a basis for the department to work with stakeholders to determine
management approaches (Maryland Department of Natural Resources, 2018).
The oyster stock assessment included data from 1999 through 2017 for each National Oceanic
and Atmospheric Administration (NOAA) code harvest reporting region within Maryland’s
Chesapeake Bay. The time frame of 1999 to 2017 was used in the assessment because of
consistent data reporting methods since 1999 and not due to any biological or environmental
factors. Maryland-wide, the estimated abundance of market oysters varied between
approximately 200 and 600 million individuals over the assessment period (Figure 8). Estimated
market abundance was highest in 1999, the initial year of the time series, decreased to about 200
million individuals by 2002 and remained close to that level until 2010. After 2010, estimated
market abundance increased through 2014 to more than 450 million and declined to about 300
million thereafter. In 1999, estimated market abundance was highest in the Choptank River and
Eastern Bay regions. After 2006, estimated abundance was highest in the Choptank River and
Tangier Sound regions. By 2017, estimated market abundance in all Maryland regions was
higher than it was during 2002-2007, but lower than in 1999. This pattern of increase toward
1999 levels of abundance differed among regions, with some regions showing little to no
increase and others showing substantial increases in market oyster abundance since 2002.
Determining mortality estimates is a critical component of assessing the status of the oyster
stock. Natural mortality was generally higher and more variable in the beginning of the time
series (1999 to 2002) than in more recent years, which corresponds with greater disease intensity.
Despite similar temporal patterns, the year in which natural mortality was lower and less variable
varied among the regions of Maryland’s Chesapeake Bay. For example, in most of the Tangier
Sound region, natural mortality became lower and less variable later than in the Choptank region.
In general, average natural mortality was lower in both the northern part of Maryland’s
Chesapeake Bay and farther upstream in the tributaries.
The harvest fraction for each NOAA code is calculated as a percentage of market-size oysters
(greater than or equal to 3 inches) removed from the population by commercial harvest. This
varied over time and among NOAA codes, ranging from zero to approximately 80 percent per
Maryland Chesapeake Bay Oyster Management Plan, Maryland Department of Natural Resources, 5/16/2019
18year. Harvest fraction often tracked abundance in the NOAA codes so that when abundance was
increasing over time and there were no large sanctuaries, the percentage of oysters harvested
generally increased over the same time period. On average, the harvest fraction was highest in
the Tangier Sound region and neighboring NOAA codes. In NOAA codes with no trend or a
declining trend in abundance, harvest fraction tended to be low, but showed some variability.
Stock Status Strategy 4.0
The status of the oyster stock will be evaluated through periodic stock assessments using
monitoring data, best available scientific methodology, environmental considerations and other
relevant information and used to guide oyster management.
Action 4.0.1
Continue to conduct oyster monitoring, including fishery independent and fishery dependent
surveys, to provide data for the stock assessment.
Action 4.0.2
Conduct a Maryland Chesapeake Bay stock assessment at least once every two to five years to
provide information on the status of oysters, re-examine stock assessment methods and
parameters and make any necessary adjustments to the biological reference points.
Action 4.0.3
Continue to refine the oyster stock assessment by improving and incorporating available data.
4.1 Biological Reference Points
Biological reference points are metrics used to assess the status of a stock and for fishery
management they are usually associated with levels of biomass or abundance and fishing
mortality. Maryland law requires that fishery management plans contain the best available
estimates of sustainable harvest rates and minimum abundance levels (Natural Resources Article,
§4-215, Annotated Code of Maryland). Specifically, the statute requires the development of a
lower limit (threshold) reference point for abundance and target and upper limit (threshold)
reference points for harvest fraction (fishing levels). Additionally, there must be objective and
measurable means to determine if the oyster fishery is operating within the reference points.
The threshold (or lower limit) abundance reference point is used to identify the level at which a
fishery is considered overfished or depleted. It represents an abundance of oysters below which
there are likely to be biological, social, ecological and/or economic consequences. An overfished
status does not necessarily result from just harvest but could be the result of other factors such as
an extended period of low recruitment or an extreme natural mortality event. Harvest pressure is
also a consideration. The stock assessment proposed threshold abundance reference point is the
minimum estimated number of market oysters during the period 1999-2017 for each NOAA code
Maryland Chesapeake Bay Oyster Management Plan, Maryland Department of Natural Resources, 5/16/2019
19(Table 1). The choice of the time-series minimum as an abundance threshold is based on the fact
that oysters in most NOAA codes have been able to increase in abundance from their lowest
observed levels, but it is unknown whether populations would be able to persist or even rebound,
if they go below those levels. Market-size oysters were chosen for the threshold because they are
the targeted size group of the fishery and they also produce more eggs per individual than small
oysters (oyster shell height less than 3 inches but older than 1 year in age). This reference point
(using markets) is proposed as an operational definition for depleted status, similar to the
previously used abundance reference points for blue crabs in Chesapeake Bay. Given the current
low abundance of oysters relative to historic periods and significant changes in the ecosystem
(e.g., habitat loss, salinity, disease), it was not possible to generate a suitable method for
calculating an abundance target.
The year with the minimum estimated abundance of market-size oysters varied by NOAA code
(Table 2). The minimum value was reached during 2000-2007 for 22 NOAA codes. Minimum
estimated abundance occurred during the last year of the assessment, 2017, in four NOAA codes
and two NOAA codes had their minimum estimated market abundance in the second to the last
year (Figure 9). The majority of NOAA codes had an estimated market abundance well above
the lower limit abundance reference point in 2017. However, NOAA codes in the Chester River
and one bay mainstem NOAA code had their minimum value in the last year (i.e., at the lower
limit). In addition, two other NOAA codes (129 and 192) had their lowest abundance values in
the second to the last year.
Table 1: Biological Reference Point from 2018 Oyster Stock Assessment based on data from
1999 to 2017.
NOAA NOAA Code NOAA Code Name Abundance Threshold Target
Code Region Threshold Fishing Fishing
(minimum Mortality Mortality
millions of
market-size
oysters)
25 Mainstem Bay Mainstem Upper 5.29 0 0
127 Bay Mainstem Upper Middle 12.73 0 0
27 Bay Mainstem Lower Middle 1.3 0.1 0.05
129 Bay Mainstem Lower Eastern Shore 1.19 0.23 0.12
229 Bay Mainstem Lower Western Shore 2.66 0.06 0.03
Maryland Chesapeake Bay Oyster Management Plan, Maryland Department of Natural Resources, 5/16/2019
20131 Chester Chester River Lower 4.6 0 0
231 Chester River Middle 4.81 0 0
331 Chester River Upper 0.57 0 0
82 Upper Bay Severn River 1.62 0 0
Western
Tributaries
88 South River 0.89 0 0
39 Eastern Bay Eastern Bay 4.15 0.02 0.01
60 Miles River 2.79 0 0
99 Wye River 0.37 0 0
137 Choptank Choptank River Lower 0.51 0.14 0.07
237 Choptank River Middle 2.7 0 0
337 Choptank River Upper 8.5 0 0
437 Harris Creek 2.84 0.02 0.01
537 Broad Creek 5.4 0.16 0.08
637 Tred Avon River 2.78 0 0
53 Little Choptank River 0.85 0.03 0.02
168 Patuxent Patuxent River Lower 2.07 0.08 0.04
268 Patuxent River Middle 0.27 0.03 0.01
368 Patuxent River Upper 2.4 0 0
Maryland Chesapeake Bay Oyster Management Plan, Maryland Department of Natural Resources, 5/16/2019
215 Tangier Big Annemessex River 0.28 0.12 0.06
43 Fishing Bay 0.31 0.45 0.22
47 Honga River 1.75 0.32 0.16
57 Manokin River 0.51 0.14 0.07
62 Nanticoke River 2.42 0 0
72 Pocomoke Sound 2.06 0.19 0.09
292 Tangier Sound North 4.14 0.28 0.14
192 Tangier Sound South 5.05 0.26 0.13
96 Wicomico River East 0.3 0.02 0.01
86 Potomac Smith Creek 0.21 0.13 0.07
174 St. Clements And Breton Bay 0.04 0.01 0
78 St. Mary’s River 0.18 0.26 0.13
274 Wicomico River West 3.46 0 0
In determining appropriate target and threshold harvest fractions to propose for Maryland’s
oyster resource, there was consideration of Natural Resources Article, §4-215, Annotated Code
of Maryland which states that conservation and management measures adopted under a fishery
management plan, to the extent possible “shall prevent overfishing while attempting to achieve
the best and most efficient utilization of the State's fishery resources.” Therefore, the
recommended target exploitation rate (U) is that which provides maximum sustainable yield
(MSY). If UMSY is achieved annually, it is expected to result in a maximum harvest over time,
while resulting in a stable or increasing oyster population (given current abundances of oysters in
Maryland) (Maryland Department of Natural Resources, 2018).
Maryland Chesapeake Bay Oyster Management Plan, Maryland Department of Natural Resources, 5/16/2019
22In order to prevent overfishing, the recommended upper limit for harvest from the 2018 stock
assessment is equivalent to the estimate of UCRASH which represents the absolute maximum
harvest fraction that would allow sustainable harvest. If UCRASH is exceeded over time, it will
eventually result in the disappearance of the population. As noted in Section 3.0, a limiting factor
for oyster population growth is likely their ability to produce shell. Therefore, shell production is
an important process to include in sustainable harvest reference point calculations for oysters. In
the 2018 assessment, the target (UMSY) and limit (UCRASH) reference points were estimated
separately for each NOAA code using a harvest fraction reference point model that describes
population growth as a function of abundance with carrying capacity determined by the amount
of habitat (Table 1, Figure 10 and 11). The amount of habitat depends on habitat production from
living oysters, habitat loss, habitat plantings and a maximum amount of potential oyster habitat
in the system.
For each NOAA code, the correct harvest fraction to use for comparison to the reference points
depends on the management objective for the planted oysters. If oysters were planted with an
objective of supplementing the fishery, then the harvest fraction that accounts for planted oysters
would be the most appropriate for comparison with the reference points. If the oysters were
planted as part of restoration efforts to increase population size, then the harvest fraction that
does not include planted oysters should be used. Annual estimates of harvest fraction from the
assessment model can be compared to the reference points. The adjusted and unadjusted time
series of harvest fraction for each NOAA code relative to the reference points are shown in
Tables 3 and 4.
The 2018 stock assessment produced estimates of UCRASH, ranging from zero to 0.45 per year
and estimates of UMSY, ranging from zero to 0.22 per year among NOAA codes. Estimates of the
target and limit reference point were highest, on average, in the southernmost NOAA codes,
Tangier Sound and the Potomac tributaries and were lower for the more northerly regions.
In the terminal year of the 2018 assessment which was the 2017-2018 harvest season, there was
substantial variability among NOAA codes and regions in their status relative to the harvest
fraction reference points. In the 2017-2018 harvest season, overfishing was occurring in 19 of the
36 areas assessed if harvest fraction is adjusted for spat plantings (Figure 12, Table 4). The
number of areas where overfishing is occurring increases to 31 with unadjusted values of harvest
fraction (Table 3). In areas with targets and/or thresholds at 0 percent, oyster harvest is not
sustainable without planting activities.
Biological Reference Point Strategy 4.1
Utilize biological reference points generated through the most recent stock assessment to
determine the status of the oyster stock.
Maryland Chesapeake Bay Oyster Management Plan, Maryland Department of Natural Resources, 5/16/2019
23You can also read