ILLEGAL BUSHMEAT HUNTING IN THE OKAVANGO DELTA, BOTSWANA - DRIVERS, IMPACTS AND POTENTIAL SOLUTIONS
←
→
Page content transcription
If your browser does not render page correctly, please read the page content below
Illegal Bushmeat Hunting
  in the Okavango Delta,
         Botswana
   Drivers, Impacts and Potential Solutions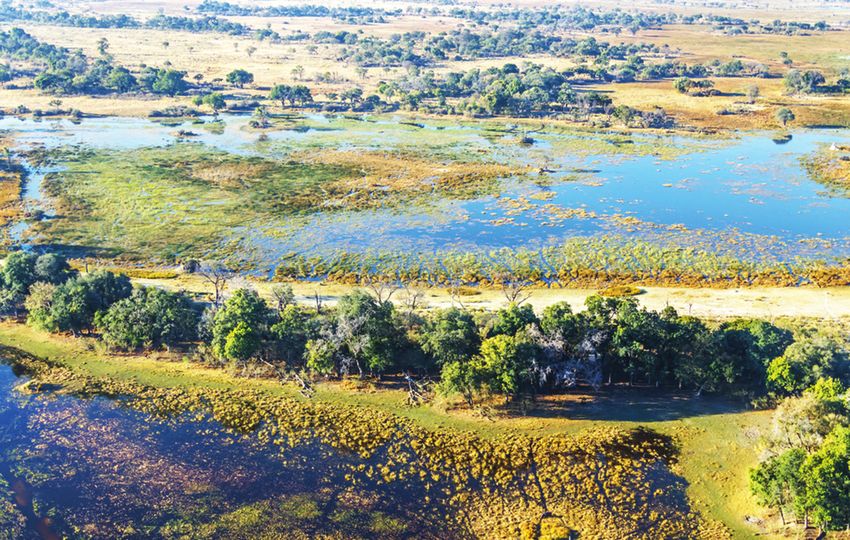
Cover photograph courtesy of Peter Holbrow and Wilderness Safaris

Recommended citation:
Rogan, M.S., Lindsey, P., McNutt, J.W., 2015. Illegal Bushmeat Hunting in the Okavango Delta, Botswana:
Drivers, Impacts and Potential Solutions. FAO/Panthera/Botswana Predator Conservation Trust, Harare.
62 pages.

ISBN: 978-0-620-68693-8 (print)
Illegal Bushmeat Hunting
    in the Okavango Delta,
           Botswana
                     Drivers, Impacts and Potential Solutions

                       Matthew S. Rogan1, Peter A. Lindsey1* and J. Weldon McNutt2
                       Technical Cooperation Programme Project (TCP/BOT/3501)

                            FOOD AND AGRICULTURE ORGANIZATION OF THE UNITED NATIONS
                                                Zimbabwe 2015

1	Panthera
1*	Corresponding author: PLindsey@panthera.org
2 Botswana Predator Conservation Trust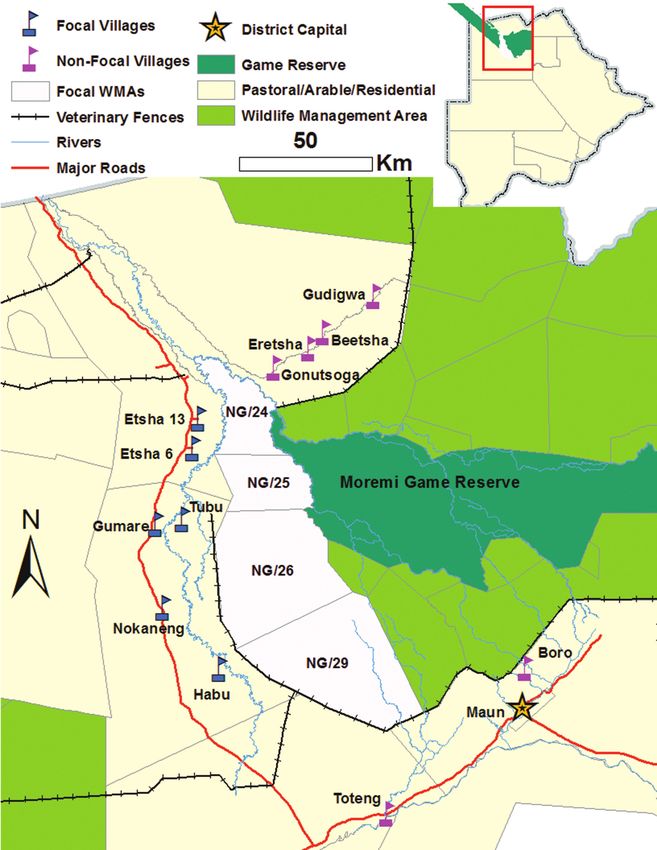
DISCLAIMER

The designations employed and the presentation of material in this information product do not imply the
expression of any opinion whatsoever on the part of the Food and Agriculture Organization of the United
Nations (FAO) concerning the legal or development status of any country, territory, city or area or of its
authorities, or concerning the delimitation of its frontiers or boundaries. The mention of specific companies
or products of manufacturers, whether or not these have been patented, does not imply that these have been
endorsed or recommended by the FAO in preference to others of a similar nature that are not mentioned.

The views expressed in this information product are those of the author(s) and do not necessarily reflect the
views or policies of FAO.

©FAO [2015]

FAO encourages the use, reproduction and dissemination of material in this information product. Except where
otherwise indicated, material may be copied, downloaded and printed for private study, research and teaching
purposes, or for use in non-commercial products or services, provided that appropriate acknowledgement
of FAO as the source and copyright holder is given and that FAO’s endorsement of users’ views, products or
services is not implied in any way.

All requests for translation and adaptation rights, and for resale and other commercial use rights should be
made via www.fao.org/contact-us/licence-request or addressed to copyright@fao.org.

FAO information products are available on the FAO website (www.fao.org/publications) and can be purchased
through publications-sales@fao.org.
CONTENTS
Acknowledgements   2
foreword	3
ACRONYMS	4
Executive Summary	 5
Introduction       8

Methods                                                                   9
	Study area                                                               9
  Interviews                                                              9
	Records of hunting incidents                                            13
  Focus groups                                                           13
	Aerial survey data                                                      13
	Carnivore data                                                          13
	Human population data                                                   14
	Analyses                                                                14
	Estimating the number of hunters                                        14
	Socio-economic characteristics of bushmeat hunters and consumers        15
	Estimating bushmeat offtake                                             15
	Estimating herbivore biomass offtake                                    15

Results                                                                  17
	Number of hunters                                                       17
	Socio-economic characteristics of hunting and bushmeat consumption      17
	Commercial bushmeat                                                     20
	Estimated bushmeat offtake                                              21
	Hunting methods                                                         22
	Anti-poaching, law enforcement and wildlife management                  25
	Species offtake                                                         26
	Total estimated offtake                                                 28
	Relationships between communities and wildlife                          29
	Hunting and tourism                                                     31

Discussion                                                               32
   Drivers of bushmeat hunting                                           32
	Subsistence hunting                                                     33
	The impact of hunting on wildlife populations and tourism               33
	Strategies to reduce illegal hunting                                    34

REFERENCES                                                               38
Appendix A: Questionnaire survey for hunters                             41
Appendix B: Questionnaire survey for heads of households                 50
Appendix C: Questionnaire survey for concession managers                 55
Appendix D: Questionnaire survey for wildlife experts and stakeholders   59
Appendix E: Questionnaire survey for anti-poaching personnel             60

                                                                              1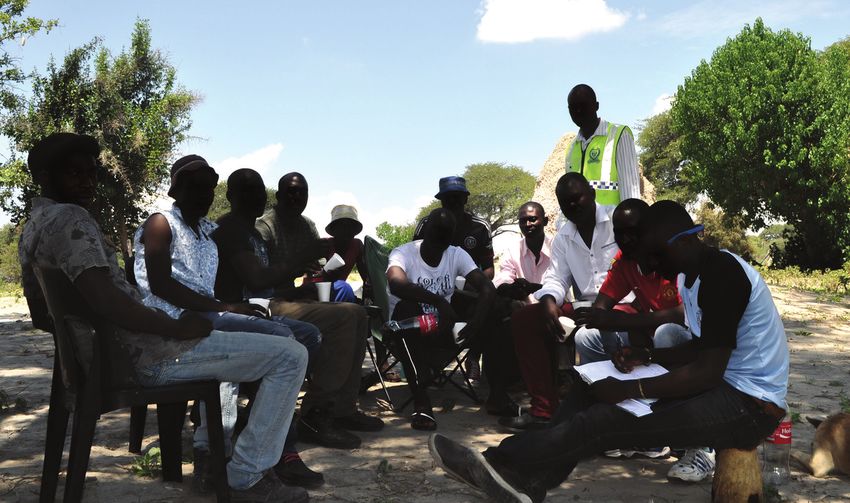
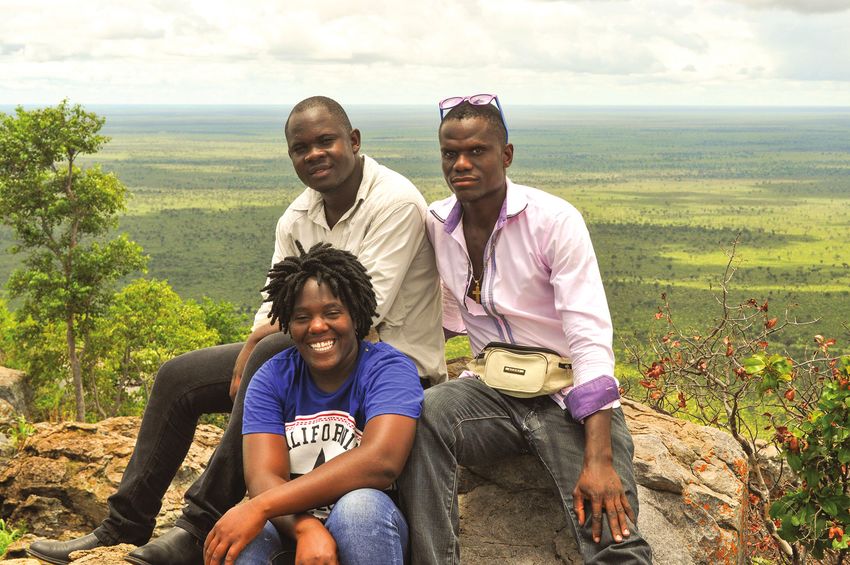
Acknowledgements
The work presented in this report was done thanks to the technical and financial support of the Food and
Agriculture Organization of the United Nations (FAO) Technical Cooperation Programme Facility TCP/BOT/3501 to
the Government of Botswana. Panthera and the Botswana Predator Conservation Trust provided their technical
and financial contributions as implementing partners.

The support and assistance of the Botswana Ministry of Environment, Wildlife and Tourism and the
Department of Wildlife and National Parks is gratefully acknowledged. The project research assistants – Kentse
Madise, Ernest Tjihumino, Ikatametseng Pro Seboifeng, Keone Samxhose and Anna Shaw – were integral to the
research and the project would not have been accomplished without them.

The Botswana Police Service, Magistrate Courts of Ngamiland, Bushcraft APU and the 911 Anti-poaching Operations
Centre are also gratefully acknowledged for their cooperation and willingness to provide valuable records. The
contribution of the following research partners is recognized – Elephants Without Borders, Wilderness Safaris, Craig
Tambling and researchers from the Botswana Predator Conservation Trust. Their collaboration was invaluable.

Above all, the research team salutes the research participants and their organizations for their contributions and
the trust they placed in the project, particularly the hunters who were interviewed or participated in focus groups.

Okavango Bushmeat Project research assistants (clockwise from top left: Ikatametseng Pro Seboifeng, Ernest Tjihumino
and Kentse Madise

2
FOREWORD
The Food and Agriculture Organization (FAO)
Subregional Office for Southern Africa is
pleased to publish and disseminate this
technical paper, titled “Illegal Bushmeat
Hunting in the Okavango Delta, Botswana:
Drivers, Impacts and Potential Solutions”, as
the third publication in an open series of FAO
papers on illegal hunting and bushmeat trade.

The paper reveals the findings of a study
implemented in the framework of the FAO
Technical Cooperation Programme TCP/
BOT/3501 “Investigating the status, scale and
main drivers of illegal hunting and bushmeat
trade in Northern Botswana and assessment of
impact on long-term food security and livelihoods
options”. The project was implemented at the
request of the Government of Botswana as a follow-up to a regional initiative that has been supported by FAO
and the SADC Secretariat since 2012, in close collaboration with the Department of Wildlife and National Parks
under the Ministry of Environment, Wildlife and Tourism, Panthera and the Botswana Predator Conservation Trust.

The results of the study were presented and discussed in depth with the Minister of Environment, Wildlife and
Tourism and his team from the Ministry and the Department of Wildlife and National Parks. FAO is currently
supporting the Government of Botswana in formulating a project which would allow the development and
testing of some of the solutions proposed in the paper.

I believe that the information contained in this report will be very useful, not only to the stakeholders in Botswana,
but would also inform policy-makers and wildlife practitioners in other countries in the region on issues related
to illegal hunting and bushmeat trade and challenges that derive from the Botswana case study.

In fact, this sharing of knowledge and experiences responds directly to the request of the African Forestry and
Wildlife Commission encouraging FAO to partner with other specialized organizations to support the member
countries in their efforts to manage wildlife sustainably and to derive sustainable benefits from wildlife-based
economies to support rural livelihoods and contribute to food security.

Dr Chimimba David Phiri
FAO Representative for Botswana &
FAO Subregional Coordinator for Southern Africa

                                                                                                                    3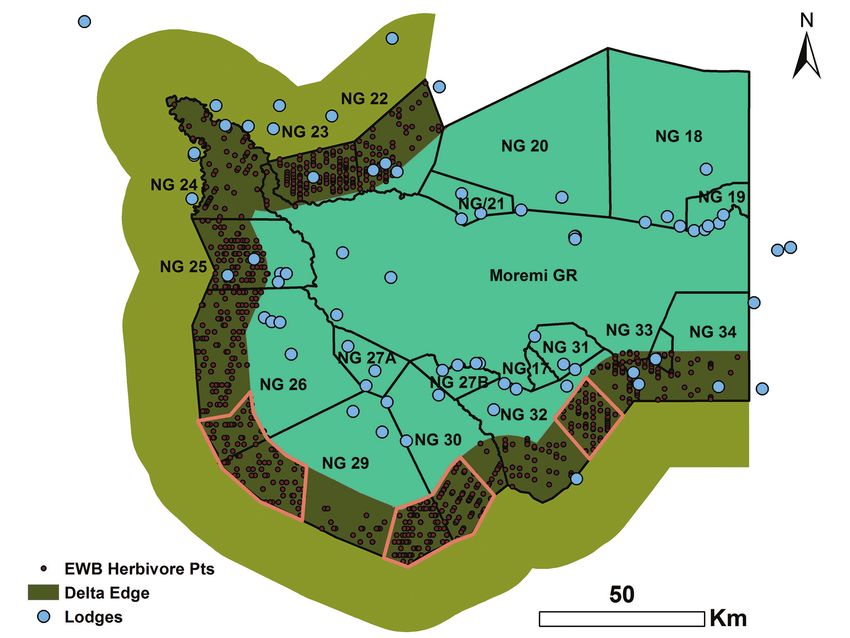
ACRONYMS
    APU      anti-poaching unit
    BDF      Botswana Defence Force
    BPCT     Botswana Predator Conservation Trust
    BWP      Botswana Pula
    DWNP     Department of Wildlife and National Parks
    EWB      Elephants Without Borders
    FAO      Food and Agriculture Organization of the United Nations
    FMD      foot-and-mouth disease
    GDP      gross domestic product
    GIS      geographic information system
    GLM      generalized linear model
    OCT      Okavango Community Trust
    SADC     Southern African Development Community
    UNESCO   United Nations Educational, Scientific and Cultural Organization
    WMA      wildlife management area

4
EXECUTIVE SUMMARY
Illegal hunting is a widespread but poorly understood                   Some 1 500 to 2 000
problem in African savannahs. With financial and
                                                                          illegal hunters currently operate
technical support from the United Nations Food and
                                                                               in and around the delta.
Agriculture Organization’s Technical Cooperation
Programme, the research team investigated illegal
bushmeat hunting around the Okavango Delta, Botswana.
                                                               retaliation for, livestock killings. Some hunters, however,
Data were collected through interviews with hunters,
                                                               acknowledge that they will eat meat from large carnivores
randomly selected heads of households, wildlife experts,
                                                               when it is available.
land concession managers and anti-poaching personnel.
Records of wildlife-related crimes and census data for
                                                               Most illegal hunting occurs in areas adjacent to, but
delta wildlife populations were obtained from all available
                                                               outside of, protected areas. One in five interviewed
sources.
                                                               hunters acknowledged hunting inside protected areas.
                                                               Although a majority of interviewed hunters cited wildlife
The study found that illegal hunting is a widespread
                                                               availability as a major factor in choosing hunting grounds,
practice throughout the Okavango Delta, particularly
                                                               three-fifths cited the risk of capture as an important
in the western region. Three approaches were applied
                                                               consideration. Perceptions of risk vary regionally. Illegal
to estimate the number of hunters. Results suggest that
                                                               hunters in the western delta perceive hunting to be a
1 500 to 2 000 illegal hunters currently operate in and
                                                               high-risk activity more frequently than illegal hunters
around the delta, with a best estimate of 1 775. Hunters’
                                                               from other parts of the delta. Riskiness also depends on
reports indicate that approximately 244 500 to 470 000
                                                               the size of hunted game. While 70 percent of big-game
kilograms of bushmeat are harvested annually. The
                                                               hunters believe their activities are risky, small-game
average hunter harvests illegal bushmeat worth 3 260 to
                                                               hunters are equally likely to perceive hunting as a high-
4 720 BWP (USD326–472) a year.
                                                               or low-risk activity.
Hunters most commonly hunt with firearms. They
                                                               Illegal hunters’ households exhibited greater livestock
frequently reported hunting with dogs or on horseback,
                                                               wealth, lived closer to wildlife and were more likely to be
using a variety of weapons. The use of snares for hunting
                                                               employed than non-hunter households were. Generalized
is relatively uncommon.
                                                               linear models revealed that every kilometre of distance
                                                               between a household and wildlife populations was
Illegal hunters kill small game such as francolins, hares
                                                               associated with an 11 percent decrease in the likelihood
and small carnivores more frequently than large herbivores
                                                               of that household hunting illegally. For every 100 000
(i.e. those weighing more than 25 kg). Among medium
                                                               BWP of livestock wealth (approximately 50 cattle) that
to large herbivores, impala and greater kudu are most
                                                               a household had accumulated, the likelihood of that
affected. These findings contrast with official records,
                                                               household hunting illegally increased 49 percent. Illegal
which suggest that large species such as buffalo and giraffe
                                                               hunters were typically young men of between 20 and 35
account for the largest proportion of offtake.
                                                               years old, who have been hunting for five years or less.
Data on illegal hunting indicate that wildlife managers
                                                               Household surveys revealed that secretive bushmeat
and law enforcement officials do not detect the harvest
                                                               markets exist in some villages. No clear pattern explains
of small species effectively. Even as a proportion of the
                                                               why sales of bushmeat were reported in some villages
total species populations, illegal hunters kill greater
                                                               during the surveys but not others. Models suggest that
kudu, wildebeest and sable antelope more intensively
                                                               the proximity of wildlife to a village may play a role,
than buffalo or giraffe. The findings of this study suggest
                                                               but the results were inconclusive. Alternatively, it is
that the proportion of greater kudu killed illegally each
                                                               possible that some communities were more willing to
year is approximately equivalent to the species’ intrinsic
                                                               acknowledge the bushmeat trade than other villages,
growth rate. Interviewed hunters also reported killing
                                                               and that the trade is more consistent across the study
large carnivores, especially lions. Whereas they reported
                                                               area than surveys suggest.
targeting small carnivores specifically for bushmeat,
they primarily killed large carnivores to pre-empt, or in

                                                                                                                        5
Executive Summary

Although some respondents preferred the taste                    wildlife other than through hunting. Study-area residents
of bushmeat to meat from livestock (18 percent of                typically held negative views towards wildlife, and human-
interviewed heads of households) or said that bushmeat is        wildlife conflict is a likely driver of those attitudes.
more accessible in their village than meat from livestock        Whereas less than half of non-hunters said wildlife is
(16 percent), the decision to hunt or consume bushmeat           important, 96 percent of hunters said it is.
illegally is largely economic. Illegal hunters enjoy access
to a public resource at little to no cost and limited risk and   Illegal bushmeat hunting constitutes a resource rent and is
with no production costs. Even when hunters encounter            a highly inefficient use of wildlife resources. Comparing
law enforcement, they rarely face any penalty and when           the community benefits from illegal hunting to the
they do, the fines imposed are typically less than the           benefits from community-based photographic tourism
value of the harvested bushmeat. Many interviewed                operations in the northern delta demonstrates that this
hunters cited the unaffordability of meat or a need              form of tourism can provide benefits to local communities
to feed their households as their primary reasons for            an order of magnitude greater than bushmeat hunting.
hunting illegally. However, even among these individuals,
livestock wealth was greater than among other members            Furthermore, illegal hunting threatens delta wildlife
of their communities. This pattern suggests that illegal         populations and the lucrative tourism industry dependent
hunters avoid consuming their livestock by consuming             on wildlife. Hunters may kill four percent or more of many
free bushmeat instead. In other words, illegal hunting           species’ populations annually. For greater kudu, ostrich,
is typically a livelihood activity and not a subsistence         sable antelope and wildebeest, the annual harvest is likely
activity; it increases a household’s purchasing power            greater than ten percent of the population, and an even
but is not essential to most households’ self-sufficiency.       greater proportion in the peripheral areas where poaching
                                                                 occurs. More than half of interviewed hunters believe
Some hunters reported earning significant income from            that one or more wildlife species is in decline, though not
the illegal bushmeat trade. Thirty percent of interviewed        necessarily because of hunting. To quantify the effects
hunters reported selling bushmeat and other products             of observed hunting rates on wildlife populations, large
illegally, but these commercial hunters accounted                herbivore biomass offtake was modelled in relation to
for a disproportionate amount of bushmeat offtake.               available populations. The model indicates that when
Three hunters interviewed, classified as “syndicate-             biomass offtake from hunting compounds the offtake from
level” hunters, reported an individual offtake of more           predators, large herbivore populations are susceptible to
than 1 000 kilograms in the previous twelve months,              declines in wildlife management areas outside the delta
approximately five times more than the average bushmeat          core, particularly in the western delta where hunting
hunter. With the exception of the three syndicate-level          pressure is greatest. Illegal hunting removes more large-
hunters, commercial hunters reported earning less than           herbivore biomass from the ecosystem than any predator
40 percent of their household income from selling                except for lions. In addition to potentially causing declines
bushmeat and other wildlife products illegally. On average,      in herbivore populations, illegal hunting also threatens
commercial hunters earned 6 043 BWP (604 USD)                    large carnivores by increasing competition for a limited
from illegal bushmeat sales in the previous year. This           prey base.
income is marginally less than the annual income from
a minimum-wage job in the agricultural sector. While
commercial hunting is significant, hunting is more often a           Hunters may kill    four percent or more
small-scale or infrequent activity for home consumption.                 of many species’ populations annually.
More than one-third of hunters that were interviewed
reported collecting less than 50 kilograms of bushmeat
in the previous twelve months.                                   Human-wildlife conflict, economic and financial benefits
                                                                 from illegal hunting, few direct benefits from legal wildlife
A vast majority of interview respondents, regardless             ventures, ineffective law enforcement and constant
of whether their household hunts, reported suffering             opportunity are major factors underpinning illegal
costs from living with wildlife, usually through the loss        hunting in the Okavango Delta. Illegal hunters suffer
of crops and livestock to wild animals. This conflict            costs from wildlife but rarely derive legal benefits from
drives negative attitudes towards wildlife and instigates        it. They benefit from hunting, but do not suffer costs for
retaliatory killings. Additionally, less than one-quarter        hunting illegally. To limit illegal hunting, these underlying
of respondents believed their community benefits from            dynamics must change.

6
Executive Summary
A holistic approach is necessary to address illegal bushmeat hunting in the Okavango Delta and improve wildlife
management. This report outlines strategies for expanding legal community benefits from wildlife, reforming wildlife
management policies, improving enforcement and raising public awareness about wildlife issues.
Key recommendations include:
1) Educating communities about the value of wildlife, the threat illegal hunting poses to an important public
resource, and the importance of only consuming legal game meat, and not illegal bushmeat.
2) Building tourism camps/lodges in peripheral areas of the delta that host dense wildlife populations and
experience high levels of hunting.
3) Developing legislative frameworks that enable communities to engage in wildlife-based land uses in the
areas neighbouring the delta, so that legal and sustainable game meat supplies can be generated, in addition
to benefits such as income from tourism (and trophy hunting if permitted).
4) Developing a wildlife-guardians programme that pays former hunters to monitor wildlife, prevents livestock
incursions into wildlife areas and reduces human-wildlife conflict.
5) Coordinating a lobbying effort to encourage Parliament to adopt proposed legislation for reforming laws
governing wildlife crimes. Penalties for illegal hunting should foster significant risk.
6) Improving anti-poaching patrols by increasing inter-agency coordination and focusing patrols more
effectively, for example by prioritizing foot patrols of open boundary areas.
7) Expanding private anti-poaching operations in hunting hotspots.
Major factors underpinning illegal hunting in the Okavango Delta are human-wildlife
conflict, economic and financial benefits from illegal hunting, few direct benefits from legal
wildlife ventures, ineffective law enforcement and constant opportunity.
7INTRODUCTION approximately 50 to 60 percent of residents live below
the poverty line (Mbaiwa, 2011).
While numerous studies have examined the scale and
impacts of bushmeat industries in central African forests, A recent aerial survey of wildlife populations indicated
experts are comparatively ill-informed about the hunting that 12 out of 14 populations of large herbivore species
and trade of meat in savannahs (Lindsey et al., 2013). declined in Ngamiland District, in which the delta is
Human hunting of large herbivores has driven declines the major ecological feature (Chase, 2011). Amidst
in large mammals for millennia; it continues to pose the growing concern over the instability of Okavango
greatest threat to large herbivore populations around the wildlife populations, some stakeholders hypothesized
world (Ripple et al., 2015). that unregulated and illegal hunting and consumption
of mammals was a contributing factor to declines in
To understand better the impacts of bushmeat hunting on wildlife (J.W. McNutt, personal communication, June
wildlife in African savannahs, a brainstorming workshop 2014; M.A.P. Ives, personal communication, July 2014).
was organized by Panthera, the Zoological Society Exacerbating the confusion concerning the causes of
of London and the Wildlife Conservation Society in wildlife population declines in the delta, local wildlife
Johannesburg, South Africa in May 2012. The participants managers have access to minimal scientific information
presented available data and came to a consensus on about the bushmeat industry in the area, particularly
steps necessary to address the problem (Lindsey et al., following the recent ban on trophy hunting, which
2013). Later that year, those findings were disseminated dramatically altered the management of large portions
at a second meeting involving the Southern African of the delta ecosystem.
Development Community (SADC) Secretariat and top
officials from SADC state wildlife agencies. Government Recognizing the need for reliable information about
attendees at the second meeting requested more evidence the bushmeat industry and its effects on wildlife
of the impacts of bushmeat hunting to demonstrate the populations, the Botswana Predator Conservation
severity of the issue to their superiors. This study arose Trust and Panthera, two conservation-oriented non-
from that request. governmental organizations, launched a collaborative
research project, with support from the United Nations
Studies have shown that hunting can drive declines in Food and Agriculture Organization (FAO), to study the
wildlife and initiate trophic cascades (Wright et al., 2000; bushmeat industry in the delta. For the purposes of this
Sinclair et al., 2010; Galetti and Dirzo, 2013; Ripple et al., report, bushmeat hunting is defined as the illegal killing
2015). In Botswana, one threat that concerns policy- of terrestrial animals for consumption or sale of the meat
makers and wildlife managers is the possibility that from harvested animals. Since the Botswana government
hunting could undermine the tourism industry. Tourism instituted a ban on trophy hunting on public land in
drives growth in the service industry and bolsters job 2014, with the exception of licences for hunting game
creation. In 2014, the nationwide total contribution of birds, all hunting on public land in Botswana is illegal.
tourism to Botswana’s economy was 15.8 billion BWP The bushmeat trade is defined as the exchange of meat
(1.58 billion USD) or 8.5 percent of GDP, and 10.1 percent from illegally killed animals for financial or material gain.
of employment. Its contribution to GDP is expected to
rise by more than five percent per year over the next The research project was designed to identify the drivers
decade (World Travel and Tourism Council, 2015). and assess the impacts of the trade, and to suggest the
solutions most likely to be effective in addressing the
The Okavango Delta, an inland freshwater delta, savannah issue. This report describes the research activities and
and mopane-woodland ecosystem in northern Botswana summarizes the findings. Within the context of broader
(McNutt, 1996), is central to the country’s tourism wildlife management and socio-economic patterns in the
industry. It hosts large wildlife populations and has Okavango Delta, it describes a holistic strategy intended
more accommodation and tourism facilities than any to address the negative impacts of bushmeat hunting and
other district in Botswana. Community-based tourism improve wildlife management. The report also provides
is a major source of employment in rural villages around recommendations for engaging local communities in the
the delta. The economic contribution of tourism is sustainable use of wildlife resources.
particularly important in the greater delta region where
8METHODS (911 Anti-poaching Operations Centre, unpublished data).
Interviews with western-delta hunters were supplemented
Study area with opportunistic interviews with hunters in the northern
and southern portions of the delta.
The study area encompassed the Okavango Delta and the
surrounding communities. The ecosystem encompasses WMAs adjacent to the focal study villages in the western
a mosaic of permanently dry savannah and Mopane delta encompass a variety of habitat types – from
woodland, seasonally flooded plains and permanent permanent swamp to permanently dry woodland and
swamp (McNutt, 1996). In 2014, UNESCO designated bushland. They also exhibit a variety of management
20 236 km2 of the Okavango as a world heritage site scenarios, ranging from minimal management with no
(UNESCO, 2014). The Moremi Game Reserve (MGR), permanent tourism presence and rare anti-poaching
a 4 610 km2 protected area, forms the core of the delta patrols (NG 24) to areas with constant tourism activities
(Mbaiwa, 2005). Surrounding the game reserve are and intensive private anti-poaching operations (NG 26).
wildlife management areas (WMAs), land concessions The Botswana government, intending to control the
that the government leases to private entities or to spread of foot-and-mouth disease (FMD), erected fences
community-based trusts under a policy framework to between villages and WMAs in order to separate wildlife
give communities stakes in tourism ventures. Although and livestock. However, large portions of the fences are
several small human settlements are located inside WMAs, in disrepair.
the vast majority of land is designated for wildlife-based
uses only; most livestock are prohibited inside WMAs. Interviews
Adjacent to WMAs are mixed-use concessions (hereafter
designated “residential areas”) that include residential This research project proceeded under the auspices
communities, small-scale crop and livestock farming, of research permit EWT 8/36/4 xxvii (25) from the
and some ecotourism enterprises. Botswana Ministry of Environment, Wildlife, and
Tourism. Structured and semi-structured interviews
Study sites consisted of twelve study villages in residential were the primary means of data collection (Appendices
concessions (Figure 1) and their surrounding cattle A-E). Between August 2014 and March 2015, project staff
posts.3 All study villages were located within 35 km of conducted interviews with diverse stakeholder groups to
WMAs in the delta. Villages in the study area for which provide a comprehensive understanding of the hunting
population data were available were qualitatively evaluated and trade of bushmeat (Table 1). Additionally, the project
to determine which villages best capture geographic staff attempted to identify and interview bushmeat
and other types of variation in the study area, while traders – individuals who buy and sell bushmeat – but
also maximizing the amount of information that could they were unable to identify any individuals meeting the
be collected about bushmeat hunting in the limited criteria. All interviews were conducted between August
timeframe of the study. Just over half of the villages 2014 and March 2015.
meeting the criteria were included in the study.
Interview questionnaires for heads of households,
Study villages are ethnically varied. Some study villages are bushmeat hunters, concession managers and anti-
part of community-based natural resource management poaching personnel were adapted from Lindsey et
projects and other villages are not. Study village economies al., 2011 (a–b) to address local conditions. Research
range from being almost entirely pastoral to depending assistants conducted household and hunter interviews in
predominantly on crop farming. Setswana, Herero, Mbanderu, Hambukushu and Seyei,
depending on the language preference of the respondent.
Owing to the challenges of convincing people to M. Rogan conducted interviews with wildlife experts and
acknowledge and discuss illegal activities, efforts to stakeholders, concession managers and anti-poaching
identify and interview active hunters were concentrated personnel in English, in which all respondents were
in six villages in the western delta based on reports that fluent. The project granted anonymity to all research
bushmeat hunting was especially prevalent in that area participants.
3 Cattle posts are single households or clusters of households located outside the village proper for the purposes of managing free-
ranging herds of livestock and accessing remote crop fields.
9METHODS
Research assistants were hired based on their familiarity
with communities in the study area and knowledge of
hunting activities. The research assistants spent time
networking in study villages to identify hunters and
build trust with community members. In villages where
research assistants had few personal ties, the research
team worked with community liaison officers and village
headmen to help research assistants contact illegal
hunters. They also identified hunters at households that
acknowledged sourcing bushmeat themselves during
household interviews. The research team attempted to
interview every hunter it identified.
Research staff sampled village households based on
randomly distributed points within each village. Polygons
were manually drawn around each village using satellite
imagery (Google Earth, 2014); and constructed sets of
randomly distributed points within the village polygons
using ArcGIS 10.2 (ESRI 2014). At least 75 metres
separated each point. Research assistants travelled to
each point and interviewed the head of the nearest
household. Because this sampling approach excluded
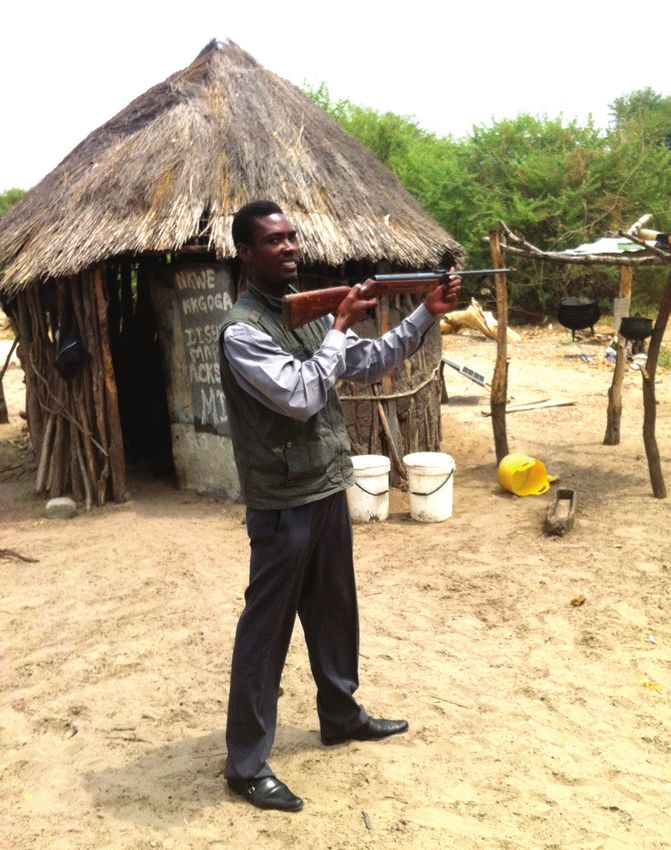
households situated outside the village proper (as defined Gumare community liaison officer Colin Sarefo posing
by manually drawn polygons), additional interviews were with an interviewed hunter’s rifle
conducted with heads of households based at cattle posts.
The non-random cattle post component was critical to capturing the variation within delta communities. In each
village, researchers conducted 30 to 56 interviews, with a minimum of 30 randomly sampled households.
Table 1: Bushmeat project surveys and researchers
Interview Type Sample Method Quantity Interviewers
E. Tjihumino, I.P. Seboifeng,
Bushmeat hunters Non-random 91
K. Madise, M. Rogan
K. Madise, E. Tjihumino,
Heads of village households Random & non-random 433
I.P. Seboifeng, K. Samxhose
Wildlife experts and stakeholders Non-random 58 M. Rogan
Concession managers Non-random 17 M. Rogan
Anti-poaching personnel Non-random 17 M. Rogan
Past research has demonstrated that self-reporting of bushmeat hunting tends to underestimate hunting intensity
because hunters under-report their offtake (Knapp et al., 2010). Where suitable data are available, records from anti-
poaching patrols are a better indicator of hunting intensity than self-reporting is. After evaluating anti-poaching
records, however, it was concluded that the sampling effort of patrols varied too greatly across the study area and that
records were insufficient to form the basis for estimating hunting levels in the delta. Instead, hunters’ self-reporting and
household consumption estimates were relied upon, with the known caveat that these methods provide conservative
estimates of actual hunting intensity and offtake.
10METHODS
Figure 1. Map of the Okavango Delta and study villages. In focal villages (blue), research assistants worked intensively
to identify and interview illegal bushmeat hunters. In non-focal villages (purple), research assistants interviewed hunters
opportunistically.
11METHODS Wildlife experts and stakeholders were defined as anyone National Parks (DWNP) subregional Wildlife Officers, who demonstrated detailed knowledge of wildlife, wildlife- were also responsible for managing residential concessions based land uses (e.g. photographic tourism), hunting, law adjacent to the Okavango Delta WMAs. All concession enforcement, or ecosystem management. As many wildlife managers also participated in the wildlife expert and experts and stakeholders as possible were interviewed stakeholder survey. The latter survey asked respondents within the timeframe of the study. Although the sample about wildlife and hunting trends across the entire study was not exhaustive, expert/stakeholder interviews area, whereas questions in the concession manager survey continued beyond response saturation, suggesting the were specific to each manager’s jurisdiction. sample was sufficiently representative (Guest et al., 2006). Concession managers were defined as any individuals Anti-poaching personnel were defined as individuals who tasked with managing a concession lease (e.g. managers conduct anti-poaching patrols, or individuals responsible of community trusts), managing tourism activities on for arresting or detaining suspected hunters on behalf a concession, managing law enforcement operations of governmental or private agencies. Because all anti- (governmental and private), or implementing poaching personnel operate in teams, no more than environmental management plans for specific concessions two individuals from a single team were interviewed. in the Okavango Delta. Because some concession Interviews were conducted with representatives of every managers are responsible for more than one concession agency that gave permission for the research team to in the Okavango Delta, the sample included at least one interview their team members. The research team did manager for the 18 concessions in the Okavango Delta not receive permission to conduct interviews with some designated for wildlife-based land uses (i.e. WMAs and important agencies, such as the Botswana Defence Force game reserves in the delta). Some concession managers (BDF). interviewed, particularly Department of Wildlife and Figure 2. Hunter interviews by village/cattle post 12
METHODS

Records of hunting incidents                                       discussed where appropriate in this report, but they were
                                                                   not incorporated into any systematic analyses.
Available records of species-specific hunting incidents
were collected for the years 2009–2014 from governmental           Aerial survey data
authorities, non-governmental monitoring organizations
and private anti-poaching units. Sources of records                Elephants Without Borders (EWB) provided aerial
of hunting incidents include Ngamiland Magistrate                  transect routes and GIS coordinates of large mammal
Courts, the Botswana Police Service, DWNP, Bushcraft               observations in the Okavango Delta and surrounding
APU4, and the 911 Anti-poaching Operations Centre.5                wildlife management concessions from a 2014 dry-season
The latter two organizations also provided GPS coordinates         aerial survey (Chase, in preparation). A description of
of some hunting incidents; however, these data were too            EWB survey protocols is available from Chase, 2011.
few and too spatially biased to allow for meaningful
analysis.                                                          Carnivore data

Focus groups                                                       The Botswana Predator Conservation Trust (BPCT)
                                                                   provided estimates of the densities of lions, spotted
Three focus groups were held with a total of 26 current            hyaenas, leopards, cheetahs and wild dogs from radio
and former hunters from four villages in the western               telemetry data of average home range size and audio-
delta. E. Tjihumino facilitated the focus groups, I.P.             visual sampling methods (Golabek et al., in preparation;
Seboifeng translated from Setswana to English and M.               Cozzi et al., 2013). BPCT and Okavango Wilderness
Rogan recorded responses. Audio recordings of the                  Safaris provided opportunistic data on the large carnivore
focus group discussions were not collected on account              guild’s prey selection (Golabek et al., in preparation;
of the illicit nature of the hunting activities discussed          K. Collins, unpublished data).
during focus groups. As a result, hunters’ responses are

Focus group with bushmeat hunters (faces were darkened to protect anonymity)

4	A private anti-poaching operator.
5	A community-run neighbourhood watch organization that gathers information about illegal hunting and notifies law enforcement
  authorities.

                                                                                                                                 13
METHODS
Human population data
Village-specific results of the 2011 national census were
obtained from Wilderness Safaris (K. Collins, unpublished The results provide a clear
data).
indication that poaching strongly
Analyses relates to households of rural farmers
that are financially stable.
Statistical analyses were performed using R i386 3.1.2
(R Core Development Team, 2014). Spatial analyses were
performed using ArcGIS 10.2 (ESRI, 2014).
Estimating the number of hunters
Three methods were applied to estimate the number of illegal hunters in communities around the Okavango
Delta:
1) The first method used random sampling from the household survey. This sampling provided estimates of
the proportion of houses that hunt, with 95 percent confidence intervals based on asymptotic approximation
of a binomial distribution. Recognizing that hunting dynamics vary between very small rural villages and
larger population centres, separate hunting rates were estimated for small villages with fewer than 2 000
residents and larger villages with more than 2 000 residents. The random sample captures hunting activity
within households, not among individual hunters. Based on information from hunters about hunting
partners and the transfer of hunting skills and weapons within family, hunting households were assumed
to hold an average of 1.5 hunters. The population of Maun was excluded from the population estimates
because no reliable data on hunting rates among Maun residents were available, and because anecdotal
evidence suggests that Maun hunters typically access bushmeat through their households’ rural cattle posts.
Non-local hunters were also excluded from the estimate because interviewed hunters reported only rare
encounters with non-local hunters hunting bushmeat. Their contribution was deemed insignificant.
2) Because of concerns that randomly sampled households might under-report illegal activities in interviews
(Knapp et al., 2010), the random-sample estimate was revised. In addition to the random sample, the revised
estimate incorporated interviewed hunters’ estimates regarding the number of other hunters they know
in their villages, hunting rates at cattle posts excluded from the random sample, and hunters’ estimates of
the proportion of households involved in hunting as discussed in the focus groups. In the case of villages
where no additional information was available, the proportion from the random sample was retained.
3) The third method of estimating the number of hunters in the Okavango Delta was based on records of local
residents convicted of wildlife crimes. Ngamiland court records identify 67 convictions for wildlife-related
crimes between 2009 and 2014. Among the 91 interviewed hunters, two acknowledged being convicted of
illegal activities relating to hunting. By identifying a maximum potential conviction rate for illegal hunters
over the five-year period, it was possible to determine the minimum number of hunters necessary to result
in 67 convictions. Using the pool of interviewed hunters, a bootstrapping simulation was performed by
sampling with replacement over 10 000 replications. The minimum number of hunters necessary to produce
67 wildlife crime convictions was identified based on the 95th percentile conviction rate in the bootstrap
simulation.
14METHODS
Socio-economic characteristics of bushmeat Estimating bushmeat offtake
hunters and consumers
Interviewed hunters reported the number of each species
Characteristics of hunter households were compared that they killed in the previous 12 months. To measure
with those of non-hunter households, and households the amount of meat produced, average dressed weight
that acknowledged eating bushmeat to households that estimates (Bothma, 2002) were incorporated into the
said they never eat bushmeat, using generalized linear calculations. The total amount of bushmeat that each
models (GLMs) with a binomial distribution and a hunter reported harvesting was divided by the number of
logit function (McCullagh and Nelder, 1989). Predictor people in his typical hunting party, in order to determine
variables were selected for inclusion in GLMs through his individual share of the bushmeat offtake. Due to a
a thorough exploratory data analysis using Spearman’s skewed distribution of individual offtake, the true mean
rank correlations, analysis of variance (ANOVA), and was estimated by bootstrapping. A 95 percent confidence
comparisons of means and standard deviations to examine interval for the true mean was defined as the interval from
relationships between predictor and response variables. the 2.5th and 97.5th percentile outcomes. As hunters are
prone to “substantial under-reporting” of their offtake,
Saturated GLM models were constructed with all selected this estimate is highly conservative (Knapp et al., 2010).
variables. Dredging (R package “MuMIn” v. 1.15.1; Bartoń,
2015) was performed to identify models that provided Commercial bushmeat hunters most commonly reported
the greatest insight into factors relating to illegal hunting. selling bushmeat for 20 BWP (2.00 USD) per kilogram,
Pairwise models were compared using AICc, relative although some commercial hunters reported selling at
operating characteristic (ROC; R package “ROCR” v. higher prices. The cost of meat from livestock was tracked
1.0-7; Sing et al., 2015) and analysis of variance with and 20 BWP per kilogram represented the replacement
a Chi-squared test. Jackknifing of variable importance cost of substituting an illegal kilogram of bushmeat with
was also performed: for each predictor variable, a GLM a legal kilogram of ration beef. For the purposes of this
with only that variable and a GLM excluding only that report, a value of 20 BWP per kilogram was adopted as
variable were tested. This jackknifing process measures a consistent, conservative estimate of bushmeat value.
the individual explanatory power of each variable and
its unique information – how much explanatory power Estimating herbivore biomass offtake
is lost when that variable is absent from the model.
Explanatory power is defined as one minus the ratio The total offtake of large-herbivore biomass from hunting
of deviance in the fitted model to deviance in the null was estimated and incorporated into a model examining
model. Where appropriate, Kolmogorov-Smirnov tests the effects of hunting on population dynamics of medium
and bootstrapping were used to compare means between to large herbivores (Lindsey et al., 2014). The approximate
sub-samples of the interview pool. All bootstrapping was number of large herbivores that illegal hunters kill each
performed by sampling with replacement 10 000 times. year was calculated from hunters’ average reported offtake
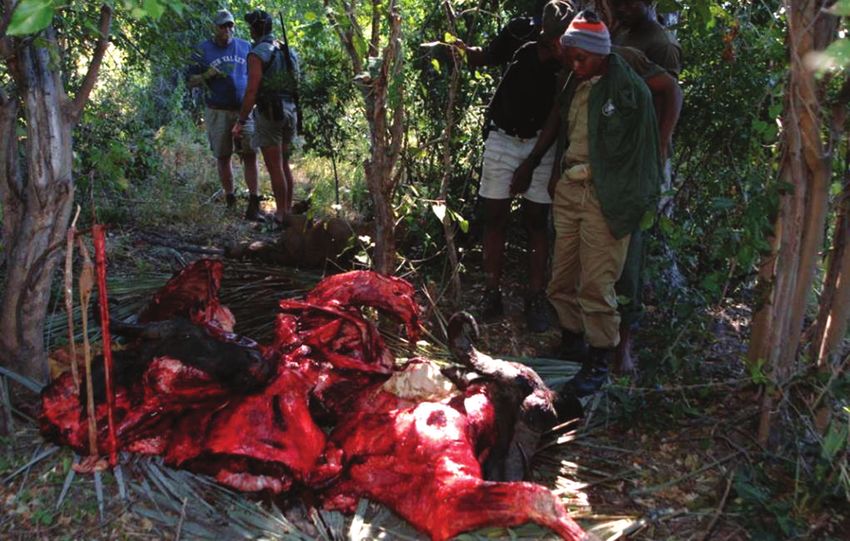
of each species. Field reports of non-butchered carcasses
Data from all study villages were aggregated into unified exhibiting gunshot wounds suggest that in addition to
samples for three reasons: 1) the Botswana government animals that hunters kill outright, some wounded animals
manages poaching at the district level; 2) court records also die from hunting (Bushcraft APU, unpublished data).
indicate that poaching parties often include participants One-half of animals that hunters reported wounding
from multiple villages; and 3) cattle posts may be were assumed to die prematurely from their wounds.
extensions of more than one village and may belong to This additional offtake from wounding was included in
families that keep a primary residence in a different village. the estimate of total offtake from hunting.
Commercial bushmeat hunters most commonly reported selling bushmeat
for 20 BWP (2.00 USD) per kilogram, although some commercial hunters
reported selling at higher prices.
15METHODS
The study area was divided into four subregions: western among the large carnivore guild, intrinsic herbivore
delta, southern delta, northern delta and the delta core growth rates derived from a species body mass index
(Figure 3). The biomass offtake of each region was based (Bothma, 2002) and depredation by the large carnivore
on the revised estimate of the number of hunters (1 775) guild (Golabek et al., in preparation; K. Collins,
distributed proportionally across the western, northern unpublished data). Rather than apportion carnivore
and southern regions. The model assumes that hunting consumption to specific species, the model aggregates
within the delta core is insignificant. Total hunting offtake carnivore consumption and assumes that herbivore
was calculated as the product of the number of hunters species maintain a constant relative abundance regardless
in each region, the average number of each species killed of changes in herbivore biomass. Herbivore population
by each hunter and the species’ average body mass (Coe dynamics were modelled with and without hunting in
et al., 1976). the western delta, the delta core and the three outer
regions collectively.
The resulting estimates of biomass offtake from hunting
were integrated with estimates of biomass consumption
NORTHERN
DELTA
DELTA CORE
WESTERN
DELTA
SOUTHERN
DELTA
Figure 3. Okavango Delta subregions for analysing the effects of bushmeat hunting on large herbivore population
dynamics. Transect routes determine region boundaries as some transects cover more than one WMA.
16RESULTS
Number of hunters
Random sampling produced an estimate of between 548 conviction rate was too low to produce a meaningful
and 1 839 bushmeat hunters around the Okavango Delta maximum estimate of bushmeat hunters using this
(Figure 4).6 In small villages, 13.7 percent of households bootstrapping method (i.e. the maximum estimate goes
(n=248) acknowledged hunting. In large villages, 7.6 to infinity).
percent of households (n=119) did. Bootstrapped
simulations of wildlife crime convictions resulted in a The revised estimate from random sampling produced an
95th percentile conviction rate of 4.4 percent. To produce estimate of 1 775 bushmeat hunters around the Okavango
67 convictions with a 4.4 percent conviction rate, there Delta. Because the revised estimate incorporates all
would need to be a minimum of 1 523 illegal hunters in available information and is consistent with the results
villages adjacent to the delta. The median bootstrapped of the other two approaches, it was selected as the best
conviction rate, 2.2 percent, produced an estimate of estimate and applied to all subsequent calculations.
3 045 total hunters. The estimate of the minimum
Conviction rates estimate 3 045
Random sample maximum 1 839
Revised sampling estimate 1 775
Conviction rate minimum 1 523
Random sample estimate 1 198
Random sample minimum 548
Figure 4. Estimates of bushmeat hunters in the Okavango Delta based on three methods. Researchers selected the
revised estimate, which combines random sampling estimates with additional information that hunters provided in
interviews and focus groups, as the representative estimate.
Socio-economic characteristics of hunting and distance from home to wildlife, whether the household
bushmeat consumption farmed crops, livestock wealth, the number of meals
skipped in the previous year owing to poverty, and the
Exploratory data analysis investigated 16 potential harvest value. Although a model that included home
predictor variables potentially relating to whether a village and distance to wildlife performed best in terms of
household consumes bushmeat, and 15 predictor variables AICc, area under the ROC curve, and explanatory power,
potentially relating to whether a household hunts illegally. a model that included home village as the only predictor
Respondents’ home village was excluded from the latter variable was the most parsimonious (Burnham et al.,
analysis because of unequal sampling effort in the various 2011). Differences between the model were insignificant
study villages. (ANOVA, p=0.075). Furthermore, home village and
distance from households to wildlife were not independent
Seven predictor variables were selected for inclusion variables (ANOVA, F=17.72, df=11, pRESULTS
most appropriate. A large portion of respondents in The results of the generalized linear model suggest that
four out of 12 study villages acknowledged consuming the tendency among households to hunt relates strongly
bushmeat, suggesting that these four villages have active – to having above-average livestock wealth, living close to
but secretive – bushmeat black markets. The relationship wildlife, farming crops and having formal employment.
between village and distance to wildlife populations is No ethnic group exhibited a proclivity for hunting.
one possible explanation for why bushmeat consumption However, some ethnic groups, namely those not prevalent
is more common in some communities than in others. in Ngamiland (Ethnicity 0), exhibited a tendency not to
It is by no means conclusive. hunt. In other words, people who do not originally come
from Ngamiland are somewhat less likely to hunt than are
It was noted that many household interviews contained residents from ethnic groups from the district. Hunter
inconsistencies (e.g. respondents saying they have never households exhibited a median livestock wealth more
eaten bushmeat but specifying a preference for certain than four times greater than non-hunter households did
types of bushmeat). These inconsistencies, coupled with (Kolmogorov-Smirnov test, pRESULTS
from hunters and focus-group discussions, some of Greater income from livestock explains the difference
the other factors that may account for the unexplained entirely. In fact, hunter households on average earn
variation include whether a family has a tradition of slightly less from formal employment (despite being
hunting; whether households have access to guns, horses, better employed overall, hunter households seem to
or trained hunting dogs; and psychological factors such not have the highest-paying jobs, mainly government
as individuals’ aversion to risk. positions) and crop farming, but income from livestock
more than makes up the difference for most hunter
Jack-knifing of variable importance revealed that livestock households (Figure 6).
wealth is the factor that most strongly relates to whether
or not a household is involved in hunting (Figure 5). Average income from hunting, through bushmeat
Livestock wealth had the greatest explanatory power consumption and sales, accounted for approximately
of any predictor variable and captured the most unique one-sixth of the average hunter’s household income.
information. Distance to wildlife contains as much This measure skews heavily toward a few hunters who
unique information as livestock wealth, and ethnicity account for a disproportionately high amount of the
has as much explanatory power as livestock. Farming bushmeat production (see below).
crops, employment level and household income were
comparatively less important variables. It is somewhat Only 10 percent of hunters identified bushmeat as their
surprising that hunting correlated positively with most important source of protein; 50 percent listed it
employment level, but not income. A household’s level among their three most important protein sources. When
of employment was classified as being regularly employed, asked why they hunt, 36 percent of hunters described
intermittently employed (e.g. piece-jobs, small-scale themselves as unable to afford to buy meat or in need of
craft making, temporary government work schemes), bushmeat to have sufficient food (Figure 7). However,
or unemployed. Hunter households exhibited higher those households also exhibited high livestock wealth
rates of both regular and intermittent employment than consistent with hunter households in general (KS test,
non-hunter households. p=0.61). Other commonly cited reasons for hunting
included a desire for free meat, additional income and
A close look at household income among hunting and a preference for the taste of bushmeat. These results
non-hunting households illustrates the full importance indicate that bushmeat is not essential to most households’
of livestock wealth. Median income among hunter food security.
households is higher than among non-hunter households.
Saturated Model 0,177
Livestock Wealth
Distance to Wildlife Only
Excluding
Crop Farming
Saturated
Ethnicity
Income
Employment
0 0,05 0,1 0,15 0,2
Explanatory Power
Figure 5. Spatial jackknifing of variable importance for GLM predicting whether a household participates in hunting.
It illustrates the explanatory power of GLMs with each variable as the only predictor variable in a model and each
variable as the only excluded predictor variable in the model.
19RESULTS
25 000
16.5%
20 000 Bushmeat sales
Bushmeat: home consumption
Other
15 000 Government assistance
BWP
Livestock sales
Crop harvest
10 000
Employment income
5 000
0
Non-poacher household Poacher household
average average
Figure 6. Average income from seven sources among hunter and non-hunter households.
Commercial bushmeat
Thirty percent (n=91) of interviewed hunters acknowledged selling bushmeat. On average, these commercial hunters
earned 6 043 BWP (604 USD) from bushmeat sales in the previous 12 months. As a point of comparison, the minimum
wage for workers in Botswana’s agricultural sector is 550 BWP per month, or 6 500 BWP per year (MLHA, 2014).
For three-quarters of the commercial hunters, income from selling bushmeat accounted for less than 40 percent of
total household income (Figure 8). The few who relied on bushmeat for a greater share of household income are
considered to engage in ‘syndicate-level’ hunting (see below).
For home consumption
Can’t afford to buy meat
Income
Free meat
Preferred taste
Bushmeat is more available than legal meat
To have sufficient food
Other
0% 10% 20% 30% 40%
% of hunters citing
Figure 7. Percentage of bushmeat hunters citing seven respondent-generated reasons for hunting.
20RESULTS
0.7
Proportion of household income
0.6
0.5
0.4
0.3
0.2
0.1
0
Figure 8. Proportion of household income from selling bushmeat among 27 commercial bushmeat hunters.
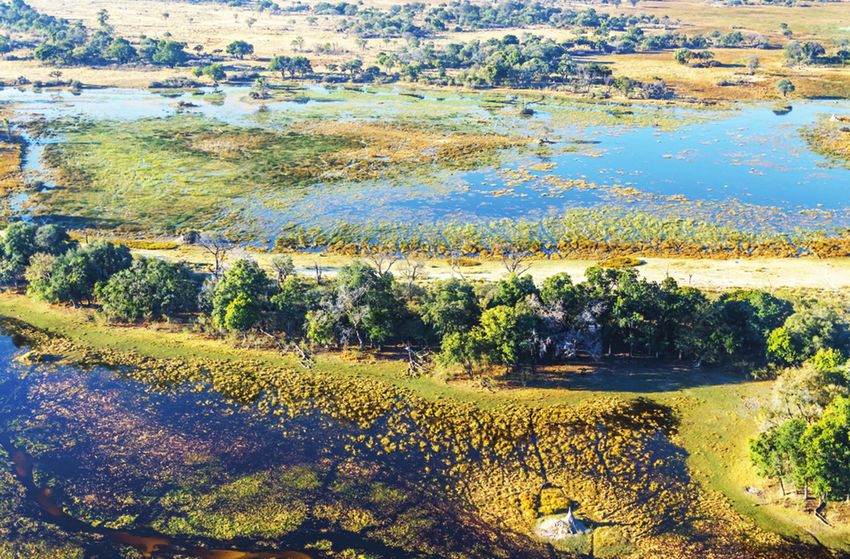
Estimated bushmeat offtake
Hunter surveys revealed that, on average, individual hunters harvested 163 to 235 kilograms of bushmeat (i.e. dressed
weight) in the 12 months prior to being interviewed. At a rate of 20 BWP per kilogram, hunters harvested bushmeat
worth, on average, between 3 260 BWP and 4 720 BWP (326 – 472 USD) per year.
As previously mentioned, hunters’ individual offtake was not distributed normally. Also, it varied widely. An a posteriori
classification was applied based on an evaluation of the histogram of hunters’ reported individual offtake (Figure 9).
More than half of the hunters (n=90)7 reported an individual offtake of less than 100 kg in the previous year. Most
of these hunters only harvested small game such as game birds, hares and springhares. Others may have killed larger
game such as impala, but infrequently. At the other end of the spectrum are three hunters who acknowledged that
their individual share of harvested bushmeat amounted to more than 1 000 kilograms in the previous 12 months.
This level of hunting suggests a systematic, intense effort that necessitates large hunting parties in order to transport
and distribute the meat of large target species such as buffalo and giraffe. This level of offtake is therefore classified
as a ‘syndicate.’ It is impossible to know whether these syndicates exhibit the same level of sophistication as those
involved in hunting high-value wildlife products in Africa (Hauck and Sweijd, 1999).
35
Infrequent, small game hunters
30
Infrequent big game hunters and frequent
small game hunters
25
Poachers (n=90)
Frequent big game hunters and minor
20 commercial hunters
15 Syndicate-level hunters
10
5
0
0 200 400 600 800 1 000 1 200 1 400
Bushmeat (kg)
Figure 9. Histogram of the cumulative dressed weight of all animals that each interviewed hunter reported killing in the
previous 12 months, divided by the number of people in that hunter’s typical hunting party.
7 One hunter’s reported offtake was excluded from the analysis because he reported his harvest over the previous five years, rather than
the previous twelve months.
21You can also read