Ohinemuri catchment - river and streams ecosystem services assessment - Waikato Regional Council Technical Report 2019/25
←
→
Page content transcription
If your browser does not render page correctly, please read the page content below
Waikato Regional Council Technical Report 2019/25

Ohinemuri catchment – river and
streams ecosystem services
assessment

www.waikatoregion.govt.nz
ISSN 2230-4355 (Print)
ISSN 2230-4363 (Online)
Prepared by: Brenda R. Baillie, Richard T. Yao, David J. Palmer (SCION (New Zealand Forest
Research Institute Ltd.))

For:
Waikato Regional Council
Private Bag 3038
Waikato Mail Centre
HAMILTON 3240

January 2020

Document #: 14746420
Peer reviewed by:
 Femi Olubode-Awosola                                   Date         31 July 2019

 Approved for release by:
 Ruth Buckingham                                        Date         1 August 2019

Disclaimer
This technical report has been prepared for the use of Waikato Regional Council as a reference document
and as such does not constitute Council’s policy.

Council requests that if excerpts or inferences are drawn from this document for further use by individuals
or organisations, due care should be taken to ensure that the appropriate context has been preserved,
and is accurately reflected and referenced in any subsequent spoken or written communication.

While Waikato Regional Council has exercised all reasonable skill and care in controlling the contents of
this report, Council accepts no liability in contract, tort or otherwise, for any loss, damage, injury or
expense (whether direct, indirect or consequential) arising out of the provision of this information or its
use by you or any other party.

Doc # 14746420
Doc # 14746420
Ohinemuri catchment – river and streams
ecosystem services assessment
Brenda R. Baillie, Richard T. Yao and David J. Palmer
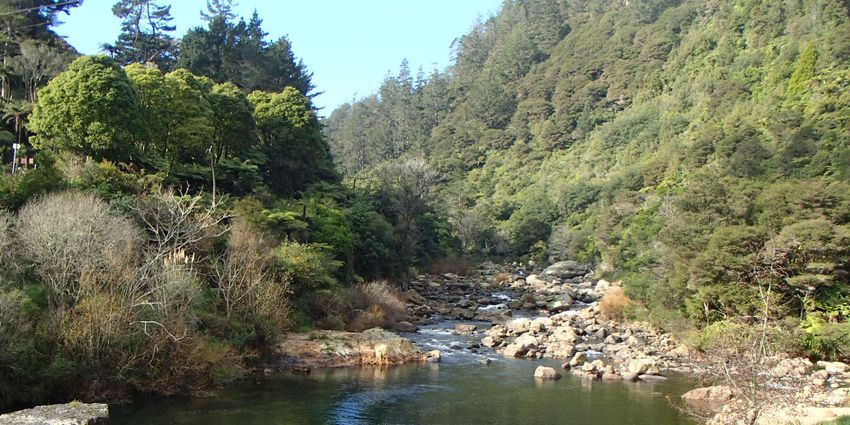
Karangahake Gorge
1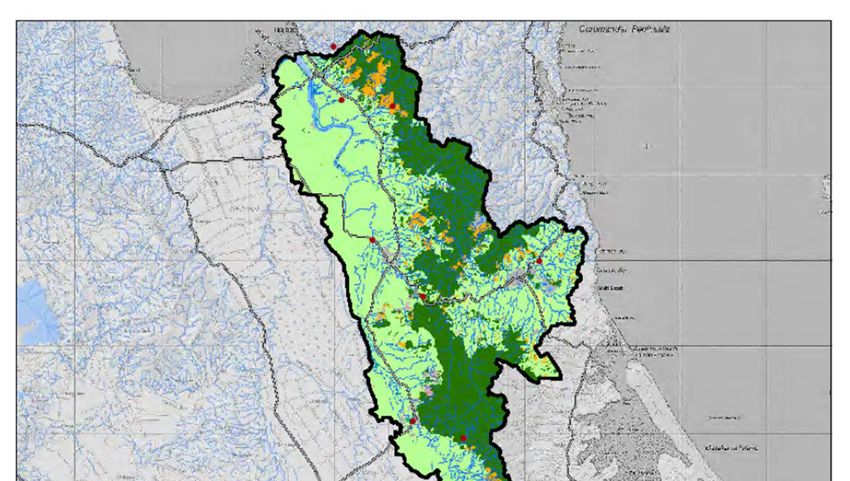
Report information sheet
 REPORT TITLE            OHINEMURI CATCHMENT – RIVER AND STREAMS ECOSYSTEM SERVICES ASSESSMENT

 AUTHORS                 BRENDA R. BAILLIE, RICHARD T. YAO, DAVID J. PALMER
                         SCION (NEW ZEALAND FOREST RESEARCH INSTITUTE LTD.), ROTORUA, NEW
                         ZEALAND
 CLIENT                  W AIKATO REGIONAL COUNCIL

 CLIENT CONTRACT         SAS2018/2019-2282
 NUMBER

 MBIE CONTRACT
 NUMBER

 SIDNEY OUTPUT
 NUMBER

 ISBN NUMBER

 SIGNED OFF BY           PETER CLINTON

 DATE                    JUNE 2019

 CONFIDENTIALITY         CONFIDENTIAL (FOR CLIENT USE ONLY)
 REQUIREMENT

 INTELLECTUAL            © NEW ZEALAND FOREST RESEARCH INSTITUTE LIMITED. ALL RIGHTS RESERVED.
 PROPERTY                UNLESS PERMITTED BY CONTRACT OR LAW, NO PART OF THIS WORK MAY BE
                         REPRODUCED, STORED OR COPIED IN ANY FORM OR BY ANY MEANS WITHOUT THE
                         EXPRESS PERMISSION OF THE NEW ZEALAND FOREST RESEARCH INSTITUTE LIMITED
                         (TRADING AS SCION).

 Disclaimer              The information and opinions provided in the Report have been prepared for
                         the Client and its specified purposes. Accordingly, any person other than the
                         Client uses the information and opinions in this report entirely at its own risk.
                         The Report has been provided in good faith and on the basis that reasonable
                         endeavours have been made to be accurate and not misleading and to
                         exercise reasonable care, skill and judgment in providing such information and
                         opinions.

                         Neither Scion, nor any of its employees, officers, contractors, agents or other
                         persons acting on its behalf or under its control accepts any responsibility or
                         liability in respect of any information or opinions provided in this Report.

PUBLISHED BY: SCION, 49 SALA STREET, PRIVATE BAG 3020, ROTORUA 3046, NEW ZEALAND. WWW .SCIONRESEARCH.COM

                                                     ii
Executive summary
Introduction
The Waikato Regional Council (WRC) is currently undertaking an assessment of ecosystem services
(ES) of the freshwater resources in the Waikato Region. This project contributes to the WRC Regional
Policy Statement to ensure that the range of ES associated with natural resources are recognised and
maintained or enhanced to enable their ongoing contributions to the region’s wellbeing. The first two
phases of this project involved a desktop assessment of selected freshwater resources (rivers, streams,
lakes and wetlands, including terrestrial geothermal areas) in the Waikato and Waihou River systems to
identify, quantify and value (where possible) the freshwater ES. This information is contributing to the
development of an on-line interactive map of freshwater ES in the region. This map provides a visual
representation of the broader values of freshwater ecosystems, providing an informative and educational
service to the general public and supporting policy discussions and planning for on-going improvements
in the management of freshwater resources. This is a strategic contribution to the WRC’s mission of “a
healthy environment, a strong economy and vibrant communities.”

This project
The objective of this study (Phase 3) was to undertake an in-depth freshwater ES assessment of the
rivers and streams within the Ohinemuri catchment, a tributary of the Waihou River. This involved a
desktop assessment of the entire catchment, contact with relevant agencies and personnel to collate
further information and data, and modelling of sediment, nutrient and water yield regulating services.
Fifty-seven freshwater ES were assessed in the catchment; 22 provisioning ES classes, 21 regulating ES
classes and 14 cultural ES classes.

Key results
Provisioning Services
The main provisioning service provided by the Ohinemuri River system was water supply for municipal,
industrial (particularly mining) and agricultural use. The readily available, good quality water supply is an
important contributor to the catchment’s economy and the total direct use values for drinking water and
non-drinking water, based on current surface water resource consents, were estimated at $3 million and
$8,752 per year, respectively. Given that the available water consent data set is patchy, those
approximations should be treated with caution. While there are costs associated with water treatment,
including additional costs to treat the odour and taste from the Ohinemuri River at certain times of the
year, we were unable to place an indicative economic value on this. Water yield modelling shows that the
annual volume of water supply far exceeds the annual volume of water consumed (a better measure of
demand) by the different land uses in Ohinemuri catchment with water consumption higher in dairy and
livestock farms compared with forest areas. The Ohinemuri River system provides a range of freshwater
food sources including eel (longfin and shortfin), trout and whitebait. The commercial eel fishery in the
Ohinemuri catchment had an estimated annual total direct use value of $791,500.

Regulating Services
Flow regulation is an important ES provided by the Ohinemuri River, underpinning many of the other
Provisioning, Regulating and Cultural ES in the catchment. The high rainfall across most of the
catchment, along with land cover were key factors influencing the results from water yield modelling.
These results suggest very high water yields across the catchment ranging from above 1,000 m3/ha/year
to greater than 3,000 m3/ha/year. The catchment has a dynamic surface water dominated hydrological
regime characterised by relatively low base flows and a high frequency of flood events. As a result, there
are limits to the natural flood regulation ES that the river provides. A key regulating service provided by
the Ohinemuri River system and its flow regime, is the natural ability of the water to assimilate, process
and dilute contaminants (including sediment and nutrients) via a range of biological, chemical and
physical processes. In addition, the physical characteristics of the river such as riparian margins and
floodplains provide sites for storage and processing of contaminants. It was not possible to quantify the
contribution of these individual processes to contaminant regulation; however, the importance of this
regulating service should not be under-valued because of this.

Land-use activities were key sources of contaminants and provided additional pressure on the river’s
natural capacity to regulate contaminants. Contaminant sources included historic mining waste stored in

                                                      3
floodplains and river channels, point source discharges such as urban stormwater and diffuse sources
such as elevated sediment and nutrient concentrations from dairy and livestock land uses. Spatial
modelling predicted low nitrogen leaching rate for native forests (0 to 5kg/ha/year), medium for livestock
(10 to 30kg/ha/year) and relatively high for dairy (>40 kg/ha/year) with an average leaching rate from the
entire catchment of 18kg N/ha/year. On average, annual sedimentation rates in dairy (1.42t/ha/year) and
livestock (1.63 t/ha/year) areas in the catchment are more than three times as those in native
(0.29t/ha/year) and exotic (0.39t/ha/year) forests.

We used water quality (WQ) data and WRC water quality and human health standards as an indicator of
the river systems capacity to regulate contaminants. For those WQ parameters measured (including
heavy metals), all were within human health & ecological health guidelines except for nitrogen
concentrations and water temperatures for trout spawning. Heavy metal monitoring of sediments
indicated lead concentrations exceeding guideline values at some locations in the river system. The
Ohinemuri River system is providing a habitat regulating ES, including nursery habitat, for a range of
aquatic organisms. However, both trout and native fish habitats are constrained by existing low flows
while water quality characteristics such as high water temperatures are impacting on the trout fishery.
These habitats could be further compromised if alterations to flow regimes (i.e. increased water takes)
further impacted on low flow regimes and critical water quality characteristics.

Cultural Services
Recreational activities are a key cultural ES provided by the Ohinemuri River system and include trout
fishing (although declining), walking, cycling, swimming and boating activities). The value of fishing was
estimated at $74,569 per annum and walking at $1.754 million per annum. The historic mining remnants
present in the catchment are considered nationally significant by the Department of Conservation (DOC).
The Karangahake Gorge has high aesthetic values and is of national and regional significance with rising
visitor numbers increasing pressure on existing infrastructure. Scientific and educational ES are also high
in this catchment and the long-term water quality monitoring in the river system is of regional and national
value, evident in the number of publications that have been produced. The Ohinemuri is of cultural and
spiritual significance to Māori, including the Ohinemuri Waahi Tapu Area on the Ohinemuri River and
provides a source of food and fibre (i.e. flax). In a separate research project, the WRC is undertaking an
assessment of Māori cultural freshwater ES across the region (Hopkins, Kelepamu and Olubode-
Awosola, 2019) and hopefully the Ohinemuri catchment will be covered shortly.

Conclusions
This assessment had identified a wide range of valuable freshwater ES in the Ohinemuri catchment that
are benefiting local and wider communities. The main pressures on the freshwater ES identified in this
assessment included current low flow regimes, along with water quality aspects such as high nitrogen
concentrations and water temperatures. In combination, these factors are contributing to conditions that
require additional water supply treatment costs to address taste and odour issues and a declining
recreational trout fishery. Further reductions in low flows have the potential to exacerbate these
conditions. The outcomes and information from this project will assist the WRC with its role and
responsibilities under the Ministry for the Environment’s (MfE) Action for healthy waterways programme,
including the National Policy Statement for Freshwater Management and the MfE essential freshwater
modelling project.

Further work
In view of the information gathered during this freshwater ES assessment, there is potential future work to
expand the current assessment to include all freshwater resources in the catchment. Other opportunities
include undertaking a more in-depth assessment of the seasonal variability in water supply, to consider a
trade-off analyses of all ES in the catchment and to use the Ohinemuri catchment as a case study in the
development of environmental accounts. Spatial economic accounting and economic valuation tools
could also be used to assess the effect of governmental policies as such as the One Billion Trees
Programme, various land-use changes or new freshwater management scenarios on freshwater ES in the
catchment. The observation that water use is mostly less than the amount of water consented should be
explored to understand any implications for the WRC’s role of exploring potentials and identifying trade-
off in its resource management and plan review process under the Resource Management Act.

                                                     4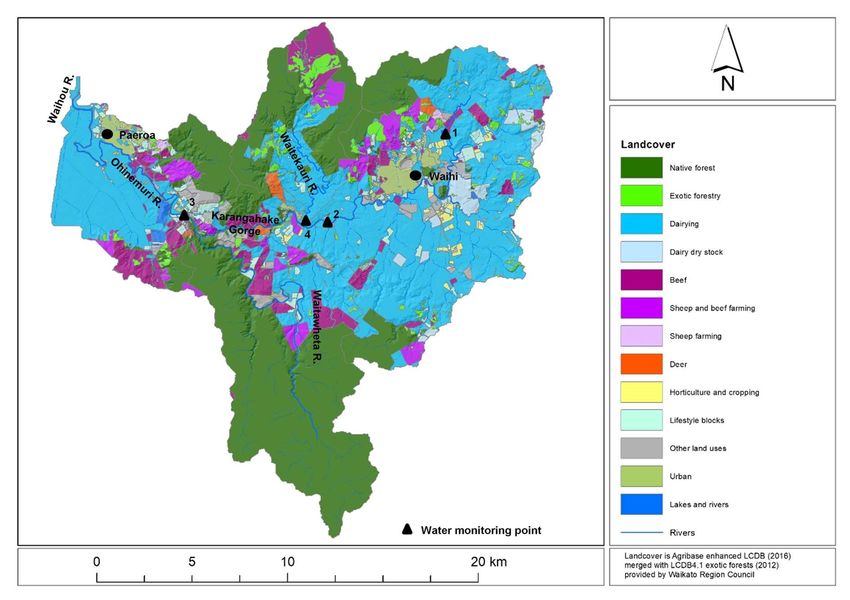
Report title
Ohinemuri catchment – river and streams
ecosystem services assessment

                   5
Table of contents
Executive summary ................................................................................................................................. 3
Introduction .............................................................................................................................................. 7
Ohinemuri catchment .............................................................................................................................. 8
Methods ................................................................................................................................................. 10
   Project Implementation and scope .................................................................................................... 10
   Spatial Modelling of Regulating Services .......................................................................................... 11
   Limitations .......................................................................................................................................... 13
Results ................................................................................................................................................... 14
   Provisioning ecosystem services ....................................................................................................... 14
   Regulating ecosystem services ......................................................................................................... 19
   Cultural ecosystem services .............................................................................................................. 30
Conclusions and recommendations ...................................................................................................... 36
Acknowledgements ............................................................................................................................... 38
References ............................................................................................................................................ 39
Appendix I: The CICES (V5.1) classes used in the Ohinemuri catchment freshwater ecosystem
services assessment ............................................................................................................................. 44
Appendix II: Price assumptions/estimates used in the Ohinemuri freshwater ES assessment ............ 51
Appendix III: Freshwater ES in the Ohinemuri catchment where quantitative/economic information was
identified ................................................................................................................................................ 52
Appendix IV Current discharge consents in the catchment .................................................................. 56
Appendix V: Scientific Papers/Reports pertaining to the Ohinemuri catchment ................................... 58

                                                                              6
Introduction
The Waikato Regional Council (WRC) is currently undertaking an ecosystem services (ES) approach
to identify, describe, quantify and value the freshwater ES in the Waikato Region. Ecosystem services
refers to the benefits people obtain from ecosystems (MEA, 2005; TEEB, 2010; UKNEA, 2011). These
include:
provisioning services (such as food and water);
regulating services (such as flood and disease control, nutrient regulation, water flow
regulation);
cultural services (such as spiritual, recreational, and cultural benefits); and
supporting services (such as nutrient cycling) that maintain the conditions for life on earth.
Recognition of ES is an integral component of WRC’s Regional Policy Statement, and Section 3.8
Ecosystem services states that ‘The range of ES associated with natural resources are recognised
and maintained or enhanced to enable their ongoing contribution to regional wellbeing’ (Waikato
Regional Council, 2016). The current freshwater ES assessment project also addresses Section
8.3.11 Advocacy and education - provide information on the value of freshwater resources and the
ecosystem services they provide. In particular, the information from this project is contributing to the
development of an interactive freshwater (rivers, streams, lakes and wetland) ES web map with
underlying databases and reports showing the current and potential ES of freshwater resources
(rivers, streams, lakes, wetlands) in the region. This map provides a visual representation of the
broader values of freshwater ecosystems, providing an informative and educational service to the
general public and supporting policy discussions and planning for on-going improvements in the
management of freshwater resources. This is a strategic contribution to the WRC’s mission of “a
healthy environment, a strong economy and vibrant communities.”
In Phase 1 of this project, a scoping study was undertaken in the Waikato River catchment that
involved a desktop research to identify, quantify and value (where possible) the freshwater
ecosystems services for a selection of lakes, wetlands, streams and rivers in the catchment. The
Millennium Ecosystem Assessment (MEA) framework was used as the basis for this assessment
(Olubode-Awosola, 2016). In Phase 2, the desktop evaluation of freshwater ES was extended into the
Waihou River catchment in the Waikato region of New Zealand, covering a selection of streams and
rivers (Baillie & Yao, 2018). A desktop evaluation was also completed for a wide range of terrestrial
geothermal sites in the Waikato region (McQueen & Bycroft, 2018). These research activities have
continued to provide refined estimates of the ecosystem services being assessed showing the spatial
distribution of the services as well as trends over time. In addition, the efforts have been yielding an
additional layer of information that reflects the values that community have for freshwater resources in
the region.
For Phase 3, WRC commissioned Scion to undertake an in-depth freshwater ES assessment of the
river and stream systems within the Ohinemuri catchment, applying the ES framework described in the
Common International Classification of Ecosystem Services (CICES) (Haines-Young & Potschin 2018)
along with the information from Phases 1 and 2 of this project. Unlike Phases 1 and 2 where we
primarily employed a desktop application for selected sites within a catchment, this project involved
assessing the freshwater ES of the entire catchment. The assessment included spatial modelling of
the impact of existing land uses (e.g. dairy, livestock, planted forests and native forests) on selected
regulating ecosystem services such as water regulation, avoided sedimentation of water ways and
nutrient regulation. Figures 1 and 2 provide an overview of the Ohinemuri catchment within the larger
Waihou Catchment, and surrounding areas, highlighting the river network, water quality locations, and
land use.
7Ohinemuri catchment
Figure 1: Location of the Ohinemuri catchment within the Waihou River system.
Source: Waikato Regional Council
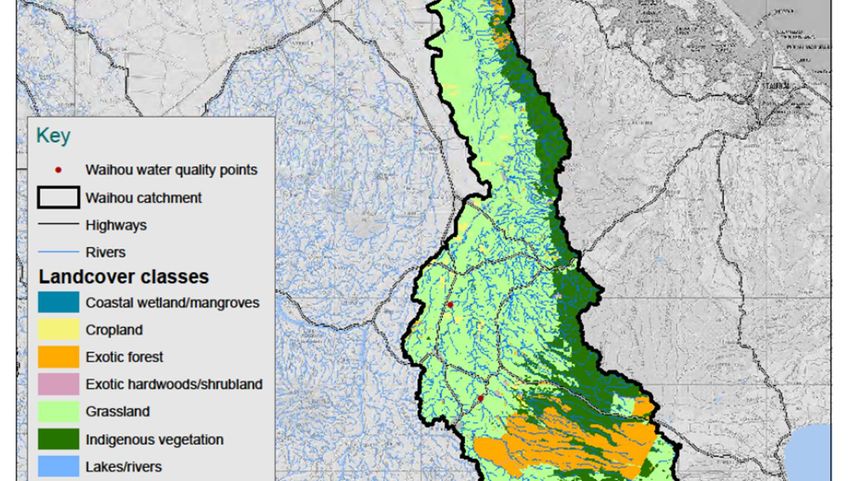
8The Ohinemuri catchment is located in the Hauraki District of the Waikato Region. The headwaters of
the Ohinemuri catchment originate in western hill-country (Figures 1 & 2), north-east of Waihi. The
Ohinemuri River is approximately 28km in length and flows in a westerly direction, draining steep hill
country to the north (the southern end of the Coromandel Range) and to the south (northern end of the
Kaimai Range). The river flows through the Karangahake Gorge and across floodplains to its
confluence with the Waihou River near the township of Paeroa. The Ohinemuri has a catchment area
of 34,803ha. The predominant land cover is dairying (34%), along with indigenous forest (30%)
located primarily in the steeper areas of the catchment. Another 16% of the catchment is in livestock
farming. The land uses that were grouped into the “Other” category included fruit growing, lifestyle
block, idle land, plant nurseries, poultry, saleyards, tourism, urban, vegetable and wetland. This
category accounted for about 5% of the total area of the Ohinemuri catchment. Paeroa and Waihi are
the two largest townships in the catchment. There are four water quality monitoring sites within the
river system (Figure 2):
1. Ohinemuri River @ SH25 Bridge (water quality, ecology)
2. Ohinemuri River @ Queens Head (water quality, flow)
3. Ohinemuri River @ Karangahake (water quality, flow)
4. Waitekauri River @ Up-Stream Ohinemuri confluence (water quality)
Figure 2: Features of the Ohinemuri catchment
9Methods
Project Implementation and scope
In an initial meeting between WRC and Scion, the outcomes from Phases 1 and 2 of this project,
research activities for Phase 3 and the scope of the Phase 3 freshwater ES assessment were
discussed.
The Ohinemuri catchment was selected for the Phase 3 freshwater ES assessment because:
it has a mixed land-use: high producing exotic grassland & indigenous forest along with mining
activities,
there is rainfall, river level & flow, suspended sediment, water quality, &
ecological/biological/habitat data,
there are consents for both water supply/extraction and discharge to water in the catchment,
there are noticeable recreational activities relating to the Ohinemuri River,
there are sites of scientific research,
it contains a number of historical ES values,
there are pressures of intensified land-use and flood risk and their potential impacts on
freshwater ES,
it is of a suitable size to undertake a more in-depth assessment than the desktop assessments
in phases 1 and 2.
it is also assumed there are cultural/Māori values
The aim was to undertake a more in-depth assessment of the freshwater ES in the Ohinemuri
catchment to identify, describe and where feasible, quantify, model and provide an economic valuation
of the freshwater ES present in the catchment. ES assessments were undertaken at the reach or
catchment scale, whichever scale was most appropriate for the ES being assessed. Where possible
and appropriate, reach ES information was ‘scaled up’ to provide an assessment for total catchment.
We applied the Common Classification of Ecosystem Services (CICES) V5.1 (Haines-Young and
Potschin, 2018) framework to assess freshwater (streams and rivers) ES associated with the
Ohinemuri catchment. The CICES uses a classification system that allows translation between
different ecosystem service classification systems, such as those used by the Millennium Ecosystem
Assessment (MEA) and the Economics of Ecosystems and Biodiversity (TEEB). CICES V5.1 uses a
five-level hierarchical structure (Figure 3).
Figure 3: The hierarchical structure of CICES V5.1, illustrated with reference to a provisioning service
‘cultivated plants’ (Haines-Young and Potschin, 2018)
Under the CICES framework, provisioning, regulating and cultural ES have been divided into biotic
and abiotic ES. Classes can, where appropriate, be aggregated, and there is the option to include
10additional classes when required. Further information and guidance on CICES V5.1 is available in
Haines-Young and Potschin (2018).
For this project, as a first step, biotic and abiotic ES relevant to freshwater were extracted from the full
CICES list along with components of the freshwater ES assessment template used in the Phases 1
and 2 to develop the template excel spreadsheet used in this Phase 3 assessment. Similar to Phase 1
and 2, we focused on the three groups of ES (provisioning, regulating and cultural), and did not
include any items under the group of supporting services, to avoid double counting. The freshwater ES
template used to collate the data for this project covered 22 provisioning ES classes, 21 regulating ES
classes and 14 cultural ES classes. These classes are listed in Appendix I. A freshwater ES
evaluation code was applied to each ES where: 1 = high level of certainty that the ES was not present
in the catchment; 2 = ES may be present but no information found; 3 = ES highly certain to be present
but no information found; 4 = ES present and qualitative information located; 5 = ES present,
quantitative information located; 6 = ES present, quantitative and economic data available. For some
ES, more than one evaluation code was applicable (Appendix I). For those ES where an economic
evaluation was possible (Evaluation Code 6) Appendix II provides details of the costings used.
In Phase 2, the desktop research on freshwater ES assessment was confined to the vicinity of two
water quality monitoring stations in the catchment. The desktop assessment of the Ohinemuri
catchment was repeated in Phase 3 to cover the entire catchment from its headwaters to its
confluence with the Waihou River. Relevant agencies (i.e. WRC, MPI, Hauraki District Council, Fish &
Game, Department of Conservation) and personnel were contacted by both phone and e-mail to
collate further information on the freshwater ES in the catchment.
Spatial Modelling of Regulating Services
The MEA (2005) broadly defines regulating services as the benefits obtained from the regulation of
ecosystem processes. This ES category includes freshwater ES such as erosion control, water
purification and water storage, provided by the Ohinemuri River system. However, the type of
vegetation or landcover in the landscape plays a crucial role in soil retention, prevention of landslides,
water flow regulation and nutrient retention. Landcover also influences the magnitude of runoff,
flooding and aquifer recharge in the catchment, strongly influencing the freshwater ES in the river
system itself. Hence, we undertook catchment scale modelling of soil erosion, nutrient leaching and
water yield to improve our understanding of how these different land uses in the catchment affect
freshwater resources and the ecosystem services they provide in the Ohinemuri catchment. This
information is useful for planners and practitioners.
As we did not look at the changes in the provision of ecosystem services due to potential land use
change or afforestation, we are unable to estimate the monetary value of the ecosystem services.
However, this method enables the demonstration of trends or patterns of biophysical processes
across land uses in the catchment.
Spatial analysis of soil erosion
To analyse the erosion rate in the Ohinemuri catchment, we used the New Zealand Empirical Erosion
Model (NZEEM). NZEEM is a spatial environmental model that enables the estimation of erosion rates
of woody (e.g. native forests and planted forests) and non-woody (e.g. bare land, pasture) vegetation
across the landscape (Dymond, et al., 2010). NZEEM calculates the amount of sediment generated
under the current woody vegetation in tonnes of sediment per square kilometre per year, and the
sedimentation rate associated with non-woody land use. In this assessment, NZEEM was used to
provide an indicative long-term mean erosion rates under current land cover in the Ohinemuri
catchment.
Nutrient analysis
Under a five-year research programme at Scion, called the Growing Confidence in Forestry’s Future,
the team has developed an initial avoided nutrient function within the spatial economic tool called the
Forest Investment Framework (FIF) (Yao et al. 2016; Yao et al. 2019a). The avoided nutrient analysis
utilises spatial information on leaching from Dymond et al. (2013). To provide an overview, the
OVERSEER® model was used to predict nitrate leaching rates per animal for every soil and climate
11combination across New Zealand. These data were combined with maps of animal numbers to
produce a national map of nitrogen leaching (Dymond et al. 2013)”. FIF utilises nitrogen leaching (kg
nitrate-N/ha/year) as a baseline to compare current land use and the establishment of a plantation
forest.
In this FIF application, we did not assume any land use change, so we cannot assign a monetary
value for avoided nutrients. Instead we used the N leaching layer to provide area weighted values of
leaching across each land use class. To achieve this, we used the land cover spatial information
(Agribase) provided by WRC. Because the forestry class was not well represented in the Agribase
layer, we merged the exotic forest class from LCDB4.1 into the Agribase layer for completeness and
this layer was used to summarise N leaching per land use class using the zonal sum function in
ArcGIS as a table. The summary table was joined with the original spatial information for the
calculation of N leaching per land use class on an area basis (area weighted).
Annual water yield
Water yield is broadly defined as the amount of water "produced" by a watershed or a catchment. It is
usually referred to as the difference between precipitation and evapotranspiration. However, there are
several factors to consider when modelling water yield. To estimate the annual water yield in the
catchment by land use and by sub-catchment, we used the InVEST Water Yield model (Sharp et al.
2018). The model is part of the InVEST set of spatial tools that map and value a wide range of ES
(e.g. carbon storage and sequestration, habitats and pollination). The InVEST annual water yield
module calculates annual water yield from a catchment and can be extended to calculate hydropower
production. We utilised the InVEST water yield module to spatially quantify water yield and
consumptive water use for each land use/landcover type across the Ohinemuri catchment. This model
estimates the total annual water yield for each grid cell of the study area. For calculation details and
the water yield equations refer to Sharp et al, (2018). Nine data sets are required for the water yield
module to operate, namely: (1) annual average precipitation; (2) annual average potential
evapotranspiration; (3) depth to root restricting layer; (4) plant available water content (AWC); (5) land
use; (6) watersheds; (7) biophysical table; (8) the seasonality factor; and (9) water demand table. The
biophysical table in conjunction with the spatial landcover data provides the basis for estimating water
yield, which includes landcover types, the plant evapotranspiration coefficient (Kc) factor related to
each landcover, and the maximum rooting depth for each landcover.
The data required for running the water yield model came from different sources. Specifically, annual
average precipitation and potential evapotranspiration data (Wratt et al., 2006) from NIWA was
projected from New Zealand Map Grid (NZMG) to New Zealand Transverse Mercator (NZTM) and
resampled to a 25-m cell size resolution. Root restricting layer, and available water content (AWC),
was developed from the fundamental soil layers (LRIS, 2010). Root restricting layer was developed
from the Potential Rooting Depth1 layer. Potential rooting depth describes the minimum and maximum
depths to a layer that may impede root extension. Such a layer may be defined by penetration
resistance, poor aeration or very low available water capacity. These classes are described more fully
in Webb and Wilson, (1995), and Griffiths (1985). Fundamental Soil Layers (FSL) were also used to
develop AWC with values from zero to one. Land use/land cover (LULC) was developed from
Agribase2 data provided from WRC. Watersheds were developed from River Environment
Classification (REC) data (Snelder et al, 2004), that identifies sub-catchments across the Ohinemuri
catchment. A biophysical table was developed from the LULC spatial layer that corresponds with each
land use. This table includes information on whether the landcover class was vegetated or not, rooting
depth, and the plant evapotranspiration coefficient (Kc). We estimated these parameters and
coefficients from broad habitat classes by matching these classes descriptions with those in
Madgwick, (1994); Canadell et al. (1996); Allen et al. (1998), and Sharp et al. (2018). The seasonality
constant (Z) was estimated as 0.2 * N, where N is the average number of raindays (> 1-mm) per year
over the study period (Donohue, 2012, Hamel, 2015), giving a value of 28 for Z. We present in Table 1
the list of parameters and coefficients used in the water yield biophysical model and the water demand
model.
1PRD: https://lris.scinfo.org.nz/layer/48110-fsl-potential-rooting-depth/
2Agribase: https://www.asurequality.com/our-solutions/agribase/
12Table 1: InVEST parameter values and coefficients for the annual water yield model. (Sources
detailed in the above paragraphs)
Land-
Landcover (LC) LULC
use Water demand Rooting depth Kc*
description Landcover description LULC description vege-
(LU) (m3/ha/year) (mm)
code tation
code
Alpaca and/or Llama
1 ALA Breeding 28.1 Closed grassland 1 1200 0.7
2 BEF Beef cattle farming 51.5 Open grassland 1 1100 0.6
3 DAI Dairy cattle farming 155.9 Closed grassland 1 1200 0.7
4 DEE Deer farming 37.1 Closed grassland 1 1200 0.7
5 DRY Dairy dry stock 97.3 Closed grassland 1 1200 0.7
6 FOR Forestry 0.0 Exotic forestry 1 3500 0.78
7 FRU Fruit growing 6.2 Perennial cropland 1 2600 0.52
8 GOA Goat farming 84.9 Closed grassland 1 1200 0.7
9 GRA Grazing other people’s stock 103.5 Closed grassland 1 1200 0.7
10 HOR Horse farming and breeding 26.5 Closed grassland 1 1200 0.7
11 LIF Lifestyle block 34.6 Closed grassland 1 1200 0.7
Dense native
12 NAT Native Bush 0.3 forest 1 3700 0.82
New Record – Unconfirmed
13 NEW Farm Type 2.1 Closed grassland 1 1200 0.7
Not farmed (i.e. idle land or
14 NOF non-farm use) 0.0 Shrubland 1 1600 0.5
15 NUR Plant Nurseries 15.7 Other 0 0.1 0.1
Enterprises not covered by
16 OTH other classifications 0.0 Other 0 0.1 0.1
17 POU Poultry farming 93.5 Other 0 0.1 0.1
18 SHP Sheep farming 34.1 Open grassland 1 1100 0.6
19 SLY Sales yard 0.0 Closed grassland 1 1200 0.7
Mixed Sheep and Beef
20 SNB farming 30.7 Open grassland 1 1100 0.6
Tourism (i.e. camping
21 TOU ground, motel) 0.6 Other 0 0.1 0.1
Unspecified (i.e. farmer did
22 UNS not give indication) 0.0 Other 0 0.1 0.1
23 VEG Vegetable growing 0.0 Annual cropland 1 2000 0.69
24 Undefined Undefined 0.0 Undefined 0 0.1 0.1
*Plant evapotranspiration coefficient (Kc)
Limitations
The assessment of freshwater ES in the Ohinemuri catchment was confined to the river and
stream network and did not cover lakes, wetlands or groundwater.
While Māori cultural services were outside the scope of this assessment and are being
addressed separately, any pertinent information identified during the ES assessment was
noted in the template spreadsheet.
In Class Code 2.1.3.1 which covers scientific research in the catchment, Google Scholar and
a search of the WRC technical reports was used to compile a list of scientific publications and
reports along with any other pertinent references found while undertaking this project. This is
not an exhaustive list of scientific publications on the surface freshwaters (rivers and streams)
of the Ohinemuri catchment.
The level of effort applied to each ES class depended on the quality and quantity of
information available, the importance/relevance of the ES class to the Ohinemuri catchment
and financial constraints of the project.
13Results
Of the 57 freshwater ES classes assessed in the Ohinemuri catchment, those ES identified as ‘not’
present’ in the catchment related to in-situ aquatic plant and animal aquaculture and hydro-power
(Appendix I). The ES that were assessed as ‘not likely to be present in the catchment’, mainly applied
to a range of provisioning ES (i.e. provision of genetic material for a range of purposes), whereas
those ES highly likely to be present in the catchment, even though no information was located, were
all regulating services (Appendix I). Some type of information was located for just under half the
freshwater ES assessed (Table 2), most of the information was qualitative, followed by quantitative
data (Appendix III). Economic data was identified for commercial eel fisheries, drinking and non-
drinking water, and the recreational activities of fishing and walking (Appendix III).
Table 2: Summary of the type of information found on the freshwater ES in the Ohinemuri catchment
ES Evaluation Code* Number of ES classes*
1 - not present 6
2 – may be present 10
3 – highly likely to be present 14
4 – present, qualitative information 18
5 – present, quantitative information 14
6 – present, quantitative & economic data 5
*See Appendix I for full details on the evaluation code and ES class details. Note that the total number of classes
(67) is greater than the number assessed (57) as some classes had more than one evaluation code.
For ease of reporting, ES classes have been combined where appropriate in the results section below.
For example, CICES separates ES into biotic and abiotic ES. This arbitrary separation does not
always align well with assessing freshwater ES in a river system where biotic and abiotic processes
are synergistic and cannot be easily separated. In these instances, the biotic and abiotic ES have
been grouped together and discussed as a single ES. For example, CICES has five regulatory ES
covering the mediation of waste, toxics and other nuisances by living and non-living processes:
-Biotic, Class Code 2.1.1.1. Bio-remediation by micro-organisms, algae, plants, and animals
-Biotic, Class Code 2.1.1.2 Filtration/sequestration/storage/accumulation by micro-organisms, algae,
plants, and animals
-Biotic, Class Code 2.2.5.1 Regulation of the chemical condition of freshwaters by living processes
-Abiotic, Class Code 5.1.1.1 Dilution by freshwater and marine ecosystems
-Abiotic, Class Code 5.1.1.3 Mediation by other chemical or physical means (e.g. via Filtration,
sequestration, storage or accumulation)
As these processes will be occurring simultaneously as the water flows down the river system and no
data was found on these individual processes, they have been grouped together for the purposes of
this report.
Provisioning ecosystem services
Biotic
Division: Biomass
Groups: Cultivated in-situ aquatic plants/ reared aquatic animals for nutrition, materials or energy.
Class Codes: 1.1.2.1, 1.1.2.2, 1.1.2.3, 1.1.4.1, 1.1.4.2, 1.1.4.3
No in-situ plant or animal aquaculture operations for the purposes of providing nutrition (food), fibre
and materials, or energy were found in the Ohinemuri catchment.
Group: Wild plants (aquatic) for nutrition, materials or energy
Class Codes: 1.1.5.1, 1.1.5.2, 1.1.5.3
There is anecdotal evidence that watercress is collected for nutrition (food) in the Ohinemuri
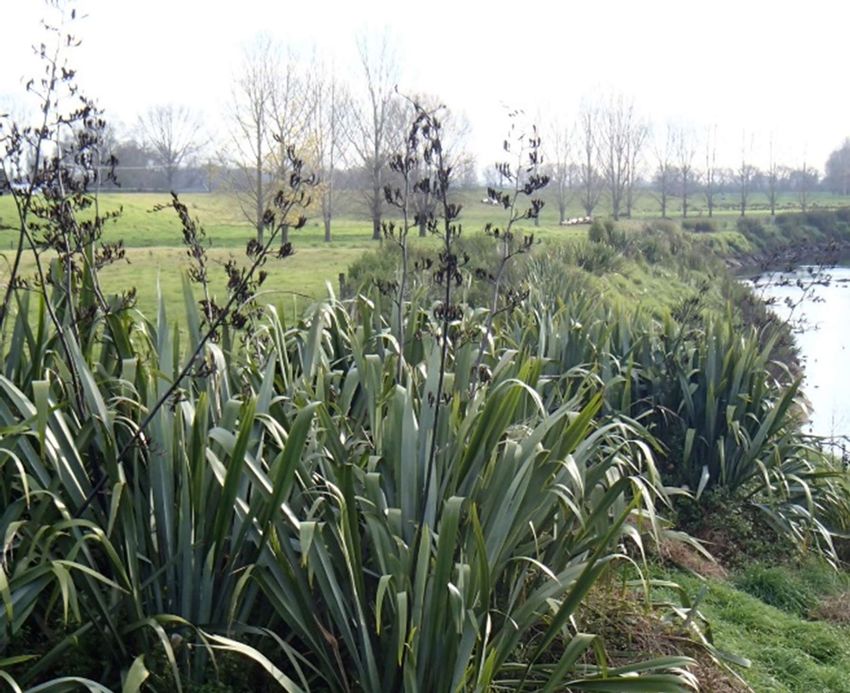
catchment, but no quantitative information was found. In the past, flax has been planted along the
lower reaches of the Ohinemuri River approximately 15 km upstream from its confluence with the
Waihou River. A local marae uses this site to harvest flax for fibre (e.g. weaving).
Group: Wild animals (aquatic) for nutrition, materials or energy
14Class Codes: 1.1.6.1, 1.1.6.2, 1.1.6.3
Wild aquatic animals in the Ohinemuri catchment are providing a nutrition (food) resource. For
example, white-baiting occurs from the confluence of the Ohinemuri with the Waihou River upstream
to just below Mackaytown (Barrier, 1994) and there is a current resource consent for a whitebait stand
in the lower Ohinemuri River. However, no quantitative information was found on the amount of
whitebait catch. The Ohinemuri River system is popular for trout fishing (rainbow and brown),
particularly the section of the river that runs through the Karangahake Gorge and the Waitawheta
River (a tributary of the Ohinemuri). While trout will be providing a food source, we were unable to
identify any quantitative data on this. The recreational aspects of trout fishing are covered under the
Cultural ES 6.1.1.1.
There is a commercial eel fishery in the Ohinemuri catchment for both longfin and shortfin with a
fishing event intensity of 2.1-3.0 fishing events per year in the lower part of the river, and less than one
fishing event per year in the upper reaches or tributaries (Figure 17, Bentjies et al. 2016). Figure 4
shows somewhat a stable catch of both shortfin and longfin eel over the past six years (2013 to 2019).
Figure 4: Commercial eel catch in the Ohinemuri catchment (Source: MPI 2019 via the Official
Information Act)
Based on the data collected on the eels caught in the Ohinemuri sub-catchment via the Official
Information Act, the average quantity of eel catch in kilograms per year was about 38,848kg in green
weight. Assuming that 90% of the total weight of the catch was sold in the market and using the price
of $22.64 per kg (Appendix II), the annual value of eels caught in the Ohinemuri was about
NZ$791,500 (Appendix III). Although the eel industry in New Zealand is quite small relative to many
other industries, it has been estimated the total revenue generated from export of eels in 2011/12
reached more than $10 million (Ministry for Primary Industries, 2013). In addition to this market value
of the provisioning benefit, eels are also considered as a valued taonga species in New Zealand.
Despite the limited information available, there has been some claims of marginal recreational fishing
in eels as well.
Division: Genetic material
Groups: Genetic material from plants, algae or fungi collected for maintaining or establishing a
population, used to breed new strains or varieties, Individual genes for the design and construction of
new biological entities
Class codes: 1.2.1.1, 1.2.1.2, 1.2.1.3
While freshwater plants, algae or fungi and their genetic material may be contributing to the
maintenance or establishment of populations, breeding new strains or varieties or the development of
new genetic entities, no evidence was found for these ES in the Ohinemuri catchment.
15Division/Group: Other types of provisioning service from biotic sources
Class: Wild plants (aquatic, including fungi, algae) used for medicinal/pharmaceutical/health purposes;
Code 1.3.1.1.
While there is the potential for aquatic plants to be used for health benefits i.e. gel from flax plants for
skincare products, whether flax or any other freshwater plant material is being used for health and/or
pharmaceutical purposes in the Ohinemuri catchment is unknown.
Abiotic
Division: Water
Group: Surface water used for nutrition, materials or energy
Class: Surface water for drinking and non-drinking purposes; Codes 4.2.1.1, 4.2.1.2
There are three current resource consents in the Ohinemuri catchment for the surface water extraction
for domestic/municipal water supply and 10 surface water non-drinking water consents primarily for
dairy and horticultural use (Table 3; Figure 5). All three water takes for domestic and municipal supply
are located upstream from known discharge consents (Figure 5). Two are in the headwaters of the
Ohinemuri where land use is dominated by horticulture and cropping. The third site is in the
Waitawheta catchment dominated by native forest. The remaining surface water takes are primarily for
agricultural and horticultural activities (Table 3).
Table 3: Current surface water take consents in the Ohinemuri catchment
Authorisation Applicant/ Activity Description Annual Water use Water use
ID Holder total Primary Secondary
take(m3)
No* Domestic and municipal
1 130392.01.01 Hauraki Take water from the 1056000 Domestic & Drinking water
District Walmsley Stream Municipal supply -
Council (Waihi water supply) Water Supply Domestic, rural
or urban
2 130392.03.01 Hauraki Take water from the 1054000 Domestic & Drinking water
District Ohinemuri Stream Municipal supply -
Council (Waihi water supply). Water Supply Domestic, rural
or urban
3 AUTH101995.0 Hauraki Take water from 2506460 Domestic & Drinking water
1.02/APP1402 District Waitawheta River for Municipal supply -
28 Council Paeroa Public water Water Supply Domestic, rural
supply or urban
Non-drinking water
4 120591.01.01 Menefy Take up to 250 m3 10000 Horticulture/ Irrigation
Family water per day from the market
Trust Ruahorehore Stream for gardening
frost protection
purposes
5 122956.01.01 Paeroa Golf To take water from 10000 Recreation/ Irrigation
Club Kuaoiti Stream amenities/
sport
6 124954.01.01 Suraj To take water for use on 22000 Horticulture/ Frost
Horticulture kiwifruit orchard market protection
Services gardening
Limited
7 125093.01.01 SN Fleming To take water from an 85259.8 Industry Bottling
unknown tributary of (Food
Doherty Stream processing)
8 125648.01.01 Macedonian To take surface water - 11497.5 Agricultural Shed wash
Properties Homunga Stream farming -
Limited dairy
9 125719.01.01 Waihiki To take water from an 5723.2 Agricultural Stock water
Holdings unnamed tributary of farming - and shed wash
Limited the Ruahorehore dairy
Stream
10 125825.01.01 Langeveld To take surface water 10220 Agricultural Shed wash
Farms from the Taieri Stream farming -
Limited dairy
1611 134184.01.01 Dairy To take water from an 6694.1 Agricultural Shed wash
Properties unnamed tributary of farming -
(2006) Ltd. the Ohinemuri River dairy
12 136485.01.01 Laneway To take Surface Water 0** Industry - Drilling and
Resources quarry/mining testing (non-
Limited -gold/precious geothermal)
metals
13 139689.01.01 Rahu Take water from surface Unknown Mining - -
Resources water sources gold/precious
Pty Limited metals
*Reference number for the locations of the consents in the catchment in Figure 5.
**The annual take for this consent is zero as the take is intermittent and water used during drilling is returned to
the waterbody.
19
23
1
18
22 28
15 21
14 24
12 2 8
27 35&
37 33
25 16d 38
17
7 26 34&36 29&3
16a 16c
13 4 30&3
16b 1
5 3 11 9
10 6
20
Agribase (2016)
Provided by Waikato Regional Council
Figure 5: Location of current resource consents for water takes and discharges in the Ohinemuri
catchment. See Table 3 and Appendix IV for details of the water take and discharge consents
Where water is extracted from the Ohinemuri and Waitawheta Rivers for the Waihi and Paeroa town
water supply, the river is unable to attenuate the water smell & taste. The suspected cause is warm
water temperatures (approx. November to March) and dying algae and other bacteria3 . While water is
treated to meet drinking water standards, we were unable to obtain costs on this. Actual water
extraction data was provided to the project team by WRC. This data set covered two extraction sites
for drinking/municipal use (Waitawheta and Walmsey streams) and seven non-drinking sites
(Doherty's Stream Tributary, Homunga Stream, Ohinemuri River, Ohinemuri River Tributary,
Ruahorehore Stream 1, Ruahorehore Stream 2 and Kuaoiti Stream). The data provided was patchy
with the Ruahorehore site having 8 months (in 2018) of actual water extraction data while the
Waitawheta Stream had a 16-year drinking water extraction data. We have extrapolated based on the
data at hand and arrived at an average annual drinking water extraction rate of 1,681,119 million m3
and non-drinking rate of 58,345 m3. Assuming that these volumes of water have been distributed to
the residents and non-drinking water users, and assuming that the price per m3 of water is $1.80/m3
3https://www.stuff.co.nz/waikato-times/news/88676542/waihi-water-no-longer-smells-like-teenage-
boys-socks
17for drinking and $0.15 for non-drinking (Appendix II), the total potential revenue values would be
approximately $3 million and $8,752, respectively (Appendix III).
We present in Figures 6 and 7 the maps of the water supply and water consumption that were
generated using the InVEST Annual Water Yield model. Comparing Figures 6 and 7, we can find that
on an annual basis, the volume of water supply far exceeds the volume of water consumed by the
different land uses in Ohinemuri (Tables 3a & 3b). By juxtaposing Figure 7 with the catchment’s land
cover map in Figure 5, we can see a pattern that the water consumption is higher in dairy and
livestock farms than forest areas. While the InVEST Annual Water Yield model provides an estimate of
total annual water yield in the catchment, decision making processes and policy discussions would
need information on the impacts of seasonal flows, especially during the dry season. To account for
seasonality flows (high and low flows), a future exercise can be the application of the InVEST
Seasonal Water Yield model. The Seasonal Water Yield model computes spatial indices for
quantifying the relative contribution of land spatial units to the generation of both baseflow and quick
flow across the catchment (Sharp et al., 2018).
Figure 6: Simulated water supply using the InVEST annual water yield model with the 5 sub-
catchments (numbered) used to produce statistics in Table 4a
18Figure 7: Simulated water consumption using the InVEST annual water yield model using the spatial
data provided by WRC. Note that the 5 sub-catchments (numbered) were used to produce statistics in
Table 4a
Regulating ecosystem services
Biotic & Abiotic
Division: Transformation of biochemical or physical inputs to ecosystems
Groups: Mediation of wastes or toxic substances of anthropogenic origin by living processes
Mediation of waste, toxics and other nuisances by non-living processes
Water conditions
Class Codes: 2.1.1.1 (bio-remediation by micro-organisms, algae, plants, and animals); 2.1.1.2
(filtration/sequestration/storage/accumulation by micro-organisms, algae, plants, and animals); 2.2.5.1
(regulation of chemical processes by living processes); 5.1.1.1 (dilution), 5.1.1.3 (mediation by other
chemical or physical means, e.g. filtration, sequestration, storage or accumulation)
Rivers and streams have a natural ability to dilute, assimilate and process contaminants (including
sediment and nutrients) via a range of biotic and abiotic processes. The rate at which these processes
occur will be dependent on a wide range of factors including temperature, light availability,
composition of biological communities, water chemistry, sediment composition and flow regimes (Allan
& Castillo, 2009; Fono et al., 2006; Moore et al., 2012). The flow regime of the Ohinemuri River
system provides a natural dilution ES (Class Code 5.1.1.1) which increases down the river system
(upper SH25 flow site, mean flow = 1.22 m3/sec; lower Karangahake flow site, mean flow = 12.2
m3/sec; data provided by WRC). Changes to natural flow regimes such as increased water takes may
compromise natural dilution processes in the river system, particularly during periods when there are
likely to be higher concentrations of contaminants in the waterways, for example, during periods of low
flow. Biological, chemical and physical processes such as bio-remediation, adsorption, absorption,
chemical transformation, filtration and sequestration (Class Codes 2.1.1.1., 2.1.1.2, 2.2.5.1, 5.1.1.3)
also provide a natural contamination regulation ES, although we are unable to find quantitative
information on the amounts of contaminants removed via these processes.
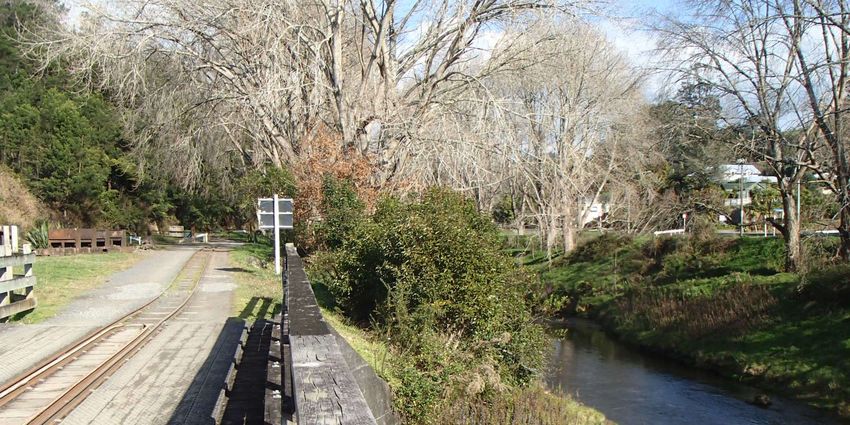
19The morphological features of the river system provide additional sites for contamination processing
and storage. Low flow areas provide in-stream storage sites for sediment and other contaminants and
during higher flows riparian margins and floodplains (Figure 8) provide storage sites for flood waters,
sediment and debris. Riparian margins also filter sediment, nutrients, and contaminants coming off the
land before they reach the waterway. While the quantities of contaminants removed or stored in these
locations is unknown, a notable exception is the historic mining waste that has been discharged into
the Ohinemuri River and its tributaries (Clement et al., 2017). The volume of mine waste stored in the
Ohinemuri floodplain is estimated at 1.13 M m3 and mine waste stored in the floodplains and along the
river channel contains elevated quantities of heavy metals such as lead, arsenic and zinc that still
pose a risk to the environment (Clement et al., 2017).
Figure 8: Ohinemuri floodplains
The main sources of contaminants reaching the river system (point-source and diffuse), come from
land-use activities in the catchment. As discussed above, historic mining waste is one source of
contamination. Discharge resource consents provided information on point source discharges into the
Ohinemuri river. We located 25 current resource consent discharge permits (Figure 5 and Appendix
IV). There is a cluster of discharge consents held by Oceana Gold Ltd. in the upper part of the
catchment, in relation to mining activities, along with another cluster in the lower section of the river
near Paeroa (Figure 5; Appendix IV). Stormwater discharges for the main townships in the catchment
are distributed along the main stem of the Ohinemuri River.
Diffuse sources of contaminants such as nutrients (Vant, 2016) and sediment (Haddadchi & Hicks,
2016; Hoyle, 2014) provide additional pressure on the rivers natural capacity to regulate contaminants.
Of particular concern in many waterways across New Zealand, including the Ohinemuri, is nitrogen
leaching. Using a spatial nitrogen leaching function loosely coupled with FIF, we simulated the
nitrogen leaching in the catchment (Figure 9). Juxtaposing the nitrate leaching map below with the
landcover map in Figure 5, we can see a pattern that leaching rate is low under native forests (0 to 5
kg/ha/year), medium under livestock (10 to 30 kg/ha/year) and high under dairy (>40 kg/ha/year).
Based on the nitrogen leaching spatial model, the entire catchment had an average leaching rate of 18
kgN/hayear. Amongst the four major land uses, dairy had the highest average nitrogen leaching (36kg
N/ha/year) followed by livestock (16kg N/ha/year), exotic forestry (0.3kg N/ha/year) and native forests
(0.3 kg N/ha/year) (Table 4b). Sub-catchment 2, which had the largest proportion of native forests
(66%), had the least amount of leaching (6kg N/ha/year) while sub-catchment 5 with 56% dairy had
the highest average leaching rate of 33kg N/ha/year (Table 4b).
20Figure 9: Simulated spatially explicit nitrogen leaching across the Ohinemuri catchment using a
spatial model. Note that the 5 sub-catchments (numbered) were used to produce statistics in Table 4a.
21Table 4a: Summary of the quantified regulating service values across the major land uses in the five Ohinemuri sub-catchments using NZEEM, InVEST and
Nitrogen Leaching Models
Nitrate Water Consumptive Realisable
Sedimentation
Area Dairy Livestock* Exotic forestry Native forest Other land use NoData leaching yield water use water supply
(kg N/ha
(m3/km/year) (m3/ha/year) (m3/ha/year)
/year) (m3/ha/
(ha) (%) (%) (%) (%) (%) (%) year)
Sub-catchment 1 6,315.9 34.0 20.2 0.1 7.2 9.6 28.8 15.7 78.5 601.4 78.2 523.2
Sub-catchment 2 10,127.8 11.2 13.0 0.0 66.1 4.1 5.6 5.9 70.4 793.7 24.0 769.7
Sub-catchment 3 4,312.7 26.8 20.4 - 43.0 0.6 9.3 9.5 145.3 1,090.4 63.0 1,027.4
Sub-catchment 4 7,093.5 49.0 15.2 1.0 10.7 4.8 19.3 27.7 137.5 922.7 96.3 826.3
Sub-catchment 5 6,926.5 55.7 16.0 0.0 7.3 5.9 15.1 33.2 109.2 911.4 113.5 798.0
No data 26.6 - - - - - - - - - - -
Ohinemuri 34,802.9 33.9 16.3 0.2 29.5 5.2 14.9 17.5 102.2 839.0 66.9 772.1
* Includes dairy dry stock, beef farming, sheep and beef farming, deer farming, goat farming and grazing other people’s stock.
Table 4b: Quantified regulating service values across the major land uses in the Ohinemuri catchment using NZEEM, InVEST and Nitrogen Leaching Models
Consumptive
Area Area Nitrate leaching Sedimentation Water yield water use Realisable water supply
(ha) (%) (kg N/ha/year) (t/km2/year) (m3/ha/year) (m3/ha/year) (m3/ha/year)
Dairy 11,766 33.8 36.5 141.8 823.0 125.2 697.8
Livestock* 5,658 16.3 13.1 163.2 868.6 58.6 810.1
Exotic forestry 86 0.2 1.4 39.1 1160.9 20.3 1140.6
Native forest 10,271 29.5 0.3 28.6 831.0 7.6 823.4
Other** 1,799 5.2 6.2 75.4 879.2 48.2 831.0
No data 5,223 15.0 - - - - -
Ohinemuri catchment 34,803 100.0 17.5 102.2 853.4 63.2 790.1
* Includes dairy dry stock, alpaca and llama, beef farming, mixed sheep and beef farming, farming, goat farming, grazing other people’s stock, sheep farming
** Includes fruit growing, lifestyle block, idle land, plant nurseries, poultry, saleyards, tourism, urban, vegetable and wetland
22If the load of a contaminant is too high, the capacity of a water body to store, assimilate and/or
process the contaminant may be exceeded (as in the case of mining waste discussed above). This
can result in a degradation of water quality and, if effect thresholds are exceeded, would result in
adverse effects on aquatic organisms, recreational and cultural values, human health and downstream
receiving environments such as lakes and estuaries4 . Water quality monitoring data was used as an
indicator of Ohinemuri river systems natural capacity to assimilate and regulate contaminants inputs
by assessing against WRC water quality guidelines and standards5 (Table 5). However, we
acknowledge that these median indicator values do not cover seasonality and intra-annual variations
where water quality conditions may fall below thresholds for human and ecological health at critical
times of the year or during critical periods within an organism’s life cycle.
Table 5: Median water quality characteristics along the main stem of the Ohinemuri River (S.H.25,
Queens Head, Karangahake) and the Waitekauri sub-catchment. Colour code for rating against WRC
water quality guidelines and standards: Excellent, Satisfactory, Unsatisfactory. No rating data
available for TON and DRP.
Human use - Ecological health
recreation
E. coli Clarity Turbidity TN TON Amm-N DRP TP DO pH Temp Temp
Site n/100ml m NTU g/m3 g/m3 g/m3 g/m3 g/m3 %sat °C* °C**
S.H. 25 105 3.21 1.04 0.59 0.46 0.005 0.004 0.011 102 7 16 16
Queens 70 3.22 1.10 1.23 0.95 0.051 0.002 0.0095 101 7.1 15.9 15.9
Head
Karanga 52 3.02 1.25 0.57 0.40 0.017 0.002 0.009 100 7 13.6 13.6
hake
Waiteka 80 3.31 0.76 0.23 0.11 0.005 0.002 0.006 100 7.1 15.4 15.4
uri
Source: Data from LAWA (Downloaded 7th June 2019; 5-year median) or Tulagi 2018 (median values for 2017
data). TN = total nitrogen, TON = Total Oxidised Nitrogen, Amm-N = Ammoniacal Nitrogen, DRP = Dissolved
Reactive Phosphorus, TP = Total Phosphorus, DO = Dissolved Oxygen, Temp = Water Temperature. * rating
against fish spawning temperature requirements; ** rating against fish health temperature requirements.
For most water quality variables in Table 5, the Ohinemuri River system can regulate contaminants to
a satisfactory or excellent rating for human and ecological health. The two notable exceptions where
catchment pressures are exceeding the regulatory capacity of the main stem of the Ohinemuri
catchment are TN concentrations, which are at unsatisfactory levels at the three monitoring sites along
the main stem of the river, along with temperature requirements for fish spawning. With regard to
heavy metals, Oceania Gold NZ Ltd monitor their treated water discharge for heavy metals as part of
their resource consent requirements. Results indicate heavy metal concentrations are below
compliance limits based on USEPA criteria (Boffa Miskell Limited, 2018). However, some heavy
metals tend to accumulate in sediment. Sediment samples from the Ohinemuri and Waitekauri Rivers
indicate concentrations of zinc and copper below toxicant default guideline values (DGV) with lead
exceeding DGV in some sections of the Ohinemuri River (Australian & New Zealand guidelines for
fresh & marine water quality, 2018; Sabti et al., 2000).
Group: Mediation of nuisances of anthropogenic origin
Class Code: 2.1.2.1 (smell reduction)
While the river system will be providing an ES in reducing smell and the impact of odours on people,
no quantitative information was available on this. At certain times of the year, there are sections of the
river system that are unable to reduce the smell and taste of river water to an acceptable level for
water supply (See Class Code 4.2.1.1 under Provisioning Services).
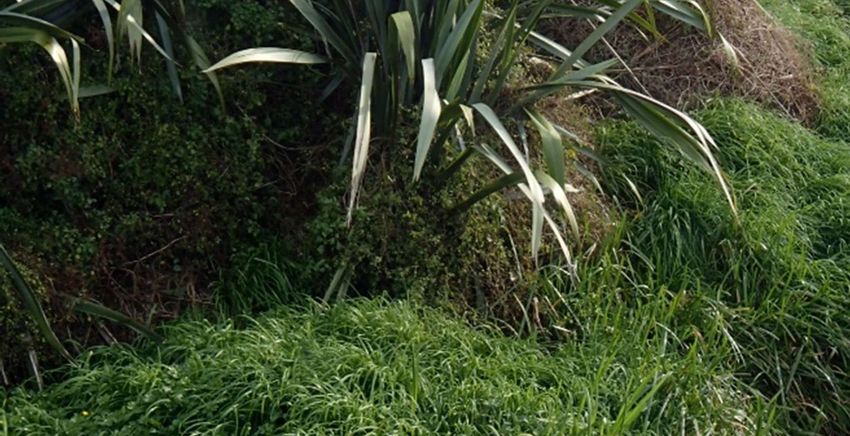
Class Code: 2.1.2.2, 2.1.2.3 (noise attenuation and visual screening)
There is a vegetated riparian margin along most of the length of the Ohinemuri River, supplemented
by indigenous restoration plantings, particularly along the mid-section of the river (Figure 10) and the
Waitete and Mangatoetoe streams (pers. comm. HELP (Habitat Enhancement and Landcare
4https://www.niwa.co.nz/our-science/freshwater/tools/kaitiaki_tools/impacts/chemical-contaminates
5https://www.waikatoregion.govt.nz/environment/natural-resources/water/rivers/healthyrivers/how-we-
measure-quality/
23You can also read