Social Protection and Disability in India - Lorraine Wapling, Rasmus Schjoedt and Daisy Sibun - Development ...
←
→
Page content transcription
If your browser does not render page correctly, please read the page content below
Social Protection and
Disability in India
Lorraine Wapling, Rasmus Schjoedt and Daisy Sibun
                                        Working Paper: February 2021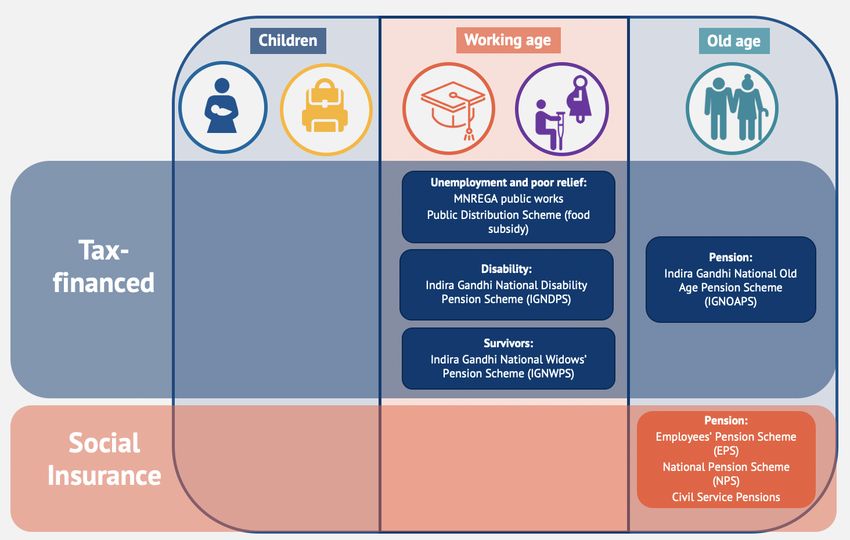
Development Pathways Limited

First Floor

Marlesfield House

114-116 Main Road

Sidcup

DA14 6NG

United Kingdom

Tel. +44 (0) 20 4526 6267

Email: admin@developmentpathways.co.uk

http://www.developmentpathways.co.uk

Twitter: @DevPathways

This working paper has been funded by UK aid from the UK
government; however the views expressed do not necessarily
reflect the UK government’s official policies. It has not been
peer-reviewed or quality-assured by DFID.

                                                                 i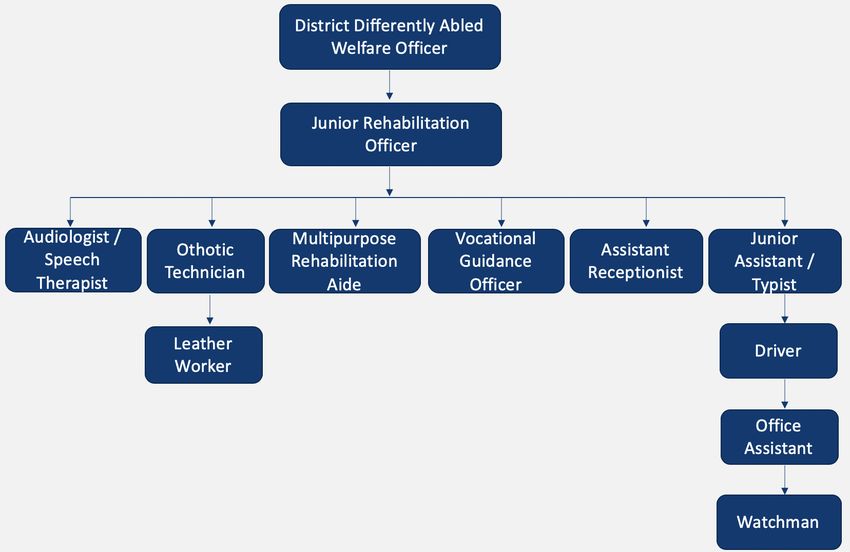
Acknowledgements

Acknowledgements
The authors are grateful for assistance in organising the field research in Tamil Nadu from
Meenakshi Balasubramanian, Sudha and Amba Salelkar from the Equals Centre for
Promotion of Social Justice in Chennai. In Andhra Pradesh, we are grateful for the support
provided by Raj Kumar from Leonard Cheshire Disability and Development Programmes in
Ongole. In addition, we are grateful to everyone who took time to speak with us during
interviews and focus group discussions.

                                                                                         ii
Table of contents

Table of Contents
Acknowledgements........................................................................................................................ ii

Table of Contents .......................................................................................................................... iii

Acronyms......................................................................................................................................... 1

Executive summary ........................................................................................................................ 2

1      Introduction ............................................................................................................................ 5

2      Contextual analysis ............................................................................................................... 7

3      Situation of persons with disabilities .................................................................................. 9

    3.1        Children with disabilities .......................................................................................................... 12

       3.1.1       Young children ........................................................................................................................................ 13

       3.1.2       School-aged children ............................................................................................................................ 13

    3.2        Persons of working age with disabilities ............................................................................ 15

    3.3        Older persons with disabilities ............................................................................................... 17

4      Governance arrangements .................................................................................................. 18

    4.1        Governance of social protection ............................................................................................ 18

    4.2        Governance of disability issues .............................................................................................. 18

    4.3        Civil society .................................................................................................................................... 21

5      Political economy ................................................................................................................ 22

6      Legislation and policies ...................................................................................................... 25

    6.1        Social protection legislation and policies .......................................................................... 25

    6.2        Disability legislation and policies.......................................................................................... 25

       6.2.1       Rights of Persons with Disabilities Act ........................................................................................... 25

       6.2.2       Other relevant disability legislation ................................................................................................ 26

       6.2.3       National Policy for Persons with Disabilities ............................................................................... 27

       6.2.4       Disability policy and legislation at the state level ..................................................................... 27

7      National social protection system ..................................................................................... 28
                                                                                                                                iii
Table of contents

    7.1         Contributory programmes......................................................................................................... 29

        7.1.1       The Employees’ Provident Fund Organisation (EFPO) .............................................................. 30

        7.1.2       The National Pension Scheme (NPS) ............................................................................................... 31

        7.1.3       Government and public enterprise schemes ................................................................................ 31

        7.1.4       Other social insurance programmes ................................................................................................ 31

    7.2         Tax-financed programmes ....................................................................................................... 32

        7.2.1       National Social Assistance Programme (NSAP) ........................................................................... 32

        7.2.2       Mahatma Gandhi National Rural Employment Guarantee Act (MGNREGA) ...................... 36

        7.2.3       Public Distribution System .................................................................................................................. 36

    7.3         State-level tax-financed programmes in Tamil Nadu and Andhra Pradesh ........... 37

        7.3.1       Tamil Nadu................................................................................................................................................ 38

        7.3.2       Andhra Pradesh ....................................................................................................................................... 40

8       Disability assessment mechanisms .................................................................................... 45

9       Access of persons with disabilities to social protection schemes .................................. 48

    9.1         Access to tax-financed pensions ............................................................................................ 49

    9.2         Access to the Mahatma Gandhi National Rural Employment Guarantee Act
    (MGNREGA)................................................................................................................................................... 50

        9.2.1       Access to MGNREGA in Tamil Nadu (Tiruvallur District) .......................................................... 54

        9.2.2       Access to MGNREGA in Andhra Pradesh (Prakasam District) .................................................. 57

        9.2.3       Access to MGNREGA in Tamil Nadu and Andhra Pradesh........................................................ 58

10          Barriers to accessing social protection for persons with disabilities......................... 60

    10.1        Barriers to accessing disability ID certificates .................................................................. 60

    10.2        Lack of information and awareness ...................................................................................... 63

    10.3        Barriers related to targeting or rationing mechanisms.................................................. 63

    10.4        Barriers related to registration ............................................................................................... 64

    10.5        Barriers related to work requirements ................................................................................. 64

    10.6        Barriers to accessing social accountability mechanisms............................................... 65

                                                                                                                                                                             iv
Table of contents
11 Adequacy of schemes ...................................................................................................... 66
11.1 Transfer values of tax-financed pensions ........................................................................... 66
11.2 Transfer values under MGNREGA ........................................................................................... 70
11.2.1 Transfer values under MGNREGA in Tamil Nadu ................................................................... 70
11.2.2 Transfer values under MGNREGA in Andhra Pradesh ........................................................... 71
12 Impact of social protection schemes on persons with disabilities ............................. 73
12.1 Impact of disability benefits and the old age pension................................................... 73
12.2 Impact of MGNREGA ................................................................................................................... 74
13 Linkages with other social services ............................................................................... 76
14 Conclusion ........................................................................................................................ 77
Bibliography ................................................................................................................................. 80
Annex 1 ist of interviews ....................................................................................................... 85
vAcronyms
Acronyms
AP Andhra Pradesh
AAY Antyodaya Anna Yojana Scheme
BPL Below Poverty Line
BJP Bharatiya Janata Party
CSS Centrally Supported Schemes
DAPP Differently Abled Person Pension
DBT Direct Benefit Transfer Programme
dBHL decibels of hearing loss
DFID Department For International Development
DPO Disabled People’s Organisation
EFPO Employees’ Provident Fund Organisation
ICT information and communications technology
ICF International Classification of Functioning, Disability and Health
IGNDPS Indira Gandhi National Disability Pension Scheme
IGNOAPS Indira Gandhi National Old Age Pension Scheme
IGNWPS Indira Gandhi National Widow Pension Scheme
IHDS-II India Human Development Survey II (2011/12)
ICDS Integrated Child Development Scheme
JAM Jan Dhan-Aadhaar-Mobile
LIFE Livelihood Full Employment Program
MGNREGA Mahatma Gandhi National Rural Employment Guarantee Act
MGNREGS Mahatma Gandhi National Rural Employment Guarantee Scheme
MO Medical Officers
NGO Non-Governmental Organisation
NSAP National Social Assistance Programme
PDS Public Distribution System
PMJDY Pradhan Mantri Jan Dhan Yojana
SADAREM Software for Assessment of Disabled for Access, Rehabilitation and
Empowerment
SECC Socio-Economic Caste Census
TN Tamil Nadu
1Executive summary
Executive summary
This case study forms part of the DFID-funded research project “Leaving No One Behind —
how social protection can help persons with disabilities to move out of poverty,” which
aims to provide guidance for social protection practitioners on how to ensure access to
social protection for persons with disabilities.
The study is based on a review of the literature on access to social protection for persons
with disabilities in India; quantitative analysis of both administrative data and India’s
Human Development Survey II (2011/12); and, limited qualitative field research in Tamil
Nadu (TN) and Andhra Pradesh (AP) conducted 17-27 October 2016. In total, the field
research comprised 23 key informant interviews and focus group discussions with
Disabled People’s Organisations (DPOs), Non-Governmental Organisations (NGOs) and
government officials in three locations: in Chennai, the capital of Tamil Nadu, in the
district of Tiruvallur; in Tamil Nadu; and in the district of Prakasam in Andhra Pradesh,
about 300 kilometres north of Chennai. The states of Tamil Nadu and Andhra Pradesh
were selected for this case study based on an expectation that these two states would be
performing above average in the area of social policy.
India has an extremely complex social protection system, characterised by a large number
of small, fragmented and largely ineffective schemes. This study focuses on disability
pensions as well as the inclusion of persons with disabilities in the large cash-for-work
programme, the Mahatma Gandhi National Rural Employment Guarantee Scheme
(MGNREGA), which is one of the few social protection programmes in India with relatively
high coverage and a substantial benefit level. While the study finds that India’s disability
benefits are not very effective in offering income security or covering the additional costs
for persons with disabilities, efforts in both states to include persons with disabilities in
MGNREGA offer interesting lessons, although results have been mixed and uneven.
India’s National Social Assistance Programme (NSAP) includes five different schemes: The
Indira Gandhi National Old Age Pension Scheme (IGNOAPS); the Indira Gandhi National
Widow Pension Scheme (IGNWPS); the Indira Gandhi National Disability Pension Scheme
(IGNDPS); the National Family Benefit Scheme (NFBS); and the Annapurna Scheme. All of
the NSAP schemes are poverty targeted using the Below Poverty Line (BPL) targeting
mechanism and have limited coverage and high exclusion and inclusion errors.
Based on analysis of the India Human Development Survey II (IHDS-II) 2011/2012,
persons with disabilities are five times more likely than those without disabilities to be
receiving a social protection benefit. According to the IHDS-II, in 2011/12, 23 per cent of
people with severe functional limitations were direct recipients of social protection
transfers, while 33 per cent were living in households benefiting from one or more
2Executive summary
programmes. This is significantly higher than for persons with no disability, among whom
only four per cent are direct recipients of a programme, while 17 per cent live in a
household where at least one member is receiving a benefit.
The higher coverage of persons with disabilities is mainly because of the old age pension,
as there is a high prevalence of disability among older people. In addition, the coverage of
the old age pension has increased significantly over the last decade and now reaches 18-
20 per cent of the population aged 60 and above. The national disability benefit has much
lower coverage, with only five per cent of adults above age 18 with a severe disability
receiving the benefit. Therefore, the old age pension is the most significant tax-financed
social protection programme for persons with disabilities in India, in terms of coverage.
However, it is important to note that most persons with disabilities in India are still left
without access to social protection. The IHDS-II data shows that, even among the 20 per
cent poorest older people with severe disabilities, 63 per cent are excluded from the old
age pension.
Low coverage means that the impact on poverty levels in the general population of the
NSAP programmes is limited. However, the programmes have a significant impact for
those fortunate enough to be included as recipients: the national disability benefit is
estimated to reduce poverty among recipient households by 12 per cent.
The MGNREGA provides a right to at least 100 days of guaranteed wage employment per
year to any rural household with an able-bodied member who puts her/himself forward
for unskilled manual work. In 2013, the MGNREGA guidelines were updated and, most
significantly, a section on “strategies for vulnerable groups”, including persons with
disabilities, was added. Each state was given a mandate to develop its own plans for how
vulnerable people would be included. Both Tamil Nadu and Andhra Pradesh have
developed quite comprehensive systems to ensure that persons with disabilities are
included in MGNREGA, and there is awareness and some level of commitment towards
inclusion at all levels. However, the practical implementation of the guidelines is still
largely dependent on interpretation and the attitude of officials, resulting in very different
experiences for persons with disabilities living in different states and districts.
Initiatives to improve the inclusion of persons with disabilities in the MGNREGA in the
two states include the provision of work suitable for the capabilities of persons with
disabilities; the provision an individual job card for persons with disabilities (rather than
sharing one job card with the rest of the household); and, allocating 150 days of work for
persons with disabilities, rather than the usual 100 days. Despite these initiatives, the
percentage of workers under MGNREGA with disabilities has not increased much between
2009/10 and 2015/16 and the number is still much lower than the three per cent quota
for public sector jobs, which is supposed to be reserved for persons with disabilities by
3Executive summary
law (recently increased to five per cent with the new Rights of Persons with Disabilities
Act, 2016). Nonetheless, India does provide some lessons on how public works
programmes can be adapted to allow for the inclusion of persons with disabilities.
41 Introduction
1 Introduction
This report comprises one component of the DFID-financed study: “Leaving no-one
behind: how social protection can help persons with disabilities move out of extreme
poverty.” It is one of seven country case studies to identify good practice in enabling the
inclusion of persons with disability in social protection systems and programmes. The
research aims to address the gaps in knowledge in the design and delivery of social
protection for persons with disabilities and find examples of good practice that can be
used to improve policies and programmes so that social protection in developing
countries can become more disability sensitive. The project was undertaken by Lorraine
Wapling and Rasmus Schjoedt for Development Pathways.
The study is based on a review of the literature on access to social protection of persons
with disabilities in India; quantitative analysis of administrative data and India’s Human
Development Survey II (2011/12); and, limited qualitative field research in Tamil Nadu
and Andhra Pradesh from 17-27 October 2016. In total, the team carried out 23 key
informant interviews and focus group discussions with Disabled People’s Organisations
(DPOs), Non-Governmental Organisations (NGOs) and government officials in Chennai, in
the district of Tiruvallur outside Chennai, as well as in the district of Prakasam in Andhra
Pradesh, about 300 kilometres north of Chennai.
This case study focuses on analysing the effectiveness of schemes in including and
improving the lives of persons with disabilities. It predominantly evaluates the Indira
Gandhi National Disability Pension Scheme (IGNDPS), as well as the inclusion of persons
with disabilities in the large cash-for-work programme, the Mahatma Gandhi National
Rural Employment Guarantee Scheme (MGNREGA). It also considers additional schemes
for persons with disabilities implemented by state governments, including two separate
disability benefit schemes implemented by the Tamil Nadu State Government.
The study focuses on the states of Tamil Nadu and Andhra Pradesh, based on an
expectation that these two states would be performing above average in the area of
social protection.1 While India’s disability benefits do not offer many lessons for other
countries, efforts in both states to include persons with disabilities in the public works
programme, MGNREGA, offer interesting lessons.
The researchers would like to stress that as the research was carried out in 2016, the
report is reflective of India’s social protection systems and programmes at that time. Since
1
This expectation is based on the above average human development and gender outcomes, higher wages and state
coverage of MNREGA in these two states.
51 Introduction
2016, India has experienced political change and some aspects of the report may now be
outdated or will have changed.
The report begins in Section 2 with an introduction to the social and economic context of
India. Section 3 then examines the situation of persons with disabilities in India across
the lifecycle. Section 4 outlines the administrative structure that governs social protection
and disability issues in India, followed by Section 5, which briefly evaluates the political
economy context in which these governance structures operate. Section 6 then describes
the legislative and policy framework of social protection and disability in India. In Section
7, the report provides a detailed overview of the national social protection system,
looking at both contributory and tax-financed schemes in India. Section 8 outlines details
of India’s disability assessment process. Sections 9 and 10 analyse the access of persons
with disabilities to social protection programmes in India. Section 11 considers the
adequacy of the benefits provided under these schemes. Section 12 assesses the impact
of social protection schemes on persons with disabilities, while Section 13 considers the
linkages between social protection and social services for persons with disabilities.
Finally, Section 14 concludes with some perspectives on the main lessons learned and
gaps identified in relation to social protection for persons with disabilities in India.
The team would like to thank all those who gave of their time to be interviewed and who
supported the organisation of meetings and discussions.
Box 1-1 The India Human Development Survey (IHDS)
Analysis in the report uses the India Human Development Survey II (2011/2012), the second wave of a
nationally representative panel survey. It includes social and economic indicators, as well as other human
development indicators. The IHDS-II has a sample size of 42,152 individuals across all 33 states and union
territories in India. Rather than using the Washington Group questions to identify persons with disabilities,
the IHDS-II includes seven questions related to activities of daily living, covering five functional domains
(seeing, walking, hearing, communicating and self-care). Throughout the report, whenever analysis refers
to people with moderate or severe disability in the IHDS, this means everyone coded with “can do with
difficulty” in at least one functional domain. People with severe disability are those coded as “unable to do
it” in at least one functional domain.
62 Contextual analysis
2 Contextual analysis
India is a lower-middle income country composed of 28 states and eight union territories.
The latest census, undertaken in 2011, reported that India had a population of roughly 1.2
billion people. However, according to the latest population projection data from the
United Nations Department of Economic and Social Affairs (UN DESA), this would have
risen to over 1.3 billion in 2016. By 2050, UN DESA predicts that India will have a
population of about 1.6 billion people. India has a young population, with 30 per cent of
the population under the age of 14, and 63 per cent of the population aged 15-59 years,
according to the 2011 Census.
At the time of writing in 2016, India’s economy had returned to high rates of growth after
a period of slowed growth, according to the latest figures, although there is some dispute
over whether this data is credible: In 2015-16, the GDP growth rate reached 7.6 per cent,
up from 5.6 per cent in 2012-13.
Calculating how many people are “poor” in India is a highly contested issue. As of the
time of writing in 2016, the latest poverty line was calculated by the Tendulkar
Committee based on a poverty line basket, which calculates the cost of a basic set of
goods and services required for a minimal acceptable standard of living. Using this line,
the basis of which was consumption data from the National Sample Survey, an estimated
270 million people were living in poverty in India in 2011-12.2 However, this poverty line
was highly criticised as being too low, and a new committee was established to propose
changes. The revised methodology resulted in a higher number, some 363 million people,
living in poverty.3
According to the 2011 census data, the poverty headcount ratio, using the poverty line of
USD 1.90 per day, was 21 per cent. Yet, using the USD 3.10 line, which is widely
recognised as a more reasonable measure of poverty, it rises to 58 per cent.4
The majority of the population live in rural areas: only ten per cent of the rural
populations have salaried jobs and only five per cent earn enough to pay taxes. Thirty-six
per cent of the rural population is illiterate. Poverty is higher in rural areas than in urban
areas, and is highest among minority groups categorised as “scheduled tribes”.5 Overall,
2
Tendulkar (2009).
3
Rangarajan (2014).
4
World Bank poverty and equity data portal.
5
World Bank (2016).
72 Contextual analysis
only three per cent of the population belongs to the middle class, defined as those living
on $US 10-20 per day.
The vast majority of workers in India — 92 per cent — are employed in the informal sector
(when including both those who are working in the unorganised sector and those who are
informally employed in the organised sector). Since only those employed in the formal
sector are eligible for social insurance, only a maximum of eight per cent of workers have
access to social insurance. The social insurance system does not provide coverage for the
vast majority of the population.
There are notable gender disparities in labour force participation rates. Notably, the
participation rate of women dropped from 42.7 per cent in 2004-05 to 31.1 per cent in
2013-14. Research has suggested that the reason for the declining rate of participation
may result from an “income effect”: as families raise their income levels and achieve more
stable incomes, women drop out of the labour force, or do not enter, because the family is
able to get by on the husband’s income.6 Further, the average wage for women is much
lower than for men.7
6
Luis et al (2017).
7
ILO (2016).
83 Situation of persons with disabilities
3 Situation of persons with disabilities
India’s most recent census from 2011 reported that there were 26.8 million persons with
disabilities in India in 2011, representing roughly two per cent of the population. This
prevalence rate, however, is very low (especially in comparison to the estimated global
rate of 15 per cent suggested by the World Bank/WHO) and is most likely the result of
particularities in the way the census question was structured and enumerated.8 In fact,
prevalence rates vary according to different surveys. For example:
• A survey in Prakasam District in Andhra Pradesh (the same district visited for this
case study) by researchers from the South Asia Centre for Disability Inclusive
Development Research, using a Rapid Assessment of Disability (RAD) tool, found a
disability rate among adults of 10.4 per cent (N = 4,134).9
• A survey carried out by the DPO Federation in Tamil Nadu’s Tiruvallur District
(also visited for this case study) estimated that there were 98,000 persons with
disabilities in the district, out of a total population of 3.7 million, making the
prevalence rate 2.63 per cent — again, very low in an international comparison.
• According to the 2002 National Sample Survey, 8.4 per cent of rural households
(and 6.1 per cent of urban households) reported having a member with a
disability.10
• Analysis of the IDHS-II dataset from 2011-12 by Development Pathways found a
disability (moderate and severe) prevalence rate of 6.4 per cent, and a severe
disability prevalence rate of 2.3 per cent, in the population aged 8 and above. The
data also show that 21.8 per cent of households have at least one person with a
moderate or severe disability, and 8.4 per cent of households have at least one
person with a severe disability.
The census data are derived from a simple “yes” or “no” response to the question: “Is this
person mentally/physically disabled?”. A “yes” response requires the respondent to
indicate which disability they (or any member of their household) have from a list of eight
possible responses: in seeing; in hearing; in speech; in movement; mental retardation;
mental illness; any other; or multiple disability (of which up to three options can be
recorded).
This data collection method poses a number of problems and, as noted by the Washington
Group on Disability Statistics, this particular method generates the lowest prevalence
8
WHO and World Bank (2011).
9
Ramachandra et al (2016).
10
World Bank (2007); Focus group discussion, Enicapadu Village, Prakasam District, AP, 25th October 2016.
93 Situation of persons with disabilities
rates because of inconsistency in people’s interpretations as to what constitutes a
disability and due to the stigma of revealing disability within households and
communities. This type of question is also unlikely to pick up disability within the elderly
population since many will assume that their impairments are simply the result of age,
and no provision is made for identifying chronic health conditions which might also
impact on daily activities.11
A comparison of the relative prevalence rates of different impairments reported over time
highlights the potential questions around the accuracy of this data. In 2001, census data
reeal that 49 per cent of all persons with disabilities had visual impairments compared
with only 19 per cent in 2011 (Figure 3-1). It is unlikely that the prevalence of visual
impairments declined so significantly in just ten years, suggesting instead that changes in
the way disability was measured between these two censuses offered different results.
Further, in 2001 — unlike in 2011 — no provision was made for the categories of “mental
illness”, “multiple”, or “other” which will have inevitably altered the overall distribution
rates.
Figure 3-1 Comparison of impairment prevalence between the 2001 and 2011 censuses
Percentage of persons with disabilities
0% 10% 20% 30% 40% 50%
Seeing
Hearing
Speech
Movement
Mental Retardation
Mental illness
Other
Multiple
2001 2011
Source: Census India, 2001 & 2011
Using the 2011 census data, it is estimated that there are more disabled men than women
among the general population (56 per cent men; 44 per cent women). This is also
11
World Bank (2007).
103 Situation of persons with disabilities
reflected in the data from Tamil Nadu (56 per cent men; 44 per cent women) and Andhra
Pradesh (54 per cent men; 46 per cent women). However, this discrepancy is likely
because there are more men than women in the population, as analysis of the IDHS-II
data shows a higher prevalence rate among women (7.2 per cent) than men (5.6 per cent).
According to the 2011 census, in Tamil Nadu there are a total of 1.2 million persons with
disabilities (1.6 per cent of the state population) and in Andhra Pradesh 2.3 million (2.7
per cent of the state population, before bifurcation).12
There are very few variations in impairment prevalence rates between Tamil Nadu and
Andhra Pradesh (and between these states and the national rates). Andhra Pradesh
records only slightly higher rates of “seeing” impairments (AP, 17 per cent; TN, 11 per
cent) and slightly lower rates of “hearing” impairment (AP, 15 per cent; TN, 19 per cent).13
Both states record relatively high rates for the category of “other” (AP, 18 per cent; TN, 20
per cent). Unfortunately, there is no clear definition of what the category “other” is being
used to describe. According to the 2011 census instruction manual, this category should
be used “…if the person has a disability not covered under any of the categories listed in
the question.”
12
Census India, 2011. Note: the statistics in this section describe Andhra Pradesh before it was bifurcated into two states in
2014 and use the 2011 census data.
13
Using the 2011 census. SADAREM AP data shows much greater variations in prevalence rates. For example, significantly
higher rates of locomotor impairments (at 57%), lower rates of multiple impairments (at 1%) and it does not record the
category “other” at all.
113 Situation of persons with disabilities
Figure 3-2: Comparison of impairment rates across categories for all-India, Tamil Nadu
and Andhra Pradesh
30%
25%
20%
15%
10%
5%
0%
Seeing Hearing Speech Movement Mental Mental Other Multiple
retardation illness
India Tamil Nadu Andhra Pradesh
Source: Census India, 2011
3.1 Children with disabilities
India has a young population, with around 41 per cent of the population aged 0-19
years.14 While disability prevalence rates are lower among children than other age groups
in India, because of the age structure of the population, the absolute number of children
with disabilities is higher than for other age groups. There are at least 7.8 million children
with disabilities in India according to the 2011 census, which gives a minimum child
disability prevalence rate of around 1.6 per cent, although this is likely to be much higher
in reality. However, the IHDS-II only provides data for individuals aged 8 and above, so it
is not possible to provide accurate information on disability prevalence among young
children.
The situation for children with disabilities can be especially difficult. Families are likely
be overprotective and reinforce a sense of dependence when caring for a child with a
disability, which can make it difficult for children to develop the skills needed for self-
determination and individuality.15
14
Census India, 2011.
15
Gupta et al (2013).
123 Situation of persons with disabilities
3.1.1 Young children
The Integrated Child Development Scheme (ICDS) is the main national scheme for early
childhood care and development, providing rural childcare centres called Anganwadi
centres. The ICDS has 1.4 million Anganwadi centres and two million Anganwadi workers,
providing services of immunisation, health check-ups, referral services, pre-school non-
formal education and supplementary nutrition provision. It is seen as the government’s
major scheme to fight childhood malnutrition. The ICDS reaches around 86 million
children and their mothers through supplementary nutritional support and 33 million
children with pre-school education.16 However, there are no data on the extent to which
children with disabilities are benefiting from these services. 17
3.1.2 School-aged children
The educational performance of children with disabilities remains below that of non-
disabled children. Children with disabilities are more than five times more likely to be out
of school than their non-disabled peers.18 As shown in Figure 3-3, literacy levels in both
Tamil Nadu and Andhra Pradesh remain below those of the general population of India,
with the widest gap in Andhra Pradesh.
16
Section 6C.3.2, Pg. 135, Point No. 100, 3rd and 4th State CRC Report.
17
Gupta et al (2013).
18
World Bank (2007).
133 Situation of persons with disabilities
Figure 3-3 Comparison of literacy rates of persons with disabilities in Tamil Nadu and
Andhra Pradesh, compared with literacy rates of the general population in India
70%
60% 63%
61%
50%
48%
Literacy rate
40%
30%
20%
10%
0%
General national population Persons with disabilities in Persons with disabilities in
Tamil Nadu Andhra Pradesh
Source: Census India, 2011
Most children with disabilities do not continue in education, where 95 per cent drop out
after primary school. Some of the main barriers include a lack of accessible teaching and
learning materials, environmental access issues, and the poor quality of specialist
teaching support. Overall, the amount of spending on persons with disabilities in
education by the Ministry of Human Resource Development did not exceed 2.3 per cent
between 2007 and 2012, even though the Equal Opportunities, Protection of Rights and
Full Participation Act (1995) lays out that the Ministry should be spending at least three
per cent of their budget on disability-related programmes.19 As Figure 3-4 shows, children
aged 12-17 without disabilities are much more likely to be currently attending school
than those with disabilities, including children with severe or moderate disabilities. Yet,
for both children with and without disabilities there is a clear trend of children from
higher-income families having much higher school attendance rates than those from low-
income families.
19
Gupta et al (2013).
143 Situation of persons with disabilities
Figure 3-4: Percentage of children (aged 12-17) with and without disabilities attending
school, across the income distribution
100
90
Percentage of children (aged 12-17)
80
70
60
50
40
30
20
10
0
Poorest 2nd quintile 3rd quintile 4th quintile Richest
All without disabilities with moderate and severe disability with severe disabilities
Source: Analysis of IHDS-II by Development Pathways
3.2 Persons of working age with disabilities
Persons with disabilities are much more likely to be without work. Nationally, 64 per cent
of people of working age with disabilities are classified as outside the labour force
compared to 56 per cent of working age persons among the general national population
(including both persons with and without disabilities). 20 Persons with disabilities are
similarly more likely to be without work in both Tamil Nadu and Andhra Pradesh than the
national average, where 63 per cent and 61 per cent of working-age persons with
disabilities are classified as outside the labour force in the 2011 census, respectively.
There has been little improvement in the labour force participation of persons with
disabilities since the 2001 census, in which 65 per cent of working age persons with
disabilities were classified as outside of the labour force nationally. This suggests that
provisions made within the Persons with Disabilities Act (1995) have not made any
significant impact.21
20
Census India (2011).
21
op. cit.
153 Situation of persons with disabilities
As Figure 3-5 shows, the IHDS shows broadly similar findings to the census data. Further,
it also illustrates that labour force participation rate is lower in rural areas than in urban
areas, across all categories of disability status.
Figure 3-5: Labour force participation rates, by disability status and urban-rural
classification
70
Labour participation rate (persons aged
60
50
40
15+)
30
20
10
0
All Without Disability grant With modest With severe
disability beneficiary and severe disability
disability
National Urban Rural
Source: Analysis of IHDS-II by Development Pathways
Focus group discussions in both Tamil Nadu and Andhra Pradesh affirmed that most
persons with disabilities find it very difficult to access the formal labour market. This is
likely the result of multiple intersecting barriers such as low levels of education, lack of
accessible transport and a lack of accommodation within the workplace. Some persons
with disabilities report being able to earn some income via the informal sector in
activities such as garland making, making/selling snacks, day labouring, tailoring and
selling mobile phone cards.22 In only one case did informants report not having any
income opportunities.23 This work, however, can be seasonal (such as work on salt pans
and in agriculture) offering little income security.24
Disabled women face particular challenges in accessing the labour market. Within
families, women and girls tend to be the least prioritised in terms of education, which
means they often have fewer options in terms of work. The Government’s quota system
22
Focus group discussions: Punnapakkam village, TN ,17th October 2016; Trivuvallur District, TN, 18th October 2016.
23
Focus group discussion, R.K. Pet Block, Trivuvallur District, TN, 18th October 2016.
24
Focus group discussion, Chinnaganjam village, AP, 24th October 2016.
163 Situation of persons with disabilities
(Box 3-1) has a tendency to prioritise men with disabilities. Further, offices are often
poorly equipped (i.e. a lack of toilets and running water) to support the needs of women.
Women with disabilities will often lack information about the opportunities that are
available to them and may prefer to take up self-employment. However, even self-
employment is not straightforward. Securing loans to start a business can be challenging
and, even if the loan is secured, families may still refuse to offer guarantees because of
attitudes which assume low capabilities of women with disabilities.25
Box 3-1: The Government’s quota system
The Government implements a quota system to promote the representation of persons with disabilities in
public office. The Rights of Persons with Disabilities Act (2016) increased the public sector quota from
three per cent to four per cent for persons with certain types of disabilities and provides incentives for
companies to ensure that a minimum of five per cent of their workforce is composed of persons with
disabilities of 40 per cent or more.
Overall, despite an increase in attention to disability at the policy level, persons with
disabilities have been largely left out of most economic reforms the country has
undergone.26 While there have been some gains in employment and physical accessibility
for some persons with disabilities, the majority of the poor, rural disabled population
remains excluded from India’s economic, social and political developments.27
3.3 Older persons with disabilities
Disability is most prevalent among older persons. Almost one third (31 per cent) of
persons aged 60 years and above experience a disability, while this rises to almost one
half (46 per cent) of all persons aged 75 years and above.28 Traditionally, older persons
have been supported by their families. Yet, this traditional support system has eroded in
recent years. More than half of elderly males (60+ years) in India do not receive any
financial support from their next of kin. In 2011, 53 per cent of elderly men in rural areas
and 57 per cent in urban areas were without any financial support from next of kin.
Women, on the other hand, tend to receive far greater support in old age, with only 15 per
cent of elderly women (60+ years) in rural areas and 18 per cent in urban areas without
financial support from next of kin, respectively.29
25
Focus group discussion, Tamil Nadu Association of Disabled Women, 22nd October 2016.
26
Hiranandani and Sonpal (n.d)
27
Ibid
28
IDHS-II (2011)
29
Prasad (2011).
174 Governance arrangements
4 Governance arrangements
This section will outline the administrative structure that governs social protection and
disability issues in India.
The administration is layered across the Central Union Government, the state
governments, districts, blocks (also sometimes referred to as sub-districts or by state-
specific terms, including “Mandal” in Andhra Pradesh and “Taluk” in Tamil Nadu) and
villages (Gram Panchayats).
The Indian system of governance is decentralised to the state governments which, as
noted, often administer social protection programmes of their own. At the state level,
institutional arrangements differ widely. For example, Tamil Nadu has 41 different
departments in the state government, while Andhra Pradesh has only 28. Below the state
governments are devolved administrative units at the district, block and village level.
Then, at the village level, there are local authorities with elected village councils headed
by Panchayat Presidents.
4.1 Governance of social protection
At the Union Government level, both the NSAP and the MGNREGA are administered by the
Ministry of Rural Development which transfers funds to the state governments.
The relevant state government department varies by state. In both Tamil Nadu and
Andhra Pradesh, MGNREGA is managed by the Departments for Rural Development (the
Rural Development and Panchayat Raj Department in Tamil Nadu and the Department of
Rural Development in Andhra Pradesh). These are represented at the district level by
District Rural Development Offices, which are among the largest devolved departments.
They also have representatives at the block level. The NSAP is in most states
implemented by Social Welfare Departments. However, in some states, including in
Andhra Pradesh, the programme is implemented by Rural Development Departments. In a
few other states, including In Tamil Nadu, the NSAP is implemented by State Revenue
Departments.
4.2 Governance of disability issues
At the Union level, disability issues fall under the Department of Persons with Disabilities
within the Ministry of Social Justice and Empowerment. In addition, the Persons with
Disabilities Act of 1995 mandated the establishment of the Office of the Chief
Commissioner for Persons with Disabilities under the Ministry of Social Justice and
184 Governance arrangements
Empowerment, as well as in each of the state governments. The Office of the Chief
Commissioner is mandated to safeguard the rights of persons with disabilities, including
monitoring the utilisation of funds dispersed by the Central Government and overall
compliance with the Disabilities Act. The Chief Commissioner can investigate potential
issues, either on his own accord or in response to complaints from citizens; the Office has
the power of a civil court.
At the state level, institutional arrangements pertaining to disability issues vary widely. In
Tamil Nadu, the Department for the Welfare of Differently Abled Persons is dedicated to
persons with disabilities but has relatively low capacity, and functions in practice as a
service delivery department rather than a coordinating body working to mainstream
disability issues in other departments and policies. The department manages the
Maintenance Grant disability cash transfer programme. However, logistically, it is not well
equipped to do so effectively.
The Department for the Welfare of Differently Abled Persons does not have any presence
below the District level. Even at the District level, the only presence is a small office
staffed with technical rather than administrative staff. Figure 4-1 shows the staffing and
organogram of the district-level Office for the Welfare of the Differently Abled.30 In the
case of the Tiruvallur district office that provided this information, each box in the
organogram consists of a single employee, with a total of 12 staff in the office —
including the driver and watchman — covering a population of more than one million
people. While it is not clear whether larger districts have more staff, all offices nominally
follow the same structure.
In practice, these offices are rehabilitation centres that have been tasked with the
implementation of a cash transfer programme (the Maintenance Grant), despite having
virtually no administrative staff to manage this role. No additional staff have been
provided to enable the offices to function both as administrative offices and rehabilitation
centres. Despite this, political leaders at the Department for the Welfare of the Differently
Abled have expressed an interest in taking on the administration of the other state-
specific disability benefit in Tamil Nadu, the Differently Abled Person Pension (DAPP). The
DAPP is currently administered by the Social Welfare and Nutritious Meal Programme
Department but with payments administered by the Revenue Department. The State
Revenue Department also manages the three types of pension under the National Social
Assistance Programme.
30
Information on the department structure was verified by the district officer manager in Tiruvallur district.
194 Governance arrangements
Figure 4-1: Organogram for Tamil Nadu District offices of the Department for the Welfare
of Differently Abled Persons
Source: Tamil Nadu State Government website
The Department of Welfare of Differently Abled Persons suffers from a lack of capacity
and weak data management systems that are not set up to administer cash transfer
programmes. Without doubt this affects the ability of the programme to ensure adequate
information dissemination and enrolment into the programme of all eligible persons, as
well as timely payments and monitoring of programme performance.31
Tamil Nadu does have a State Commissioner for Persons with Disabilities. However, this
position is intended to function as an independent monitoring institution. In the case of
Tamil Nadu, the position refers directly to the Minister responsible for the Welfare of the
Differently Abled Persons Department. This has resulted in a situation wherein there is no
independent oversight of disability governance at the state-level.
In Andhra Pradesh, the Department for Women, Children, Disabled and Senior Citizens are
responsible for disability issues, including issuing disability certificates and maintaining
31
KII with Equals, Oct. 20th 2016
204 Governance arrangements
the SADAREM database. The state does not have an independent Commissioner for
persons with disabilities, even though this is a requirement under the Disability Act.
4.3 Civil society
Overall, there is limited engagement between the legislative governance of disability
issues and civil society. Neither the 1995 Disability Act nor the main disability policy —
the 2006 National Policy for Persons with Disabilities — obliges governments to consult
directly with persons with disabilities. Instead, it is largely assumed that disability NGOs
will act as the representatives of persons with disabilities.32 While many disability NGOs
have links with public agencies, these are predominantly related to service delivery and
are less relevant for advocacy and decision-making around policy. According to the World
Bank (2007), there are certain key forums to which select NGOS are invited and, in some
cases, NGOs act as watchdogs. However, “for the most part consultation between the
public and NGO sector on disability policy issues remains under-developed, both at the
centre and in most states”.33 Very few NGOs have had direct influence on disability policy
development. In addition, there is limited interaction between disability NGOs and
DPOs.34
The general picture is the same in Tamil Nadu, where the Department of Welfare of
Differently Abled Persons provide grants to a network of service delivery NGOs which are
somewhat involved in the decision-making process. There is a Welfare Board that
includes representatives from marginalised groups under several departments. Previously,
there was a Welfare Board under the Department of Welfare of Differently Abled Persons
but it is no longer functioning. In practice, there is very little dialogue with DPOs and it
can be difficult for civil society organisations to arrange appointments with the
Commissioner. 35
However, civil society has enjoyed some success in engaging in the governance of
disability issues in India. For example, in Andhra Pradesh, self-help groups for persons
with disabilities have had some success in promoting inclusion and economic
empowerment within communities.36 More generally, the disability NGO movement has
contributed significantly to pushing for more awareness and legislation on disability
issues in India.37
32
World Bank (2007).
33
World Bank (2007).
34
World Bank (2007).
35
KII with Equals, Oct. 20th 2016
36
Kumaran (2011).
37
World Bank (2007).
215 Political economy
5 Political economy
This section will briefly evaluate the political economy context within which the
governance of social protection and disability operates.
The United Progressive Alliance — a coalition of centre-left political parties formed in
2004 which remained in power until losing the 2014 election to the incumbent centre-
right Bharatiya Janata Party (BJP) — made significant progress towards establishing a
rights-based social protection system in India. The Alliance introduced policy and
legislation aiming to protect the right to information (through the Right to Information
Act), the right to work (through establishing MGNREGA) and the right to food security
(through the National Food Security Act).
This push towards entitlements came about as a result of the inclusion of left-wing
parties in the Government and of civil society organisations in the policy making process.
It was part of an effort to improve the relationship between citizens and the state and
enhance the accountability of government officials in their delivery of public services. As
articulated by the prominent rights activist, Nikhil Dey: “Accountability from a citizens’
point of view is inextricably tied to basic entitlements. Who can I hold accountable if I
don’t have entitlement?” This push from civil society was strengthened by the emergence
of more activist courts.38 The civil society-led Right to Information movement dates back
to the mid-1990s and has always been closely tied to the other two “rights” — the right to
work and the right to food.39
However, the Indian civil society organisations on the left have tended to see the
provision of cash as a marketisation of the state’s obligations and remain deeply sceptical
of the Direct Benefit Transfer reforms.40 It is, therefore, not a coincidence that the cash
transfer programmes under the National Social Assistance Programme (NSAP) did not
receive the same attention from the centre-left government. In the same way, the concept
of a universal basic income has been embraced by the current centre-right government,
while the architects of MGNREGA and the NFSA argue that the in-kind transfers of the
Public Distribution System (PDS) should be reformed to make them more effective.41
These activists express concerns that cash transfers will provide the justification for the
Government to roll back existing programmes, providing limited cash transfers at the
38
Aiyar and Walton (2014).
39
Aiyar and Walton (2014).
40
The Direct Benefit Transfer reforms refer to a shift in the payment mechanism of subsidy programmes in 2013 whereby
subsidies began being paid straight into the bank accounts of beneficiaries.
41
Standing (2012). For the current government’s appraisal of a universal basic income, see Chapter 9 of the Economic
Survey 2016-17: http://indiabudget.nic.in/es2016-17/echap09.pdf
225 Political economy
expense of investing in public services or consolidating an effective social protection
system.42
Meanwhile, the recent rights-based legislation has not been successful in improving the
relationship between citizens and the state. Implementation of social protection
programmes remain marred by corruption.43 Tamil Nadu has a reputation for being more
committed to social service provision than most other states. However, even here, the
provision of social protection is characterised by fragmented programmes and a lack of
coherence and coordination between departments in the state government. This is
illustrated, in particular, by the three disability benefit schemes in Tamil Nadu (one
central and two state-specific) that partially overlap in terms of the recipients they reach
and the absence of strategies for social protection and/or disability that could make the
system more coherent and effective.
The political system in Tamil Nadu is also largely reactive in character. As one
interviewee stated, there are many things that the Tamil Nadu state can be persuaded to
do in terms of welfare services, based on pressure from the comparatively strong civil
society organisations. But there is no pro-active attempt by Government to build a
coherent system.44 The inevitable result is a patchwork of hundreds of different ad-hoc
programmes and schemes, most of which very few people access, or are even aware of.
The plethora of different benefits — all with complicated eligibility rules that change on a
regular basis — makes it virtually impossible for potential beneficiaries, civil society
organisations and even the government officials responsible for implementing them to
have a complete overview of the support available.
From the study’s interviews with key informants in Tamil Nadu and Andhra Pradesh, there
seemed to be a tendency for politicians to announce new schemes targeted at particular
groups as a way of attracting votes. This contributes to the multiplication of different
schemes. However, subsequently, little attention is given to actually implementing and
funding the schemes and taking measures to ensure that they are effective in improving
the lives of beneficiaries. As a result, there is an overload of local administrative systems,
insufficient funding to pay for all the different commitments and a lack of monitoring and
evaluation of the impact of the schemes.
There are weak formal accountability structures, both horizontally and vertically. While
the Right to Information Act has made it easier for civil society organisations to gain
42
Dreze (2017).
43
Aiyar and Walton (2014).
44
KII with Equals, Oct. 20 2016
23You can also read