Impacts of the COVID-19 pandemic on EU industries - Free
←
→
Page content transcription
If your browser does not render page correctly, please read the page content below

STUDY
Requested by the ITRE committee

                Impacts of the
              COVID-19 pandemic
               on EU industries

          Policy Department for Economic, Scientific and Quality of Life Policies
                         Directorate-General for Internal Policies
         Authors: Jan Maarten DE VET, Daniel NIGOHOSYAN, Jorge NÚÑEZ FERRER,
              Ann-Kristin GROSS, Silvia KUEHL, and Michael FLICKENSCHILD
                                PE 662.903 - March 2021
                                                                                    EN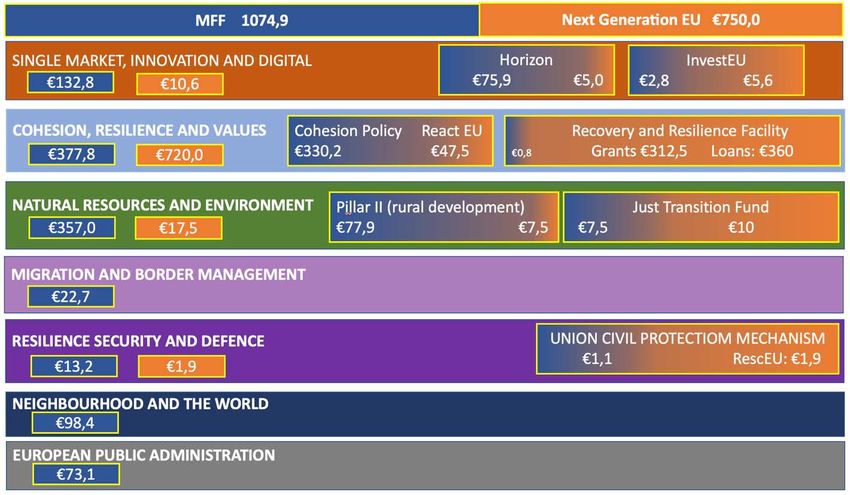
Impacts of the
COVID-19 pandemic
 on EU industries

Abstract
The COVID-19 crisis has had a substantial impact on the EU27
economy and triggered unprecedented policy responses across
Europe and the globe. With evidence on the effects on the EU
industry manifested until the beginning of 2021, this report aims
to address the following key issues: (1) impact of COVID-19 on the
EU economy as a whole and across sectors; (2) impact on
strategic value chains; and (3) necessary recovery measures to
meet the needs of the EU industry.
This document was provided by the Policy Department for
Economic, Scientific and Quality of Life Policies at the request of
the committee on Industry, Research and Energy (ITRE).
This document was requested by the European Parliament's committee on Industry, Research and
Energy (ITRE).

AUTHORS
Jan Maarten de Vet, Ecorys
Daniel Nigohosyan, Ecorys
Jorge Núñez Ferrer, CEPS
Ann-Kristin Gross, Ecorys
Silvia Kuehl, Ecorys
Michael Flickenschild, Ecorys

ADMINISTRATORS RESPONSIBLE
Matteo CIUCCI
Frédéric GOUARDÈRES

EDITORIAL ASSISTANT
Catherine NAAS

LINGUISTIC VERSIONS
Original: EN

ABOUT THE EDITOR
Policy departments provide in-house and external expertise to support European Parliament
committees and other parliamentary bodies in shaping legislation and exercising democratic scrutiny
over EU internal policies.

To contact the Policy Department or to subscribe for email alert updates, please write to:
Policy Department for Economic, Scientific and Quality of Life Policies
European Parliament
L-2929 - Luxembourg
Email: Poldep-Economy-Science@ep.europa.eu

Manuscript completed: March 2021
Date of publication: March 2021
© European Union, 2021

This document is available on the internet at:
http://www.europarl.europa.eu/supporting-analyses

DISCLAIMER AND COPYRIGHT
The opinions expressed in this document are the sole responsibility of the authors and do not
necessarily represent the official position of the European Parliament.
Reproduction and translation for non-commercial purposes are authorised, provided the source is
acknowledged and the European Parliament is given prior notice and sent a copy.
For citation purposes, the publication should be referenced as: de Vet, J.M, et al. Impacts of the COVID-
19 pandemic on EU industries, Publication for the committee on Industry, Research and Energy, Policy
Department for Economic, Scientific and Quality of Life Policies, European Parliament, Luxembourg,
2021.
© Cover image used under licence from Shutterstock
Impacts of the COVID-19 pandemic on EU industries

CONTENTS
LIST OF ABBREVIATIONS                                                                                   5
LIST OF BOXES                                                                                           7
LIST OF FIGURES                                                                                         7
LIST OF TABLES                                                                                          7
EXECUTIVE SUMMARY                                                                                       8
INTRODUCTION                                                                                          10
1.   IMPACT OF THE COVID-19 PANDEMIC ON EU INDUSTRIES                                                 12
     1.1. Impact on the economy as a whole                                                             12
     1.2. Analysis and assessment of the impacts on specific industries                                17
           1.2.1. Impact on the automotive industries                                                  17
           1.2.2. Impact on the aerospace industries                                                   19
           1.2.3. Impact on the chemical industries                                                    21
           1.2.4. Impact on the construction industries                                                23
           1.2.5. Impact on the food & drinks industries                                               24
           1.2.6. Impact on the textiles & apparel industries                                          27
           1.2.7. Impact on the cultural and creative industries                                       29
           1.2.8. Impact on the digital industries                                                     32
           1.2.9. Impact on the healthcare industries                                                  34
     1.3. Cross-sectoral analysis                                                                      35
2.   IMPACTS ON STRATEGIC VALUE CHAINS                                                                40
     2.1. Overview of strategic value chains                                                           40
     2.2. Impact on strategic value chains                                                             41
           2.2.1. Automotive strategic value chains                                                    42
           2.2.2. Digital strategic value chains                                                       44
           2.2.3. Healthcare and chemicals strategic value chains                                      47
     2.3. Relocation policies for Europe’s strategic autonomy                                          49
3.   ASSESSING THE RECOVERY MEASURES                                                                  52
     3.1. Overview of recovery measures taken so far                                                   52
           3.1.1. Measures taken by the EU                                                             52
           3.1.2. Measures taken by Member States                                                      53
     3.2. The Recovery Plan and the Multiannual Financial Framework 2021-2027                          55
           3.2.1. The approval and implementation process                                              56
           3.2.2. Assessment of the guidelines for the national recovery and resilience plans          59
           3.2.3. Alignment of the draft national plans to the EU guidance and industry needs          62

                                                     3                                         PE 662.903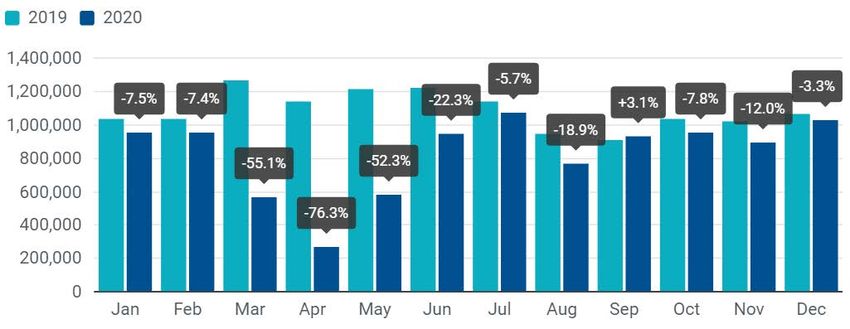
IPOL | Policy Department for Economic, Scientific and Quality of Life Policies

4.   CONCLUSIONS AND RECOMMENDATIONS                                             65
REFERENCES                                                                       70
ANNEX A: LIST OF INTERVIEWEES                                                    82
ANNEX B: LIST OF ATTENDEES TO THE FOCUS GROUPS                                   83

PE 662.903                                             4
Impacts of the COVID-19 pandemic on EU industries

LIST OF ABBREVIATIONS
ACEA       European Automobile Manufacturers' Association

ADAS       Advanced Driver-Assistance Systems

AI         Artificial Intelligence

API        Active Pharmaceutical Ingredient

AV         Autonomous Vehicles

B2C        Business-to-Consumer

CAV        Connected and Autonomous Vehicle

CCI        Cultural and Creative Industries

CCSA       Committee for the Coordination of Statistical Activities

COVID-19   Coronavirus Disease 2019

CRII       Coronavirus Response Investment Initiative

CSR        Country-Specific Recommendation

EAMA       European Automotive Manufacturers Association

EC         European Commission

ECB        European central bank

EIB        European Investment Bank

ESM        European Stability Mechanism

EU         European Union

GDP        Gross Domestic Product

GDPR       General Data Protection Regulation

HORECA     Hotellerie-Restaurant-Café

JTF        Just Transition Fund

KET        Key Enabling Technologies

                                          5                                           PE 662.903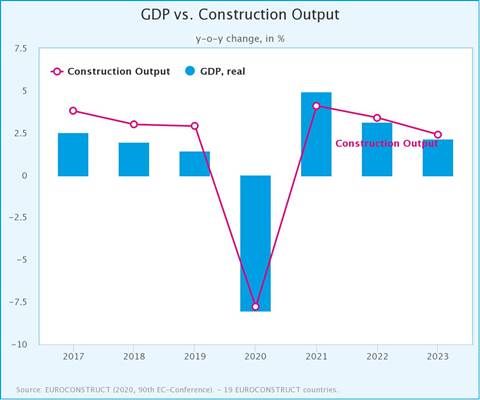
IPOL | Policy Department for Economic, Scientific and Quality of Life Policies

 ICT                Information and Communications Technology

 IMF                International Monetary Fund

 IPCEI              Important Projects of Common European Interest

 ITRE               Committee on Industry, Research and Energy (of the European Parliament)

 IT                 Information Technology

 LIDAR              Light detection

 Li-ion             Lithium-ion

 MMF                Multiannual Financial Framework

 NGEU               Next Generation EU

 OECD               Organisation for Economic Cooperation and Development

 OEM                Original Equipment Manufacturer

 PC                 Personal Computer

 PMI                Purchasing Managers' Index

 PPE                Personal Protective Equipment

 Q                  Quarter (of the year)

 R&D                Research and Development

 REACT-EU           Recovery Assistance for Cohesion and the Territories of Europe

 RRF                Recovery and Resilience Facility

 SME                Small and Medium-sized Enterprises

 STEM               Science, Technology, Engineering and Mathematics

 SURE               Unemployment Risks in an Emergency

 T&A                Textiles and Apparel

 UK                 United Kingdom

 US                 United States

PE 662.903                                             6
Impacts of the COVID-19 pandemic on EU industries
LIST OF BOXES
Box 1: Electric vehicles 19
Box 2: Artificial Intelligence 34
Box 3: National recovery and resilience plans: main requirements presented in the guidelines 60
LIST OF FIGURES
Figure 1: Number of daily new confirmed COVID-19 deaths per million people 13
Figure 2: Cumulative COVID-19 vaccination doses administered per 100 people 13
Figure 3: Real GDP growth path, EU 15
Figure 4: Euro area real GDP 15
Figure 5: Unemployment rates EU27 and euro area, seasonally adjusted 15
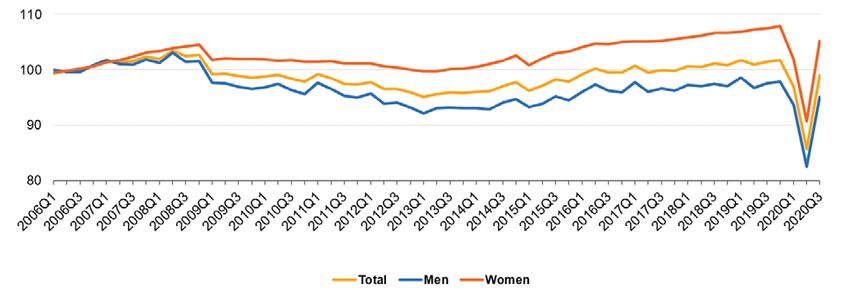
Figure 6: Index of total actual hours worked of persons aged 20-64, EU27, 2006-2020 16
Figure 7: Manufacturing/services PMI 16
Figure 8: New car registrations in the EU 18
Figure 9: European Aerospace sector performance forecast (2020-2024) 21
Figure 10: EU27 Chemicals Output (January-November 2020) 22
Figure 11: Year on year change in construction output and real GDP 24
Figure 12: EU quarterly manufacturing production and turnover, 2015-2020 26
Figure 13: Monthly output index of EU T&A sectors 29
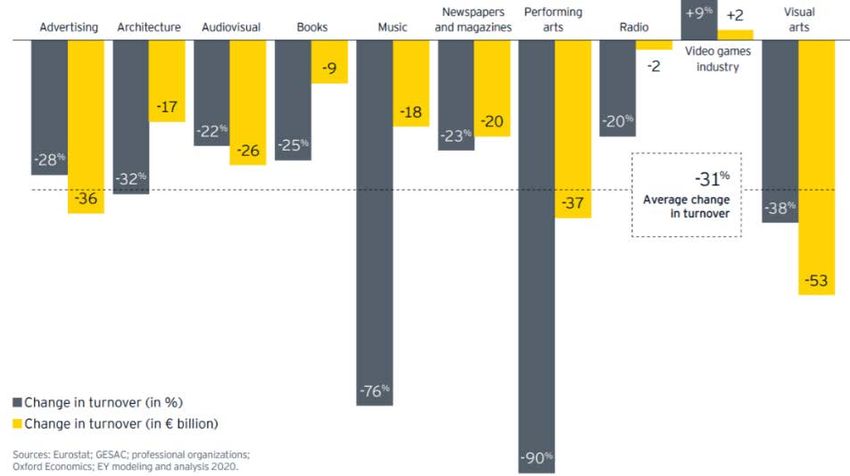
Figure 14: Estimated change in turnover 2019-20 by CCI sector 31
Figure 15: ICT spending by segment in Europe 33
Figure 16: Manufacturing industries production (q-o-q percentage change) 37
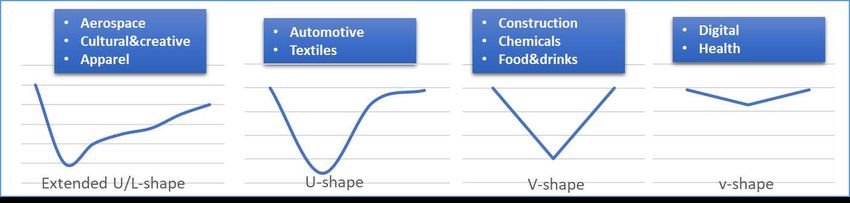
Figure 17: Recovery outlooks - summary 38
Figure 18: Imports and exports of medical protective equipment 48
Figure 19: Structure and allocations for the MFF 2021-2027 and NextGenerationEU 56
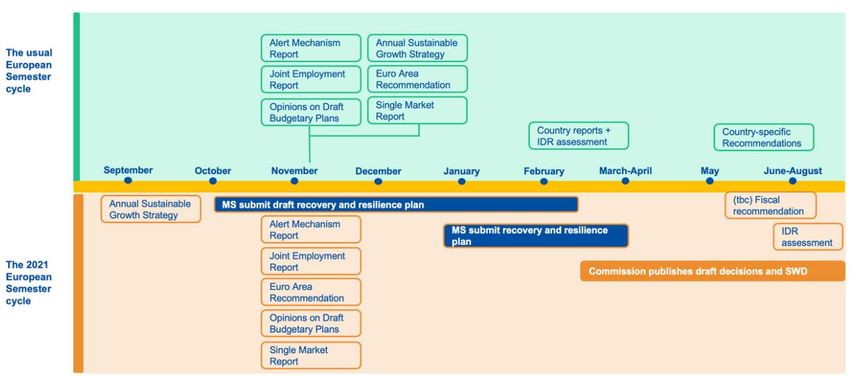
Figure 20: Changes to the 2021 European Semester cycle 57
LIST OF TABLES
Table 1: Key questions and objectives of this study 10
Table 2: EU Real GDP estimates (for 2020) and forecasts for 2021-2022 14
Table 3: Unemployment rate (number of unemployed as a percentage of total labour force) 16
Table 4: Overview of strategic value chains analysed 41
7 PE 662.903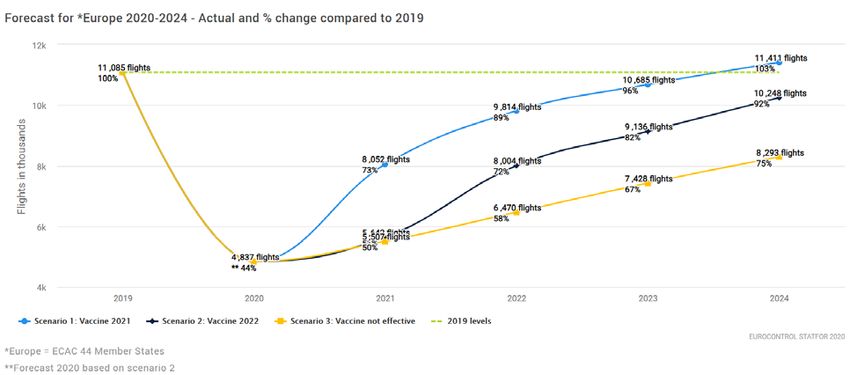
IPOL | Policy Department for Economic, Scientific and Quality of Life Policies

EXECUTIVE SUMMARY
The COVID-19 crisis has had an abrupt impact on the EU27 economy and triggered unprecedented
policy responses across Europe and the globe. As the pandemic is still unfolding globally, and at the
time that a second (and potentially even a third) wave still keeps Europe and the world in its grips, it is
too early to assess the full impacts of this crisis. Nevertheless, to support policymakers with evidence
on the effects on the EU industry manifested so far, this report aims to address the following key
questions:
    1) What is the impact of COVID-19 on the EU economy, and how is the impact distributed among
       different sectors?
    2) What structural changes has the crisis caused to our economy and the organisation of our
       value chains, and which value chains should be considered as strategic?
    3) How comprehensive are the recovery measures, and to what extent they are meeting the
       needs of the EU industry?

    1) The impact of the COVID-19 pandemic on the EU economy
Compared to the global economy, the euro area has experienced a larger hit in 2020 and will
experience a slower recovery in 2021. The real GDP is expected to reach pre-crisis levels by mid-2022
in both the EU and the euro area. This is a positive adjustment of the outlook as compared to the initial
forecasts that followed the start of the pandemic. However, it is important to note that a return of the
economic activity to pre-crisis levels entails slow growth for the EU economy.
There are remarkable differences in performance across, but also within sectors. A large part of
the digital industry has performed well, and so has the healthcare industry. Enabling industries like
chemicals, construction, and the food and drinks sector are likely to experience a V-shaped recovery
from the crisis. Despite the initial shocks, automotive and textile industries appear to be on a recovery
path since the first lockdowns. Sectors that are dependent on human contact and interaction, such
as the cultural and creative industries and the aerospace industry (due to the decrease in mobility
and tourism activities), have experienced substantial hits by the crisis, and they are likely to suffer for
extended periods from these unprecedented shocks.

The pandemic acted as an accelerator of digitalisation. The differences in the severity of COVID-19
effects are partially explained by the ability of businesses to go digital. Furthermore, the crisis lead
consumers to re-assess their needs and allows for a potential acceleration of the green agenda. For
example, in the automotive sector, despite the decline in the demand for new vehicles, the impact of
the pandemic on the demand for electric vehicles seems to be much less severe. This also affects the
forecasts positively for the rebound of the batteries supply chain. Overall, the pandemic has increased
the awareness of the benefits of the digital and green transition, which needs to be coupled with
adequate investments and political drives.

PE 662.903                                             8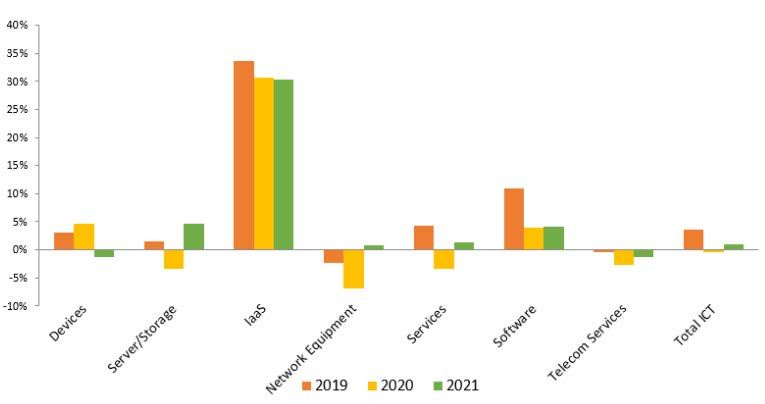
Impacts of the COVID-19 pandemic on EU industries

   2) Changes that the pandemic is causing to (strategic) value chains
In order to remain internationally competitive, the EU will need to continue to rely on global value
chains. In 2020, the resilience of European value chains had been tested: the COVID-19 pandemic
unveiled weaknesses, as many businesses were initially unable to cope with shortages in supplies
caused by closed borders and closed manufacturing sites. Nevertheless, most supply chains quickly
recovered and have been affected less severely during subsequent waves of infections. The overall
view from industry and experts alike is that value chains can be strengthened through increased
diversification rather than reshoring/onshoring. The crisis accentuated the strategic importance of
value chains such as microelectronics, autonomous driving, batteries, and AI in light of the accelerating
digital transformation and growing demand for electric vehicles. These value chains need to receive
continued attention and support to ensure access to materials, investment, and skills. However, this
should not lead to a sustained policy drive for relocation, as this trend could be at odds with the need
to keep the EU industry internationally competitive. Furthermore, industry leaders and experts alike
point to the limited stability of the investment climate in the EU’s Neighbourhood countries and the
reluctance to place (strategic) investments (including in R&D) in these countries.

   3) Comprehensiveness and relevance of the recovery measures
The heterogeneity of impacts on EU industries illustrated by this study needs to be fully taken into
account when preparing and evaluating recovery measures. The EU recovery package provides a
unique opportunity to strengthen the competitiveness of the EU industry by making it more green,
digital, and resilient. However, the measures in the national recovery and resilience plans will only
be justifiable, effective, and efficient if these plans take full account of the underlying economic
and sector-specific characteristics. If not, they may turn out to be the wrong vaccine.
The key recommendations of the study on the design and focus of the recovery measures and policies
are:
    1) Ensure that the national recovery and resilience plans are considering the specificities of the
         industrial tissue: there is no ‘one size fits all’ solution;
    2)   The national recovery and resilience plans should go beyond recovery to pre-crisis levels and
         should aim to boost the competitiveness of the EU industry via investments in R&D and
         digital re/upskilling;
    3)   Support strategic value chains where Europe can have a competitive edge, rather than
         addressing potential short-term disruptions;
    4)   To ensure resilience, national and EU measures should support the diversification of access
         to critical raw materials;
    5)   Include circular economy investments in the national recovery plans and ensure the
         necessary regulatory changes to reduce pressures on value chains;
    6)   Address the multiplicity of targets in the national recovery and resilience plans through
         prioritisation;
    7)   Speed up the adoption of national recovery and resilience plans to avoid further widening
         of the gap with other leading economies;
    8)   Make sure that the national recovery and resilience plans have a truly European character
         and oversight.

                                                  9                                           PE 662.903
IPOL | Policy Department for Economic, Scientific and Quality of Life Policies
INTRODUCTION
The COVID-19 pandemic, due to lockdowns in Europe and in the rest of the world, severely affected the
European Union (EU) industries. Disruptions in multiple supply chains across a variety of sectors
occurred, especially at the beginning of the crisis (March-April 2020) and particularly in the case of
internationalised and complex value chains. Unprecedented policy responses have been initiated
across Europe and the globe in an attempt to mitigate the impacts of this economic shock and to help
the recovery. However, the pandemic has also created opportunities for certain segments of the
economy, as consumers and businesses have radically changed their behaviours. As the pandemic is
still unfolding globally, and at the time that a second (and potentially even a third) wave still keeps
Europe and the world in its grips, it is too early to assess the full impacts of this crisis – whether negative
or positive. Nevertheless, to support policymakers with evidence on the effects on the EU industry
manifested so far, this study aims to address the following key questions and objectives:
Table 1: Key questions and objectives of this study
Key questions Objectives of this study
Assess the extent of effects of the COVID-19
What is the impact of COVID-19 on the crisis on the European industries: provision of
EU economy, and how is the impact quantitative and qualitative evidence on the
distributed among different sectors? effects on specific sectors and analysis of the
expected speed of recovery.
What structural changes has the crisis
Assess strategic value chains: identification of
caused to our economy and the
value chains that are strategic for the European
organisation of our value chains, and
industry and assessment of possible relocation
which value chains should be
scenarios for them (where/if needed).
considered as strategic?
Assess key Recovery Plan instruments:
How comprehensive are the recovery
provision of recommendations concerning the
measures, and to what extent they are
adequacy and consistency of the Recovery Plan
meeting the needs of the EU industry?
and related national measures.
Source: Author’s own elaboration.
This study (carried out in the period November 2020-March 2021) was commissioned by the Policy
Department for Economic, Scientific and Quality of Life Policies in the DG Internal Policies of the Union
on behalf of the Committee on Industry, Research and Energy (ITRE) of the European Parliament, to
provide an independent expert opinion on the COVID-19 effects on the EU industry and the necessary
recovery measures. It was structured along four tasks:
(1) structuring: refining of the methodology (problem definition and study design, assessment
framework, and consultation strategy);
(2) data/information collection: desk research (see the list of References), case studies for the
covered sectors 1, interviews with industry representatives and members of the
academia/think-tanks, focus groups (see Annex A – List of interviewees and Annex B - List of
attendees to the focus groups);
1
Automotive, chemical, food and drinks, construction, textile and apparel, digital, aerospace, creative and cultural, healthcare.
PE 662.903 10Impacts of the COVID-19 pandemic on EU industries
(3) analysis: triangulation of the gathered evidence and assessment of the effects of the COVID-19
pandemic on the EU industry and value chains, and analysis of the adequacy and consistency
of the recovery measures; and
(4) reporting and presentations.
The results of this analysis are presented in the following chapters:
• Chapter 1: Impact of the COVID-19 pandemic on EU industries – analysis of the impact of
the crisis and expected recovery scenarios on the EU economy as a whole, followed by a deep
dive on several sectors and a cross-sectoral analysis that presents the main similarities and
differences between sectors;
• Chapter 2: Impact on strategic value chains – overview of the value chains considered
strategic for the EU, impact on specific strategic value chains, and assessment of the need to
consider relocation policies;
• Chapter 3: Assessment of the recovery measures – an assessment of the recovery measures
at the EU and Member State levels to identify how these address the pandemic impacts on the
industry. It reviews the regulation and guidelines of the Recovery and Resilience Facility (RRF)
to evaluate the alignment of those to the longer-term objectives of the EU for key industrial
sectors and provides first impressions on the approach of some Member States in drafting the
national Recovery and Resilience plans; and
• Chapter 4: Conclusions and recommendations – a summary of the main conclusions and
recommendations for recovery and resilience actions/directions.
11 PE 662.903IPOL | Policy Department for Economic, Scientific and Quality of Life Policies
1. IMPACT OF THE COVID-19 PANDEMIC ON EU INDUSTRIES
1.1. Impact on the economy as a whole
KEY FINDINGS
• Compared to the global economy, the euro area has experienced a larger hit in 2020 and
will experience a slower recovery in 2021. The EU (3.6 to 4.2% growth forecast for 2021) is
significantly lagging behind the recovery forecasts for China (7.9% growth for 2021).
• The real GDP is expected to reach pre-crisis levels by mid-2022 in both the EU and the euro
area. However, a return to pre-crisis level of the economic activity would still mean slow
growth for the EU economy.
• Manufacturing industries have been impacted by short-term supply shortages, but most
manufacturing-based industries recovered relatively quickly during the third quarter (Q3)
of 2020.
• However, there are distinct differences among the sectors in the level of severity of impact
and extent of rebound. Sectors that require physical proximity, such as the cultural and
creative industries, have been the hardest hit by the crisis. At the same time, besides a short
and very small dip during Q2, the pharmaceutical and digital sectors have been the least
impacted sectors.
• The pandemic has accelerated existing trends, in particular the digital transformation.
The COVID-19 crisis has taken various forms across the world, and early scenarios of the COVID-19
pandemic often depicted waves, including a second wave in late 2020 2.
The expectations for a second wave in the European Union materialised, and at the time of writing this
report, it has still not abated (see Figure 1), with concerns for a possible third wave due to virus
mutations. As shown in the graph, the European Union recorded a higher number of COVID-19
deaths per million people than the global trend and much higher than the reported cases in China,
for instance.
The numbers in the EU are currently lower than in the United States (US), which also experienced a
pronounced second wave. However, in terms of vaccinations, the EU is currently lagging behind the
US (as shown in Figure 2).
2
CCSA, How COVID-19 is changing the world: a statistical perspective, Volume II, September, 2020, available at:
https://unstats.un.org/unsd/ccsa/documents/covid19-report-ccsa_vol2.pdf.
PE 662.903 12Impacts of the COVID-19 pandemic on EU industries
Figure 1: Number of daily new confirmed COVID-19 deaths per million people
Source: Our World in Data (as of 08.03.2021), based on Johns Hopkins University CSSE COVID-19 Data, 2021 3 .
Figure 2: Cumulative COVID-19 vaccination doses administered per 100 people
Source: Our World in Data (as of 08.03.2021), based on Johns Hopkins University CSSE COVID-19 Data, 2021 4 .
3
Our World in Data, Statistics and Research: Coronavirus (COVID-19) Cases, 2021, available at: https://ourworldindata.org/covid -
cases?country=IND~USA~GBR~CAN~DEU~FRA.
4
Our World in Data, Statistics and Research: Coronavirus (COVID-19) Cases, 2021, available at: https://ourworldindata.org/covid -
cases?country=IND~USA~GBR~CAN~DEU~FRA.
13 PE 662.903IPOL | Policy Department for Economic, Scientific and Quality of Life Policies
After the initial shock in the economic activity in Europe in the first half of the year, the EU economy
rebounded in the third quarter, as containment measures were gradually lifted. However, the
resurgence of coronavirus infections led to another decrease in economic activity in the last quarter of
2020. According to the European Winter 2021 Economic Forecast 5, the real Gross Domestic Product
(GDP) is now expected to reach pre-crisis levels by mid-2022 on average in both the EU and the
euro area (see Figure 3). For 2021, the projections for the real GDP growth in the euro area range from
3.6 to 4.2% (see Table 2). Even though this can be considered as a positive forecast as compared to the
economic forecasts produced in 2020, the dominant outlooks show a path to slow economic
recovery in the next 2 years. Compared to the estimates for the real GDP of the global economy, the
euro area has experienced a larger hit in 2020 and will experience a slower recovery in 2021 6, 7 . The EU
economy experienced a stronger shock than China and the US (2% growth and -3.6% decrease
respectively) in 2020, while it is significantly lagging behind the recovery forecasts for China (7.9
and 5.2% change on preceding year for 2021 and 2022, respectively) 8.
Table 2: EU Real GDP estimates (for 2020) and forecasts for 2021-2022 (y-o-y percentage
change)
Source 2020 2021 2022
EC (EU27) -6.3 3.7 3.9
EC (euro area) -6.8 3.8 3.8
ECB (euro area) -7.3 3.9 4.2
OECD (euro area) -7.5 3.6 3.3
IMF (euro area) -7.2 4.2 3.6
World Bank (euro area) -7.4 3.6 4.0
Source: EC 9 ; ECB 10 , OECD 11 , IMF 12 , World Bank 13 , 2021.
There are two important caveats as concerns the above forecasts. Firstly, the COVID-19 pandemic is
ongoing, and the situation might change rapidly depending on the speed of rollout of the vaccination
process, the efficacy of the vaccines, further mutations of the virus, and government decisions on how
to handle the health risks. These will determine the occurrence and strength of further COVID-19
waves. Consequently, the economic forecasts will continue to change (similarly to the adjustments
made throughout the whole of 2020). Secondly, in spite of the improving outlook for the EU on the
5
European Commission, 2021, ‘European Economic Forecast: Winter 2021 (Interim)’, Institutional Paper 144, Luxembourg: Publications
Office of the European Union.
6
World Bank, 2021, Global Economic Prospects, Washington, DC: World Bank.
7
IMF, 2021, World Economic Outlook Update, available at: https://www.imf.org/en/Publications/WEO/Issues/2021/01/26/2021-wor ld -
economic-outlook-update.
8
World Bank, 2021, Global Economic Prospects, Washington, DC: World Bank.
9
European Commission, 2021, Winter 2021 Economic Forecast, available at:
https://ec.europa.eu/commission/presscorner/detail/en/ip_21_ 504.
10
ECB, 2020, Macroeconomic projections for the euro area, available at:
https://www.ecb.europa.eu/pub/projections/html/ecb.projections202012_eurosystems taff~bf8254a10a.en.html.
11
OECD, 2020, Economic Outlook, Volume 2020 Issue 2, No. 108, OECD Publishing, Paris, available at: https://www.politico.eu/wp -
content/uploads/2020/12/01/EO108.PDFO_.pdf.
12
IMF, January database, 2021, available at: https://www.imf.org/en/Publications/WEO/Issues/2021/01/26/2021-world-economic-outlook -
update.
13
World Bank, 2021 Global Economic Prospects, available at: https://www.worldbank.org/en/publication/global-economic-prospects.
PE 662.903 14Impacts of the COVID-19 pandemic on EU industries
return to the pre-crisis level of the economic activity, such a return would still mean slow growth
for the EU economy (as illustrated in Figure 4).
Figure 3: Real GDP growth path, EU Figure 4: Euro area real GDP
Source: ECB, 2020 14 .
Source: EC, 2021.
Another concern for the EU economy
Figure 5: Unemployment rates EU27 and euro area,
seasonally adjusted is the rise in unemployment. The
unemployment rate increased sharply
in 2020, both in the EU27 and the euro
area, reaching 7.8% and 8.7%
respectively in the period July-
September 2020. In the remaining
months of 2020, it slowly decreased.
On a positive note, the EU
unemployment rate is still far from the
rates recorded after the 2008 financial
crisis. However, the evolution of
labour market slack suggests that
the impact of the pandemic has
been more severe than indicated by
the traditional indicators 16. This is
illustrated by the index of total actual
hours worked. As shown on Figure 6,
there was a significant drop in the
Source: Eurostat, 2020 15 . total hours worked in Q2 2020, which
is unparalleled.
The recovery in Q3 2020 did not reach the levels of actual hours worked preceding the COVID-19 crisis.
Furthermore, the labour market situation is expected to further worsen in 2021 (see Table 3) due to the
expiry of government measures, with unemployment figures increasing before declining again in 2022.
14
ECB, 2020, Macroeconomic projections for the euro area, available at:
https://www.ecb.europa.eu/pub/projections/html/ecb.projections202012_eurosystems taff~bf8254a10a.en.html.
15
Eurostat, Unemployment by sex and age (monthly data) - online data code: une_rt_m, 2020, available at :
https://appsso.eurostat.ec.europa.eu/nui/show.do?dataset=une_rt_m&lang=en.
16
European Commission, European Economic Forecast: Winter 2021 (Interim), 2021.
15 PE 662.903IPOL | Policy Department for Economic, Scientific and Quality of Life Policies
Figure 6: Index of total actual hours worked of persons aged 20-64, EU27, 2006-2020
Source: Eurostat, 2021 17 .
Table 3: Unemployment rate (number of unemployed as a percentage of total labour force)
2020 2021 2022
ECB (euro area) 8.0 9.3 8.2
OECD (euro area) 8.1 9.5 9.1
Source: ECB 18 , OECD 19 , 2020.
The production in the industry (manufacturing) 20 in the EU27 experienced a sharp decrease in March
and April 2020 (respectively -11.1 and -20% change on the previous period), which coincided with the
first wave of the spread of the coronavirus. It was then followed by a rebound in May and June 2020
(respectively 13% and 10.4% change on the previous period) and then by a small but increasing values
in the period September-November 2020 that coincided with the resurgence of COVID-19 cases.
To some extent, these dynamics point to an adaptation of the EU manufacturing companies to the new
realities of the pandemic and a milder impact of the second lockdown upon the EU27 industry.
Figure 7: Manufacturing/services PMI Globally, goods trade fell more rapidly and
recovered more swiftly than during the
previous financial crisis, but so far, services
trade remains depressed 22. In the euro
area, there is a clear deviation in the
manufacturing and services Purchasing
Managers' Index (PMI) since January 2020,
with services clearly hit much harder
(see Figure 7). The PMI shows very
different dynamics as compared to the
2008 crisis, when services experienced a
smaller decreased as compared to the
manufacturing PMI. Yet, the recovery in
industrial production remains incomplete
Source: OECD 21 . due to considerable investment
weakness . 23
PE 662.903 16Impacts of the COVID-19 pandemic on EU industries
1.2. Analysis and assessment of the impacts on specific industries
After the analysis of the impact of the COVID-19 crisis on the overall EU economy, in the following
sections, we focus on specific sectors of the EU industry before providing a synthesis in section 1.3.
1.2.1. Impact on the automotive industries
Context: Accounting for 5% of the EU total value-added and corresponding to about €675 billion24,
the automotive industry plays a major role in the economy, generating various business services and
influencing a vast supply chain. The manufacturing subsector of the automotive industry alone
employs 2.6 million people and represents 8.5% of all EU manufacturing jobs 25. The industry accounted
for 2.6% of the total EU value-added in 2019 26. Already before the global spread of the COVID-19
pandemic, the automotive industry had to face several challenges related to climate change and a fast
changing consumer demand. Major disruptions related to connected, autonomous, shared and electric
mobility have been transforming industry, consumer behaviour and production facilities and forced
industrial players to find new solutions, change production, and initiate new fleets 27, 28.
First wave: As outlined in the Commission Staff Working Document on Identifying Europe’s recovery
needs 29, the automotive industry belongs to the industries hit hardest by COVID-19 during the first
wave. The supply chains of the European automotive industries were disrupted from the first
shutdowns of Chinese factories 30. More severe, however, was the shutdowns of factories in Europe
between March and May. Across the EU Member States, automotive factories were closed for an
average of 30 days, with the shortest downtime in Sweden (15 days) and the longest in Italy (41 days)31.
In the first half of 2020, the EU automotive industry suffered production losses of 3.6 million vehicles,
which reflects a loss of €100 billion. Until the end of September 2020, this number increased to
4,024,036 motor vehicles, representing 22.3% of the EU total production in 2020 32. As of September,
the demand for cars in the EU decreased by 28.8% compared to the previous year (see Figure 8) 33.
17
Eurostat, 2020, Index of total actual hours worked in the main job in the EU, available at: https://ec.europa.eu/eurostat/statistics -
explained/index.php?title=File:Q3_Index_of_total_actual_hours_worked_in_the_main_job_in_the_EU.PNG.
18
European Commission, 2021, European Economic Forecast: Winter 2021 (Interim), available at:
https://ec.europa.eu/commission/presscorner/detail/en/ip_21_ 504.
19
OECD, 2021, Economic Outlook, Volume 2020 Issue 2, No. 108, OECD Publishing, Paris.
20
Eurostat, 2021, Production in industry - monthly data, Online data code: STS_INPR_M, available at:
https://appsso.eurostat.ec.europa.eu/nui/show.do?dataset=sts_inpr_m&lang=en.
21
OECD, 2021, Economic Outlook, Volume 2020 Issue 2, No. 108, OECD Publishing, Paris.
22
World Bank, 2021, Global Economic Prospects, available at: https://www.worldbank.org/en/publication/global-economic-prospects.
23
Ibid.
24
European Commission, 2020, Identifying Europe’s recovery needs, Commission Staff Working Document, available at: https://eur-
lex.europa.eu/legal-content/EN/TXT/PDF/?uri=CELEX:52020SC0098(01)&qid=1591607109918&from=IT.
25
European Commission, 2020, Automotive industry, available at: https://ec.europa.eu/growth/sectors/automotive_en.
26
EU Science Hub, 2020, PREDICT – Prospective Insights on R&D in ICT, available at: https://ec.europa.eu/jrc/en/predict/ict-sector-analys is -
2020/data-metadata.
27
Accenture, 2020, Coronavirs automotive rapid response, available at: https://www.accenture.com/us-en/insights/automotive/coronaviru s -
automotive-rapid-response.
28
McKinsey, 2020, Reimaginig the auto indsutry’s future its now or never, available at: https://www.mckinsey.com/industries/automotive-and -
assembly/our-insights/reimagining-the-auto-industrys-future-its-now-or-never.
29
European Commission, 2020, Identifying Europe’s recovery needs, Commission Staff Working Document.
30
Accenture, 2020, COVID-19: Impact on the Automotive Industry, available at: https://www.accenture.com/_acnmedia/PDF-121/Accentu re-
COVID-19-Impact-Automotive-Industry.pdf.
31
ACEA, 2020, Passenger car registrations, available at: https://www.acea.be/press-releases/article/passenger-car-registrations-28.8-nin e-
months-into-2020-3.1-in-september.
32
ACEA, 2021, Truck makers gear up to go fossil-free by 2040, but EU and Member States need to step up their game, available at:
https://www.acea.be/news/article/interactive-map-covid-19-impact-on-eu-automobile-production-up-until-septem.
33
ACEA, 2020, Passenger car registrations, available at: https://www.acea.be/press-releases/article/passenger-car-registrations-28.8-nin e-
months-into-2020-3.1-in-september.
17 PE 662.903IPOL | Policy Department for Economic, Scientific and Quality of Life Policies
Figure 8: New car registrations in the EU
Source: ACEA, January 2021 34 .
The pandemic affected more than 1.1 million jobs directly due to shutdowns of factories between
March and May. Additionally to comply with hygiene, distance, and security measures, and due to
reduced performance and demand drops, the number of people actively working in the factories was
substantially reduced. In addition to workers who were laid off, many were re-employed on short-term
contracts: in Germany, for instance, 95% of all companies in the automotive sector set their workforce
on short-term working during the first lockdowns 35.
Second wave: New lockdowns and confinement measures taken from November onwards in nearly all
EU Member States triggered repercussions on the automotive industry, as dealerships had to close and
general economic insecurity of consumers increased. While these effects have been varying
significantly across Member States, in general, the second wave has been showing to be less severe in
the stringency of its measures. In addition, car purchasing incentives, including tax incentives and
purchase subsidies from governments, have been substantially higher. Moreover, in many
countries, registration offices and service centres have remained open during the lockdowns, which
improved the overall business practices during the second wave as compared to the first36.
Nevertheless, as seen in Figure 8, car registrations also during November -December period have been
down by 12.0 and 3.3.% respectively, on a year-on-year comparison37.
Recovery outlook: The most likely scenario of recovery for the automotive sector at time of writing
this report (March 2021) appears to be U-shaped. Even though the second wave brings less severe
restrictions for the automotive industries and their production facilities, the EU passenger car market
contracted by 23.7% year-on-year compared to 2019, corresponding to about 9.9 million units in 2020,
due to the COVID-19 pandemic 38. A persistent drop in sales into 2021 is likely, due to smaller production
capacity, as distance regulations remain in place in factories, and decreased consumer confidence. The
European Automobile Manufacturers' Association (EAMA) forecasts that the fallout in sales will
34
ACEA, 2021, Passenger car registrations: -23.7% in 2020, -3.3% in December, available at: https://www.acea.be/press -
releases/article/passenger-car-registrations-23.7-in-2020-3.3-in-december.
35
McKinsey, 2020, Beyond coronavirus the road ahead for the automotive aftermarket, available at:
https://www.mckinsey.com/industries/automotive-and-assembly/our-insights/beyond-coronavirus-the-road-ahead-for-the-
automotive-aftermarket.
36
McKinsey, 2020, The second COVID-19 lockdown in Europe: Implications for automotive retail, available at:
https://www.mckinsey.com/industries/automotive-and-assembly/our-insights/the-second-cov id-19-lockdown-in-europe-implications-
for-automotive-retail.
37
ACEA, 2021, Passenger car registrations: -23.7% in 2020, -3.3% in December, available at: https://www.acea.be/press -
releases/article/passenger-car-registrations-23.7-in-2020-3.3-in-december.
38
Ibid.
PE 662.903 18Impacts of the COVID-19 pandemic on EU industries
continue during the first quarter of 2021 before recovery will pick up in the second half of the year. The
EAMA expectations are that sales will rise by about 10% during the course of 2021, as compared to
2020.
Another issue emerging in the automotive industry relates to the changing circumstances of the
industry, namely relative to the development and expected uptake of connected, autonomous and
electric vehicles (see box below). COVID-19 is argued to accelerate and amplify these trends and
contribute to affect consumer behaviour 39.
Box 1: Electric vehicles
The impact of COVID-19 on electric vehicles is less severe than the impact on the overall
sector 40. The average share of electric car sales over total car sales increased from 3.4% in 2019 to
7.8% in the first half of 2020, with a peak of 11% in April and about 8% in May and June. Also with
respect to global sales, electric cars have been less hit than non-electric cars 41. Following the first
wave of the pandemic, electric vehicles could further increase their market share to 10.5% of the
total EU car market 42. Similarly, electrified vehicles, a category which includes not only fully electric
cars but also plug-in as well as pure and mild hybrid vehicles, increased their market share to 26.8%
and outsold diesel cars for a second consecutive month in November 2020. Nevertheless, the
second wave also caused a significant impact on these industries, taking into account the absolute
numbers of new registrations, which fell by 7% in this subsector 43. The COVID-19 pandemic seems
to accelerate the growth of the electric vehicle market, as firstly consumer behaviour is changing
towards more private mobility instead of pubic mobility to reduce infection risks, while at the same
time, regulators are intensifying activities for climate protection in the mobility sector. Moreover,
recovery measures linked to the green transition are incentivising investments in this sector 44.
1.2.2. Impact on the aerospace industries
Context: In 2019, the European aerospace (including military aviation) industry generated about €260
billion of total turnover providing about 890,000 direct jobs 45. Aerospace is considered a ‘strategic
ecosystem’ as defined in the New EU Industrial Strategy 46, which will require increasing supply capacity
within the EU Single Market to meet the challenges embedded in the twin (green and digital)
39
McKinsey, 2020, Beyond coronavirus the road ahead for the automotive aftermarket, available at:
https://www.mckinsey.com/industries/automotive-and-assembly/our-insights/beyond-coronavirus-the-road-ahead-for-the-
automotive-aftermarket.
40
PwC Strategy&, 2020, The Impact of COVID-19 on the European Automotive Market, available at:
https://www.strategyand.pwc.com/it/en/assets/pdf/S&-impact-of-covid-19-on-EU-automotive-market.pdf.
41
Mock, P., Yang, Z and Tietge, U., 2020, The impact of COVID-19 on new car markets in China, Europe, and the United States, The International
Council on Clean Transportation (ICCT), available at: https://theicct.org/blog/staff/impact-covid-19-new-car-markets-china-europe-an d -
united-states-v-u-w-or-l.
42
Just Auto, 2021, Global pandemic sector recovery briefing, available at: https://www.just-auto.com/news/free-to-read-global-pandemic-
sector-recovery-briefing_id197509.aspx.
43
Just Auto, 2021, Electrified vehicle buck gloomy covid trend in Europe, available at: https://www.just-auto.com/news/electrified-vehicles -
buck-gloomy-covid-trend-in-europe_id198976.aspx.
44
McKinsey, 2020 From no mobility to future mobility: Where COVID-19 has accelerated change, available at:
https://www.mckinsey.com/industries/automotive-and-assembly/our-insights/from-no-mobility-to-future-mob ility-where-covid-19-
has-accelerated-change.
45
EUROCONTROL, 2020, What COVID-19 did to European Aviation in 2020, and Outlook 2021, Aviation Intelligence Unit, available at :
https://www.eurocontrol.int/sites /default/files /2021-01/eurocontrol-think-paper-8-impact-of-covid-19-on-european-aviation-in-2020-
and-outlook-2021.pdf.
46
European Commission, 2020, A New Industrial Strategy for Europe, available at: https://eur-lex.europa.eu/legal-
content/EN/TXT/HTML/?uri=CELEX:52020DC0102&from=EN.
19 PE 662.903IPOL | Policy Department for Economic, Scientific and Quality of Life Policies
transition 47. These include efforts towards decarbonisation, through the establishment of greener,
modern generation aircraft to guarantee emissions and fuel reduction, as well as further digitalisation
of factories and logistics to achieve more efficient flight and overall sector management. Guidelines to
increase investments in innovation to further enhance Europe’s technological stand in the global
aerospace sector are presented in the recently published Action Plan on Synergies between civil, defence
and space industries 48.
First wave: The outbreak of the pandemic in Europe triggered a sudden drop in demand for civil
aviation, evident in the daily trend of March, a month which ended with an 86.1% decline in air traffic
compared to 2019 levels, and in the unprecedented drop by 92.8% in mid-April, when mobility and
transport restrictions were implemented by most EU Member States 49. Between January and June 2020,
the number of aircraft grounded in Europe increased by a total of 80% as compared to the previous
year, making Europe the region featuring the worst global trends 50. Figures point to a very moderate
recovery starting at the beginning of the summer, with a -72.8% difference in June and a further
stabilisation to -51% in August with respect to 2019, in parallel to lifting travel restrictions across the
region over the summer51.
The immediate drop in the demand for the production of aircrafts, coupled with disruptions in the
supply of raw materials caused by the limitations in cross-border movements over the first quarter of
2020, triggered supply delays and massive fallouts in production. These, in turn, resulted in critical
cashflow issues for many companies at all stages of the aerospace supply chain, many of which –
notably second- and third-tier suppliers – are small and medium-sized enterprises (SMEs) 52. In
opposition to general trends of the industry, commercial aerospace experienced an uptake in logistics
for specific market subsectors, especially during the first months of the crisis. These activities,
however, did not strongly impact the overall yearly figures.
Second wave: Spiking infection rates and the reintroduction of government restriction measures
across Europe caused a traffic decrease at a weekly daily average of -73% between September and
December. European demand for aerospace manufacturing decreased in overall by 43% in 2020,
primarily driven by Airbus order deferrals 53. As for the service subsectors, airlines have been struggling
since the outbreak of the crisis. Many fell into bankruptcy or engaged in strong business restructuring54
resulting in forced costs and asset reductions, and ultimately job losses 55. With a total of €56.2 billion
of net losses for airlines, airports and air navigation service providers, national markets in the EU fell
47
European Cluster Alliance, 2020, How COVID-19 is impacting the Aerospace sector, available at:
https://clustercollaboration.eu/news/analysis-disruptions-aerospace-defence-ecosystem.
48
European Commission, 2021, Action Plan on Synergies between Civil, Defence and Space Industries 2021, available at:
https://ec.europa.eu/info/files/action-plan-synergies-between-civil-defence-and-space-industries_en.
49
EUROCONTROL, Comprehensive Assessment of COVID-19's Impact on European Air Traffic, 2021, available at:
https://www.eurocontrol.int/publication/eurocontrol-comprehensive-assessment-covid-19s-impact-european-air-traffic.
50
ASD, 2020, Aviation RoundTable Report on the Recovery of European Aviation, available at: https://www.asd-europe.org/eu-aviation-maps -
a-sustainable-post-crisis-future-in-round-table-report.
51
EUROCONTROL, Comprehensive Assessment of COVID-19's Impact on European Air Traffic, 2021, available at:
https://www.eurocontrol.int/publication/eurocontrol-comprehensive-assessment-covid-19s-impact-european-air-traffic.
52
ASD, 2020, COVID-19: Proposals for EU Relief Measures for Aerospace, Defence and Security Industries, available at: https://www.asd-
europe.org/covid-19-updates-resources.
53
Accenture, 2020, Commercial Aerospace Insight Report: In it for the Long Haul, available at: https://www.accenture.com/ie-
en/insights/aerospace-defense/commercial-aerospace-report-lead-in-the-new.
54
Deloitte, 2020, Post Covid-19 Aerospace Industry: An opportunity to embrace the 4.0 Era?, available at:
https://www2.deloitte.com/fr/fr/pages/covid-insights/articles /post-cov id-19-aerospace-industry.html.
55
Albers, S., and Volker, R., 2020, European airlines strategic responses to the COVID-19 pandemic, Journal of air transport management 87,
available at: https://www.sciencedirect.com/science/article/abs/pii/S0969699720303410.
PE 662.903 20Impacts of the COVID-19 pandemic on EU industries
between 40% and 73% as compared to 2019, with flights decreases ranging from 61% in the UK to 56%
in Germany and 60% in Italy. Leading aviation groups experienced unprecedented losses associated
with the overall 54% intra-European and 59% extra-European traffic decrease of 2020 56. About
191,000 direct jobs were lost for the whole European industry in 2020, each of which is estimated
to support another six jobs in the economy 57.
Recovery outlook: European traffic for 2021 is expected to recover to 51% of the 2019 levels. The
sector foresees that a moderated recovery could sustain in 2022, but an effective recovery to pre-
COVID-19 levels is not expected before 2024 58. As illustrated in Figure 9, a largely extended U-shaped
recovery is the most likely scenario for the sector, and its patterns will strongly depend on the effects
of the vaccinations that are directly interlinked to the state restriction measures adopted at European
and global level with respect to national and international mobility.
Figure 9: European Aerospace sector performance forecast (2020-2024)
Source: EUROCONTROL, 2020 59 .
1.2.3. Impact on the chemical industries
Context: With a €7,320 billion turnover and a contribution to 12% of EU manufacturing employment60,
Europe is the second-largest chemicals producer in the world after China and owns 16.9% of the total
global sales. The Chemicals Strategy for Sustainability 61 sets out some of the priorities that the sector will
focus on to meet the existing EU industrial challenges in the years ahead, as concerns the twin
transition.
56
EUROCONTROL, What COVID-19 did to European Aviation in 2020, and Outlook 2021, 2020, Aviation Intelligence Unit, available at :
https://www.eurocontrol.int/sites /default/files /2021-01/eurocontrol-think-paper-8-impact-of-covid-19-on-european-aviation-in-2020-
and-outlook-2021.pdf.
57
Five Aero, 2020, Perspectives on Passenger Air Transport in a COVID-19 World, available at: https://665b30d6-afb6-4758-92a3-
96543b32cf17.filesusr.com/ugd/6a99d4_2a5c03c48e484a03bd7e8ad14ac883a5.pdf.
58
EUROCONTROL, 2021, Comprehensive Assessment of COVID-19's Impact on European Air Traffic, available at:
https://www.eurocontrol.int/publication/eurocontrol-comprehensive-assessment-covid-19s-impact-european-air-traffic.
59
EUROCONTROL, 2021, COVID-19 impact on the European air traffic network, available at: https://www.eurocontrol.int/covid19.
60
CEFIC, 2020, The European chemical industry: a vital part of Europe’s future, available at: https://cefic.org/our-industry/a-pillar-of-th e-
european-economy/facts-and-figures-of-the-european-chemical-industry/.
61
European Commission, 2020, Chemicals strategy, available at: https://ec.europa.eu/environment/strategy/chemicals-strategy_en.
21 PE 662.903IPOL | Policy Department for Economic, Scientific and Quality of Life Policies
First wave: The performance of the EU chemical industry during the first year of the COVID-19 crisis
generally followed the overall EU industry trends. In the EU as well as globally, overall demand for
chemicals featured severe shocks across many end-markets, mainly due to disruptions in global supply
chains, drops in consumption, and ultimately in manufacturing. The fall in demand for chemicals
inevitably resulted in shrinking production and reduced supply 62. Between January and June 2020,
chemical output in the EU27 dropped by 5.2% compared to the previous year’s levels, with the
lowest point reached in April. In June, a 2.9% output growth was registered compared to May, showing
some early and modest signs of recovery.
The priority of the industry during the first months of 2020 was to secure supplies of critical chemicals
into supply chains considered ‘essential’ during the pandemic outbreak, such as the medical and food
sectors’, amidst border closures, mobility restrictions and lockdown measures 63. The manufacturing
output of these industry subsectors remained stable or even experienced growth following increasing
demand during the first semester of the year. Growth occurred, for instance, in the production of
disinfectants 64.
Second wave: Demand, as well as chemicals output, increased from September onwards due to
the relative revival in consumption during the summer, coupled with the capacity of businesses to
adapt their operations to the sanitary and distancing requirements of governments. Q3 experienced
an increase of 6.1% from the previous quarter. Output performance, however, was highly country-
dependent, with some EU Member States experiencing growth from 2019 (e.g. Spain and Poland, with
an increase of about 5% in September) and others featuring pitfalls (e.g. France and Italy, with -11.7%
and -6.7% respectively). Altogether, the total output for the chemical sector dropped by 2.8% from
January to November 2020 compared to 2019.
Figure 10: EU27 Chemicals Output (January-November 2020)
Source: Eurostat and Cefic 65 .
Recovery outlook: Recent data suggest that, despite the drop that the sector experienced during the
first two months of the pandemic, the prospects for recovery of the whole chemical sector are positive,
62
PwC Strategy&, 2020, COVID-19: Consequences for the chemicals industry – preparing for 'the day after' the global pandemic, available at :
https://www.strategyand.pwc.com/de/de/implications-of-covid-19/consequences-for-the-chemicals-industry.html.
63
CEFIC, 2021, COVID-19 Helpdesk, available at: https://cefic.org/the-european-chemical-industry-covid19-help-desk/.
64
Process Worldwide, Insight into the EU Chemical Industry, 2020, available at: https://www.process-worldwide.com/insight-into-the-eu -
chemical-industry-a-962997/.
65
CEFIC, 2020, Chemical Quarterly Report (CQR), available at: https://cefic.org/app/uploads/2020/09/Cefic-Chemicals-Quarterly-Report-C Q R-
September-2020.pdf.
PE 662.903 22Impacts of the COVID-19 pandemic on EU industries
pointing to a V-shaped recovery. Nonetheless, major differences in the impacts of the crisis across
countries and across subsectors point to a likely diverse recovery outlook. Some European chemical
companies, especially players in end-markets that have profited or that have not been strongly
impacted by the pandemic, have weathered the effects of the pandemic surprisingly well and seem to
be well-positioned to take advantage of any market rebound in 2021. By contrast, companies exposed
to end markets such as textile, automotive or aerospace manufacturing will continue to suffer
from the negative impact of COVID-19 through the whole of next year, being their performance directly
correlated to that of their sectorial counterparts 66.
1.2.4. Impact on the construction industries
Context: The EU construction sector provides 18 million direct jobs within the EU and contributed
about 9% to the EU’s GDP in 2019, accounting for about €1.216 billion 67. It is a sector that is very
sensitive to economic cycles 68, and it was hit hard during the 2008 financial crisis.
Additionally, the construction industries are facing challenges associated to stimulating demand, the
uptake of innovation and new technologies, as well as incorporating and implementing energy
efficiency and addressing climate change 69.
While the European Green Deal has major implications for the construction industries and will require
major adaptations, it is claimed that the green transition and the need to shift to a circular and climate
neutral economy will have significant positive effects on the sector70.
First wave: While it is estimated that construction industries in the euro area were operating at
25% to 30% below their normal capacity during the first wave, which represents the period under
strictest confinements, the situation across the EU is very diverse. In some Member States, it was
possible to continue activity more or less as before (e.g. in Germany), while in some countries (such as
Italy, Spain, Slovakia, Ireland or France), construction sector activities were severely limited. Even if in
most countries, construction industries have been allowed to take up production quickly again, a
number of difficulties arose due to the confinement measures and travel bans: labour shortages, supply
chain disruptions leading to shortages of construction material, as well as additional costs due to
intensified health and security measures 71.
Due to COVID-19, the winter slowdown in production substantially intensified by a drop of about 20%
and prolonged until April, before recovery started. Until August 2020, production recovered from -
11.5% year-on-year growth to -9.1% 72.
Overall, the labour market in the construction industries was affected substantially during the first
wave, particularly in consideration of temporary layoffs and reduced hours: the risk of being subject to
66
C&EN, 2021, World Chemical Outlook 2021, available at: https://cen.acs.org/business/CENs-World-Chemical-Outlook-2021/99/i2.
67
European Commission, 2021, Construction Industry, available at:
https://ec.europa.eu/growth/sectors/construction_en#:~:text=The%20construction%20industry%20is%20very,socia l%2C%20climate%
20and%20energy%20challenges.
68
International Labour Organization, 2020, Briefing note, available at: https://www.ilo.org/wcmsp5/groups/public/---ed_dialogue/---
sector/documents/briefingnote/wcms_767303.pdf.
69
European Commission, 2021, Construction Industry, available at:
https://ec.europa.eu/growth/sectors/construction_en#:~:text=The%20construction%20industry%20is%20very,socia l%2C%20climate%
20and%20energy%20challenges.
70
Trading Economics, 2020, European Union Construction Output, available at: https://tradingeconomics.com/europea n -
union/construction-output.
71
FIEC, 2020, Statistical Report, available at: https://fiec-statistical-report.eu/european-union.
72
KHL, 2020, Euroconstruct issues forecasts for 2021-2023, available at: https://www.khl.com/1147226.article.
23 PE 662.903You can also read