The Environmental Implementation Review 2019 - THE NETHERLANDS - COUNTRY REPORT THE NETHERLANDS - European ...
←
→
Page content transcription
If your browser does not render page correctly, please read the page content below
© gettyimages, RossHelen

                                            THE NETHERLANDS

                           The Environmental
                           Implementation
                           Review 2019

                           COUNTRY REPORT THE NETHERLANDS

                              Environment
EUROPEAN
                           COMMISSION

                                                    Brussels, 4.4.2019
                                                    SWD(2019) 133 final

                    COMMISSION STAFF WORKING DOCUMENT

                   The EU Environmental Implementation Review 2019
                        Country Report - THE NETHERLANDS

                                Accompanying the document

     Communication from the Commission to the European Parliament, the Council, the
       European Economic and Social Committee and the Committee of the Regions

                      Environmental Implementation Review 2019:
            A Europe that protects its citizens and enhances their quality of life

         {COM(2019) 149 final} - {SWD(2019) 111 final} - {SWD(2019) 112 final} -
         {SWD(2019) 113 final} - {SWD(2019) 114 final} - {SWD(2019) 115 final} -
         {SWD(2019) 116 final} - {SWD(2019) 117 final} - {SWD(2019) 118 final} -
         {SWD(2019) 119 final} - {SWD(2019) 120 final} - {SWD(2019) 121 final} -
         {SWD(2019) 122 final} - {SWD(2019) 123 final} - {SWD(2019) 124 final} -
         {SWD(2019) 125 final} - {SWD(2019) 126 final} - {SWD(2019) 127 final} -
         {SWD(2019) 128 final} - {SWD(2019) 129 final} - {SWD(2019) 130 final} -
         {SWD(2019) 131 final} - {SWD(2019) 132 final} - {SWD(2019) 134 final} -
         {SWD(2019) 135 final} - {SWD(2019) 136 final} - {SWD(2019) 137 final} -
                    {SWD(2019) 138 final} - {SWD(2019) 139 final}

EN                                                                                    EN
This report has been written by the staff of the Directorate-General for Environment, European Commission.
Comments are welcome, please send them to ENV-EIR@ec.europa.eu

More information on the European Union is available at http://europa.eu.

                                                     1
Photographs: p. 13 — ©iStock/Olena_Znak; p. 15 — ©iStock/kruwt; p. 19 — ©iStock/querbeet; p. 25 —
©iStock/Believe_In_Me; p. 27 — ©iStock/RossHelen; p. 37 — ©iStock/siraanamwong
For reproduction or use of these photos, permission must be sought directly from the copyright holder.

©European Union, 2019
Reproduction is authorised provided the source is acknowledged

                                                       2
Table of Contents

EXECUTIVE SUMMARY ........................................................................................................................ 3
PART I: THEMATIC AREAS .................................................................................................................... 4
1. TURNING THE EU INTO A CIRCULAR, RESOURCE-EFFICIENT, GREEN AND COMPETITIVE LOW-CARBON
ECONOMY ........................................................................................................................................... 4
      Measures towards a circular economy ............................................................................................... 4
      Waste management ............................................................................................................................ 8
      Climate change .................................................................................................................................... 9
2. PROTECTING, CONSERVING AND ENHANCING NATURAL CAPITAL ................................................... 12
      Nature and biodiversity ..................................................................................................................... 12
      Maintaining and restoring ecosystems and their services ................................................................ 13
      Estimating natural capital ................................................................................................................. 14
      Invasive alien species ........................................................................................................................ 15
      Soil protection ................................................................................................................................... 15
      Marine protection ............................................................................................................................. 16
3. ENSURING CITIZENS’ HEALTH AND QUALITY OF LIFE ....................................................................... 18
      Air quality .......................................................................................................................................... 18
      Industrial emissions ........................................................................................................................... 19
      Noise ............................................................................................................................................... 20
      Water quality and management ....................................................................................................... 21
      Chemicals .......................................................................................................................................... 23
      Making cities more sustainable ......................................................................................................... 25
PART II: ENABLING FRAMEWORK: IMPLEMENTATION TOOLS ........................................................... 28
 4. GREEN TAXATION, GREEN PUBLIC PROCUREMENT, ENVIRONMENTAL FUNDING AND INVESTMENTS
.......................................................................................................................................................... 28
      Green taxation and environmentally harmful subsidies ................................................................... 28
      Green public procurement ................................................................................................................ 29
      Environmental funding and investments .......................................................................................... 30
5. STRENGTHENING ENVIRONMENTAL GOVERNANCE ........................................................................ 35
      Participation, information and access to justice ............................................................................... 35
      Compliance assurance ....................................................................................................................... 36
      Effectiveness of environmental administrations............................................................................... 38
      International agreements ................................................................................................................. 40
      Sustainable development and the implementation of the UN SDGs ................................................ 41

                                                                                    3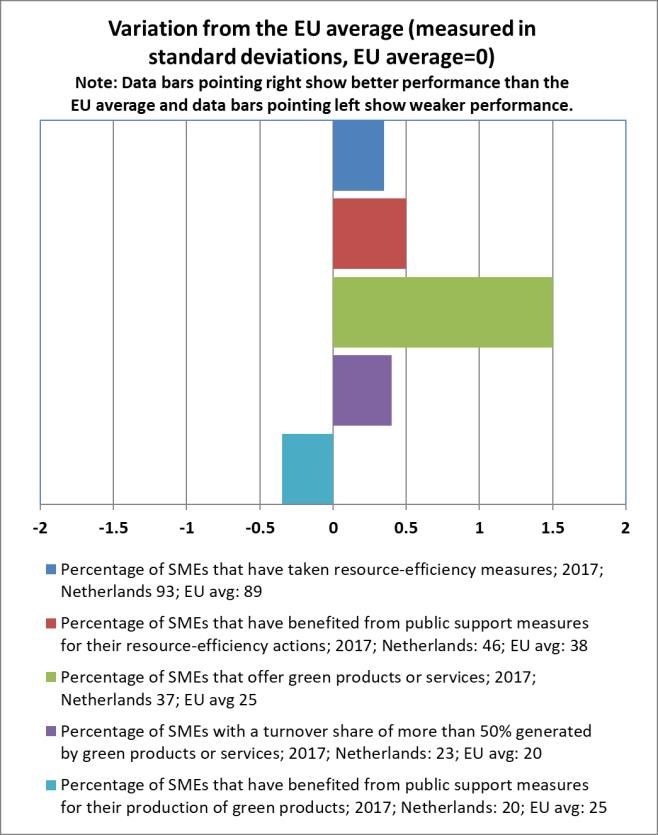
Environmental Implementation Review 2019 – the Netherlands
Executive summary
The Netherlands and the Environmental decrease seen in previous years has continued.
Implementation Review (EIR) Innovative solutions to reduce traffic congestion are
being tested in a number of cities. They are helping to
In the 2017 EIR, the main challenges identified with
reduce the use of older diesel cars, which will have a
regard to implementation of EU environmental policy
positive impact on air pollutants. The national strategy on
and law in the Netherlands were:
air quality and the national air quality cooperation
improving water quality, in particular regarding programme will be key instruments to reduce air
nutrient concentrations in surface waters; pollution in the country.
improving air quality, in particular the
Regarding nature conservation, some progress has been
concentrations of nitrogen dioxide and ozone to
made to improve the status of species and habitats.
prevent premature deaths; and
However, there is still considerable room for
optimising the contribution of the Natura 2000 and improvement. Habitat fragmentation, atmospheric
the national ecological networks to achieve good nitrogen deposition, desiccation and acidification affect
conservation status, and to reduce habitat the Natura 2000 network, which is still smaller than the
fragmentation and biodiversity loss, atmospheric EU average. In addition, farmland bird populations
nitrogen deposition, desiccation and acidification. continue to experience significant decline despite
The Netherlands organised an EIR dialogue in April 2018 national protection measures.
focusing on air and water quality, the circular economy The Netherlands continues to be efficient in making use
and green public procurement. The event confirmed the of EU funds and loan opportunities. The country is also a
authorities’ commitment to tackling the main gaps in the model to follow on national green funding, thanks to the
implementation of EU environmental legislation and go use of ‘green deals’.
further in some areas, such as tackling water pollution by
pharmaceutical products. The ‘bilateral dialogue on the Examples of good practice
action plan for nature, people and the economy’ in Circular economy actions continue to play an
October 2018 was further proof of this commitment.
important role. The country is an example of public-
In 2017, the Commission launched the TAIEX-EIR Peer-to- private partnership and the best performer in terms
Peer (EIR P2P), as a new practical tool facilitating peer-to- of resource productivity. Small businesses are
peer learning between environmental authorities. As of becoming increasingly circular and the recycling rate
January 2019, the Netherlands had participated in six P2P for municipal waste is among the highest in the EU.
events on different topics, including air pollution and The programme ‘A circular economy in the
circular economy. Netherlands by 2050’ is one of the most far-reaching
in the EU.
Progress on meeting challenges since the 2017 EIR
Green public procurement already exceeds
The 2019 EIR shows that for water quality there has Commission recommendations. The Netherlands has
been some progress in reducing nutrient concentration several circular procurement practices in place and
and eutrophication. Nitrate pollution remains a major the ‘green deal’ programme has begun with a
concern despite the efforts made by the Dutch number of pilots and guidance for functional
government through the national action programme for specifications.
nitrates. A derogation for nitrogen from livestock has The Netherlands is making good use of green tax
been granted on a series of conditions, including limits to instruments to tackle climate and environmental
phosphate production and an enhanced enforcement problems. Several subsidies and exemptions for
strategy to address, inter alia, improper animal petroleum and natural gas have been removed in
registration. However, continued progress is needed to recent years and CO2-based taxes are becoming
achieve full compliance. more common.
Environmental authorities are jointly making
For air quality, there has been some progress on
information on environment and health available
reducing the number of non-compliant areas. However,
through the portal Atlas Living Environment (Atlas
air quality is still cause for concern: in 2015, there were
Leefomgeving) in the form of searchable maps.
1 900 premature deaths attributable to nitrogen dioxide,
9 800 to fine particulate matter concentrations, and an
additional 290 to ozone concentration. The steady
4
Environmental Implementation Review 2019 – the Netherlands

                                                  Part I: Thematic areas
             1. Turning the EU into a circular, resource-efficient, green and
                             competitive low-carbon economy
                                                                            greater EU investment in environmental protection (EU-
Measures towards a circular economy                                         28: 85 %).

The Circular Economy Action Plan emphasises the need                        In addition, the Netherlands was one of the first EU
to move towards a life-cycle-driven ‘circular’ economy,                     countries to present a circular economy programme
reusing resources as much as possible and bringing                          (2014), followed in September 2016 by the
residual waste close to zero. This can be facilitated by                    comprehensive programme ‘A circular economy in the
                                                                                                 6
developing and providing access to innovative financial                     Netherlands by 2050’ . The country is in many cases
instruments and funding for eco-innovation.                                 leading by example and partnering up to push circularity
                                                                                     7
                                                                            in the EU .
Following the adoption of the Circular Economy Action                       The 2017 Coalition Agreement reaffirmed the
Plan in 2015 and the setting up of a related stakeholder                    government’s commitment to transition towards a
platform in 2017, the European Commission adopted a                         circular economy. It also promised to identify bottlenecks
                                                        1
new package of deliverables in January 2018 . This                          to sustainable innovation in legislation, supervision and
included additional initiatives such as: (i) an EU strategy                 enforcement, and see whether these can be resolved .
                                                                                                                                  8

for plastics; (ii) a Communication on how to address the
interplay between chemical, product and waste                               All national policy efforts related to the circular economy
legislation; (iii) a report on critical raw materials; and (iv)             are captured in the action plan ‘From waste to resource’
a framework to monitor progress towards a circular                          (the VANG programme), covered in the 2017 EIR.
          2
economy .                                                                   Since 2017, the government has built the circular
The EU’s circular economy monitoring framework tracks                       economy into its climate action plans. According to
key trends and patterns to understand how the various                       various studies, the 2016 circular economy programme
parts of the circular economy are developing and                            could have a decisive impact on the reduction of
whether sufficient action has been taken.                                   greenhouse gas (GHG) emissions by 2050. Plastics reuse
                                                                            and recycling could account for 28 % of emissions
Circular (secondary) use of materials in the Netherlands                    reduction, while biomass and food circular actions might
stood at 29 % in 2016, a remarkable share compared with                                           9
                                                                            add up to around 35 % .
                                  3
the EU-28 average of 11.7 % . By contrast, the
Netherlands performed slightly below the EU-28 average                      New developments are expected in the way the
for the number of persons employed in the circular                          Netherlands deals with measuring progress towards a
economy (at 1.19 % of total employment in 2016, against                     circular economy. In January 2018 three government
                            4                                                                                            10
an EU-28 average of 1.73 %) .                                               agencies called for a new monitoring system . Statistics
                                                                            Netherlands (CBS), the Netherlands Environmental
There is clear support for circular economy initiatives and                 Assessment Agency (PBL) and the National Institute for
environmental protection in both society and                                Public Health and the Environment (RIVM) proposed to
government.                                                                 go further than the Commission’s circular economy
Citizens seem aware of the problems of a linear                             monitoring framework, to address whether all activities
         5                                                                  that stakeholders need to carry out are on schedule. The
economy . In 2017, 81 % of Dutch citizens expressed
concern about the effects of plastic products on the                        Dutch government will reply to this with a monitoring
environment (EU-28: 87 %), and 83 % about the impact of
                                                                            6
chemicals (EU-28: 90 %). Moreover, 88 % supported                             Government of the Netherlands, A Circular Economy in the
                                                                            Netherlands by 2050, 2016.
                                                                            7
                                                                              Speech by the State Secretary for Infrastructure and Water
1
  European Commission, 2018 Circular Economy Package.                       Management Stientje van Veldhoven at the seminar ‘Luxembourg and
2
  COM(2018) 029.                                                            the Netherlands: Together on the way to a circular economy’, 24 May
3
  European Commission, Circular material use rate. This indicator           2018.
                                                                            8
measures the share of material recovered and fed back into the                Government of the Netherlands, Coalition Agreement 'Confidence in
economy.                                                                    the Future’, 10 October 2017, p. 50.
4                                                                           9
  European Commission, Indicators for the Circular Economy Monitoring         TNO, Effecten van het Rijksbrede Programma Circulaire Economie en
Framework, 2018.                                                            de Transitieagenda’s op de emissie van broeikasgassen, pp. 22-24.
5                                                                           10
  European Commission, Special 486 Eurobarometer ‘Attitudes of                 ENDS Europe, Dutch agencies call for a circular economy monitoring,
European citizens towards the environment’, 2017.                           22 January 2018.

                                                                        5
Environmental Implementation Review 2019 – the Netherlands

report on “guidance, progress, environmental and socio-                        material savings and 172 million tonnes of materials
                                                                                                                               16
economic effects in the Circular Economy” that will be                         diverted (e.g. to reuse and recycling) in the EU .
published by the beginning of 2020.
                                                                               The Dutch system of collection of domestic medicines is
All in all, the Netherlands can be considered a model of                       another good example of how circularity can be applied
public-private partnership to achieve a more circular                          to almost every economic sector. The Royal Dutch
economy. Several projects have been financed and                               Pharmacists Organisation (KNMP) states that more than
successfully implemented in recent years.                                      140 tonnes of waste medicine ends up in surface waters.
                                                                               KNMP is reducing the amount of leftover medication
The Pension Fund for Civil Servants (ABP), the largest
                                                                               ending up in the environment through initiatives such as
Dutch pension fund, adopted a new policy for sustainable
                                                                               medicine use monitoring and incentives for a new waste
investment in 2015 and has continued its environment-
                                                                               collection system in pharmacies. The number of
friendly approach. In 2017 alone, the ABP cut the level of
                                                                               municipalities making pharmacies pay for waste medicine
CO2 emissions in its equity portfolio by 7 million tonnes                                                            17
                                                                               fell from 45 % in 2016 to 10 % in 2018 .
(the annual emissions of 2.8 million cars), while its
                                             11
investment in renewable energy rose by 25 % .                                  The Netherlands, Belgium, France and the United
                                            12 13                              Kingdom participate in the Nereus project, funded by the
Nitrates and the circular economy
                                                                               EU through its European Regional Development Fund
Current manure policy costs about EUR 350 million, but                         (ERDF) programme Interreg 2 Seas. The aim is to boost
increases welfare by around EUR 2 billion when the                             the development of the green economy and the
benefits for nature and health are included in the                             transformation of wastewater into a valuable source of
            14
calculations . Because the amount of manure that is                            water, resources (e.g. cellulose and nutrients) and
produced is more than can applied on the land, farmers,                        energy. In June 2018, the first pilot location officially
unless they give in to fraud, are forced to dispose the                        opened in Rotterdam to create as much value as possible
surplus manure either via direct exports or processing.                        from domestic waste water after it is collected and
                                                                                         18
Both are costly, implying that intensive livestock farmers                     processed .
have to pay to get rid of manure: the marginal value of
                                                                               The ‘green deals’ continue to be one of the most
manure as a fertiliser in the Netherlands is therefore
                                                                               innovative ways of overcoming obstacles to green
negative.
                                                                               developments. On 7 June 2018, a new green deal on
Newly developed manure-processing technologies, such                           circular procurement was signed by 50 public and private
as one developed by the EU-funded project BioEcoSIM,                           organisations and companies, adding up to EUR 100
                                                                                                           19
may reduce the cost of the manure policy with benefits                         million in purchasing power . The initiative is open to all
for the circular economy. A study has estimated that with                      organisations keen on circular purchasing.
the current policy and economic circumstances, if all
                                                                               Besides these examples, the Netherlands is the best
Dutch pig manure went through a process like
                                                                               performer in the EU in terms of resource productivity
BioEcoSIM’s and cost estimates are correct, this would
                                                                               (how efficiently the economy uses material resources to
increase GDP by EUR 15 million and reduce the                                                     20
                                                                               produce wealth) , at EUR 4.2/kg in 2017 (EU:
environmental costs of greenhouse gas emissions and
                                                     15                        EUR 2.04/kg). Figure 1 shows a gradual increase since
particulate matter formation by about EUR 75 million .
                                                                               2008, with a temporary decline between 2013 and 2015,
The LIFE-granted project REBUS aims to secure more                             and a significant increase in 2016. The main reasons for
resource-efficient business models. After a trial phase in                     this good performance are the slowdown of fossil fuel
the United Kingdom and the Netherlands, more than                              consumption and falling demand for non-metallic
                                                                                                                                   21
62 000 tonnes of materials have been saved. Scaling up                         minerals due to increasing reuse and recycling rates .
the benefits could result in 184 million tonnes of direct

11
   Pensioenfonds voor overheid en onderwijs, ABP on course with
sustainable investments.
12                                                                             16
   Woltjer, G. & Smits, M., 2018. Phosphorus Recycling from Manure,               Wrap UK and Dutch Ministry of Infrastructure and the Environment,
CIRCULAR IMPACTS project.                                                      the REBus Project, December 2017, p. 6.
13                                                                             17
   PBL, 2017. Evaluatie Meststoffenwet 2016: Syntheserapport.                     EIR Dialogues, Summary Country Dialogue Netherlands 12 April 2018.
14                                                                             18
   Van Grinsven, H.J.M., Tiktak, A. & Rougoor, C.W., 2016. Evaluation of          Nereus Project, First Nereus demo case officially opened in
the Dutch implementation of the nitrates directive, the water                  Rotterdam.
                                                                               19
framework directive and the national emission ceilings directive. NJAS            Green Deal, Circulair inkopen 2.0.
                                                                               20
— Wageningen Journal of Life Sciences, 78, pp.69-84.                              Resource productivity is defined as the ratio between gross domestic
15
   Van Grinsven, H.J.M., Tiktak, A. & Rougoor, C.W., 2016. Evaluation of       product and domestic material consumption.
                                                                               21
the Dutch implementation of the nitrates directive, the water                     European Environment Agency, More from less — material resource
framework directive and the national emission ceilings directive. NJAS         efficiency in Europe (Dutch report), 2017; and Government of the
— Wageningen Journal of Life Sciences, 78, pp.69-84.                           Netherlands, A Circular Economy in the Netherlands by 2050, 2016.

                                                                           6
Environmental Implementation Review 2019 – the Netherlands
                                                  22                                                                           26
Figure 1: Resource productivity 2010-2017                              Figure 2: Environmental performance of SMEs

Furthermore, the Netherlands employed 132 008
workers in the environmental goods and services sector
                              23
in 2015, slightly up from 2012 .
The Netherlands’ performance should be seen as an
example for other countries of the effect of policies to
improve resource productivity, although its high level of
dependence on imported raw materials remains a
concern.
The many positive developments and achievements
leave, however, scope for stepping up circular economy
activities. The value added of the environmental goods
and services sector is increasing, but more slowly than
might be expected from a strong service-based economy                  In 2018, the latest Eurobarometer on ‘SMEs, resource
like the Netherlands (to 2.45 % of GDP in 2015, from                   efficiency and green markets’
                                                                                                                27
                                                                                                                    showed new
                24
2.44 % in 2014) .                                                      developments on some of the main indicators. 37 % of
There are still a number of barriers to promoting                      Dutch SMEs are currently offering green products and
innovation in the circular economy. These require greater              services (up from 27 % in 2015). 20 % of the companies
recognition that transitioning to a circular economy                   surveyed (EU average of 14 %) said that green products
needs different forms of innovation: technological,                    or services accounted for more than 75 % of their annual
financial (business cases), organisational (working                    turnover for the latest available fiscal year. Although only
methods) and social (focused on cooperation and                        35 % of Dutch SMEs have employees working in green
teamwork) .
           25                                                          jobs (25 % in 2015, EU-28 average: 40 %), the average
                                                                       number of green employees within these companies is
SMEs and resource efficiency                                           6.2, much higher than the EU average of 4.7. Finally,
                                                                       public sector support for SMEs seems to be
The Commission’s annual SME performance review for                     acknowledged, as 87 % of ‘green’ SMEs are satisfied with
2018 showed the general situation of small businesses in               the assistance provided by the public sector (EU-28:
the Netherlands with regard to environmental                           58 %).
performance (see Figure 2). These companies were
above the European average in green turnover (green                    Nonetheless, SMEs reduced investment in resource
products or services accounted for more than 50 % of                   efficiency actions in the period 2015-2017 (51 % said they
turnover in 23 % of Dutch SMEs) and in public funding for              had invested up to 5 % of their annual turnover in 2017,
resource efficiency actions. On the other hand, they were              against 62 % in 2015), although the figure is still just
below the EU average only in public sector support for                 above the EU average of 50 %. That slight fall might
production of green products.                                          adversely affect the Netherlands’ performance, as the
                                                                       country relies heavily on voluntary agreements and
22                                                                     initiatives to improve resource efficiency. National
   Eurostat, Resource productivity.
23
   Eurostat, Employment in the environmental goods and services        policies and other support measures are not enough,
sector.
24                                                                     26
   CBS, Green Growth 2018 .                                              European Commission, 2018 SBA fact sheet - Netherlands, p.15
25                                                                     27
   European Commission, European Semester Country Report for the         Eurostat, Flash Eurobarometer 456: SMEs, resource efficiency and
Netherlands, 2018, p. 51.                                              green markets, 2018.

                                                                   7
Environmental Implementation Review 2019 – the Netherlands

particularly for improving financing, supporting extended                     overall European Innovation Scoreboard 2018, and was
producer responsibility, encouraging external audits and                      the second fastest growing innovator (with a 15.9 %
                                                       28                                         33
improving company accounting and reporting practices .                        increase since 2010) . However, it ranked only 14th on
                                                                              the eco-innovation scoreboard for 2017 as shown in
In any case, in recent years there has been an increasing
                                                                              Figure 3.
number of public-funded projects to increase resource
                                                                                                                                    34
efficiency. The MIA (an environmental investment                              Figure 3: 2017 Eco-innovation index (EU=100)
rebate) and VAMIL (discretionary depreciation of
environmental investments) are public schemes to grant
tax advantages for environment-friendly products and
entrepreneurs and to bring innovative products to
                     29
market more rapidly .
The 2017 Coalition Agreement also included proposals to
                                        30
improve national resource efficiency . The new
Environment and Planning Act and the implementation of
the circular economy programme and the transition
agendas set out in the Raw Materials Agreement are
good examples.
EU funding can also contribute to companies’ resource
efficiency. Most of the European funds and programmes
connect competitiveness, innovation, the environment
and climate in one way or another. In addition, specific
instruments for resource efficiency, such as the Private
Finance for Energy Efficiency (PF4EE) instrument and the
European Energy Efficiency Fund, have been launched by
the Commission, the European Investment Bank (EIB) and
                           31
national investment banks .
                                                                              Since 2011, the Netherlands has seen its eco-innovation
These measures are crucially important because the                            performance decline, from 112 points to a low of 88 in
Dutch economy depends on rare or critical materials and                       2017 (see Figure 4), mainly due to poor performance in
           32
resources . According to the Eurobarometer, resource                          two areas: eco-innovation activities and socioeconomic
efficiency actions already undertaken have helped cut                                  35
                                                                              outcomes .
production costs in 30 % of the Netherlands’ SMEs (EU-28                                                                           36
average 41 %). So small businesses have yet to harness                        Figure 4: Dutch eco-innovation performance
the full potential of resource efficiency.
The EIR 2017 suggested action to “explore the full
potential of resource efficiency measures for and by
SME” remains as priority action 2019, as there is scope to
give more support to financing, Extended Producer
Responsibility (EPR) and accounting and reporting
practices.

Eco-innovation
The Netherlands has been a leader in EU innovation since                      The Netherlands’ low score seems to contradict its
at least the 1970s. The country ranked fourth on the                          ambitious sustainability objectives; eco-innovation at
                                                                              national level may need to be improved. At local and
28
   Ecologic Institute, IEEP, BIO by Deloitte, 2015. A framework for           regional level, more progress has been made, particularly
Member States to support business in improving its resource efficiency.
Study for the European Commission.
29
   Netherlands Enterprise Agency, Environmental subsidies and
                                                                              33
programmes.                                                                      European Commission, European innovation Scoreboard 2018.
30                                                                            34
   Government of the Netherlands, Coalition Agreement ‘Confidence in             European Commission Eco-innovation Observatory, Eco-Innovation
the Future’, 10 October 2017.                                                 scoreboard 2017, 2018.
31                                                                            35
   European Commission. Improving resource efficiency in SMEs,                   European Commission Eco-Innovation Observatory, EU Eco-
December 2017, pp. 21-31.                                                     Innovation Index 2017 Brief, 2018.
32                                                                            36
   CBS, Monitor Duurzaam Nederland 2017.                                         Authors based on the EU Eco-Innovation Index (see 27).

                                                                          8
Environmental Implementation Review 2019 – the Netherlands
on sustainable energy, with many local initiatives and systems, putting the Netherlands in 11th place in the
43
ambitious city projects. EU . Employment in eco-industries and the circular
economy accounts for only 1.17 % of total employment,
Other barriers to eco-innovation are the low take-up of 44
against 1.71 % for the EU-28 .
ecolabel licences (only 1 100 products registered out of
37
71 707 in the EU, compared to 30 384 in Spain) and 2019 priority action
limited use of eco-management and audit schemes (only
Latvia and Malta have fewer EMAS helpdesk Adopt circular economy principles that act as
38
organisations and sites) . In September 2018, the incentives for resource efficiency measures and
Netherlands had 1 100 products and 83 licences increased recycling; eco-innovation performance;
registered with the EU Ecolabel scheme and only two and investments in green products and services.
organisations in EMAS. Nevertheless, some national
schemes are in place, such as the Milieukeur, the Waste management
39
environmental quality label for products and services .
Turning waste into a resource is supported by:
On the other hand, the Netherlands has the potential to (i) fully implementing EU waste legislation, which includes
be a frontrunner and testing ground for the circular the waste hierarchy, the need to ensure separate
economy for several reasons: with big harbours and good collection of waste, the landfill diversion targets, etc.;
infrastructure, the country is an important link in (ii) reducing waste generation and waste generation per
international material flows and can therefore also play a capita in absolute terms; and
part in the flow of recycled and bio-based materials. (iii) limiting energy recovery to non-recyclable materials
Second, the Netherlands has a reputation for and phasing out landfilling of recyclable or recoverable
entrepreneurial spirit and knowledge, and a leading waste.
position in design and advanced waste management
systems. Other important drivers of the circular economy This section focuses on management of municipal
45
are opportunities to innovate, attract new business, waste for which EU law sets mandatory recycling
46
improve the environment and people’s wellbeing, and targets .
40
reduce dependency on external resources . Figure 5 shows that the amount of municipal waste
The Netherlands continues to do well in waste generated fell slightly between 2014 and 2017,
management and green procurement, with the green continuing the downward trend of previous years.
deal programme helping to launch several pilot projects. However, it is still above the EU average (at
The number of local sustainable energy corporations 513 kg/y/inhabitant against 487 kg/y/inhabitant) and the
increased to 392 in 2017. Together, they started 100 new decline has slowed (from 45 kg per capita between 2010
collective solar energy projects. and 2013 to 13 kg per capita between 2013 and 2017).
The ‘Make it Work’ project On the very positive side, the recycling rate (including
composting) for municipal waste, at 54 % in 2017, is
An example of good practice is the ‘Make it Work’ higher than the EU average of 46 %, and recycling
project, bringing together experts to produce remains the main form of treatment of municipal waste,
recommendations for keeping EU environmental while landfilling, at 1 %, is well below the EU average of
legislation and implementation practice fit for purpose. 24 %, as a result of landfill taxes and bans.
Make it Work’s current focus is on enabling eco-
innovation for the circular economy under EU Figure 6 shows that since 2013 the Netherlands has
environmental legislation: specifically, turning waste into complied with the EU 2020 municipal waste recycling
41 target of 50 %, placing the country among the best
new secondary raw materials .
performers in the EU.
All in all, to overcome the eco-innovation gap, some of
the main indicators in the index need to improve. For
instance, only 2 677 organisations use the ISO 14001 43
International Organisation for Standardisation, ISO Survey of
42
standard for effective environmental management Certifications, 2016.
44
Eurostat, Circular Economy Monitoring Framework, 2018.
45
Municipal waste consists of mixed waste and separately collected
37
European Commission, Ecolabel Facts and Figures. waste from households and from other sources, where such waste is
38
European Commission, Eco-Management and Audit Scheme. similar in nature and composition to waste from households. This is
39
Milieukeur, website. without prejudice to the allocation of responsibilities for waste
40
European Commission, Eco-Innovation Observatory, Country profile management between public and private sectors.
46
2016-2017: The Netherlands. See Article 11.2 of Directive 2008/98/EC. This Directive was amended
41
EIR Dialogues, Summary Country Dialogue Netherlands 12 April 2018. in 2018 by Directive (EU) 2018/851, and more ambitious recycling
42
International Organisation for Standardisation, ISO 14001:2015. targets were introduced for the period up to 2035.
9Environmental Implementation Review 2019 – the Netherlands
Figure 5: Municipal waste by treatment in the part to ensure that by 2025 the annual volume of
47
Netherlands 2010-2017 residual household waste is no more than 30 kg per
capita (100 kg in 2020). By 2022, the volume of residual
waste from companies, organisations, and governments
comparable to residual household waste must be halved
(compared to 2012. In line with these operational goals,
the government also aims to reduce the amount of
residual waste incinerated/landfilled from 10 million
tonnes in 2012 to 5 million tonnes in 2022.
Local and regional authorities are creating new networks
on waste-related issues, mainly to support plastic
recovery and recycling. Some 260 municipalities within
the Statiegeld Alliantie are calling for a deposit system for
51
plastic bottles . On 10 March 2018, the State Secretary
for Infrastructure and Water Management announced
that a deposit on small plastic bottles would be
introduced in 2021, unless the packaging industry
managed to achieve 90 % recycling of throw-away bottles
by the autumn of 2020. She also urged the packaging
52
sector to reduce street litter by 70 to 90 % .
Figure 6: Recycling rate of municipal waste 2010-2017
48 2019 priority actions
Introduce new policies, including economic
instruments, to promote waste prevention, make
reuse and recycling more economically attractive.
Shift reusable and recyclable waste away from
incineration.
Climate change
The EU has committed to undertaking ambitious climate
action internationally as well as in the EU, having ratified
the Paris Climate Agreement on 5 October 2016. The EU
targets are to reduce greenhouse gas (GHG) emissions by
20 % by 2020 and by at least 40 % by 2030, compared to
1990. As a long-term target, the EU aims to reduce its
emissions by 80-95 % by 2050, as part of the efforts
However, more effort will be needed to comply with required by developed countries as a group. Adapting to
49
recycling targets for the post-2020 period . This will in the adverse effects of climate change is vital to alleviate
particular require action to reduce the incineration of its already visible effects and improve preparedness for
municipal waste (44 % in 2017). and resilience to future impacts.
To boost waste prevention and further increase recycling The EU emissions trading system (EU ETS) covers all large
rates, the 2016 programme for a circular economy (A greenhouse gas emitters in the industry, power and
50
circular economy in the Netherlands by 2050) aims in aviation sectors in the EU. The EU ETS applies in all
Member States and has a very high compliance rate. Each
47
year, installations cover around 99 % of their emissions
Eurostat, Municipal waste by waste operations.
48 with the required number of allowances.
Eurostat, Recycling rate of municipal waste.
49
Directive (EU) 2018/851, Directive (EU) 2018/852, Directive (EU)
2018/850 and Directive (EU) 2018/849 amend the previous waste
legislation and set more ambitious recycling targets for the period up to
2035. These targets will be taken into consideration to assess progress 50 % reduction in the use of primary raw materials (from minerals,
in future Environmental Implementation Reports. fossil fuels and metals) by 2030.
50 51
Government of the Netherlands, A Circular Economy in the Statiegeld Alliantie, Demand for deposit schemes continues to grow.
52
Netherlands by 2050. The programme aims at developing a circular Government of the Netherlands, Breakthrough in combating plastic
economy in the Netherlands by 2050. It sets an (interim) objective of a soup (press release).
10Environmental Implementation Review 2019 – the Netherlands
For emissions not covered by the EU ETS, Member States platforms: built environment, industry, agriculture and
have binding national targets under ‘effort sharing’ land use, mobility, and electricity. Each platform was
53
legislation . The Netherlands had lower emissions than asked to map out the measures required for a 55 %
its annual targets in each of the years 2013-2017. For emission reduction.
2020, the Netherlands’ national target under the Effort
Figure 8: Targets and emissions under the Effort Sharing
Sharing Decision is to reduce emissions by 16 % 57
Decision and Effort Sharing Regulation
compared to 2005. For 2030, the target will be to reduce
emissions by 36 % compared to 2005 (see Figure 8).
Figure 7: Change in total GHG emissions 1990-2017
54
(1990=100 %) .
Focus is also necessary on transport, as this represents
almost a quarter of the EU’s GHG emissions and is the
main cause of air pollution in cities. Transport emissions
fell by 8 % from 2012 to 2015in the Netherlands.
The national energy and climate plan will be partly based
55 Figure 9: Greenhouse gas emissions by sector (Mt CO 2-
on the Energy Agenda . The Energy Agenda was adopted 58
at the end of 2016 and focuses on GHG emission eq.). Historical data 1990-2016. Projections 2017-2030
reductions needed to achieve the climate goals agreed in
Paris in 2015.
The low-carbon development strategy explores the
concept of a climate-neutral economy. The new
government has committed to a more ambitious climate
policy, which will be laid down in a new Climate Law and
a national Climate Agreement next to the existing Energy
56
Agreement . The National Climate Agreement, the Dutch
contribution to "Paris", has one central goal, which is to
reduce GHG emissions in the Netherlands by at least
49 % in 2030 compared to 1990. Additionally, the Dutch
government's efforts in a European context could result
in an even more ambitious target towards 55 %.
To come to a Climate Agreement with organisations and
companies, conversations are taking place on five sector
According to EU Law, and to control emissions from
fluorinated GHGs (F-gases), Member States must
53
See Regulation (EU) 2018/842.
54
European Environmental Agency, Annual European Union greenhouse
57
gas inventory 1990–2016. Proxy GHG emission estimates for 2017, European Environmental Agency, Annual European Union greenhouse
Member States national projections. gas inventory 1990–2016. Proxy GHG emission estimates for 2017,
55
Government of the Netherlands, Energy Agenda: Towards a low- Member States national projections.
58
carbon energy supply. European Environmental Agency, Annual European Union greenhouse
56
Sociaal-Economische Raad, Agreement on Energy for Sustainable gas inventory 1990–2016. Proxy GHG emission estimates for 2017,
Growth, 2013. Member States national projections.
11Environmental Implementation Review 2019 – the Netherlands
introduce training and certification programmes and auctioning revenues has been reported as spent on
rules for penalties, and must notify the Commission these climate and energy purposes.
measures by 2017. The Netherlands has notified the
Commission both measures.
2019 priority action
In this report, no priority actions have been included on
The accounting of GHG emissions and removals from
climate action, as the Commission will first need to assess
forests and agriculture is governed by the Kyoto Protocol.
A preliminary accounting exercise for the period 2013- the draft national energy and climate plans which the
2016 shows that the Netherlands had net debits of, on Member States needed to send by end of 2018. These
plans should increase the consistency between energy
average, 0.7 Mt CO2-eq, which corresponds to a negative
and climate policies and could therefore become a good
contribution of -0.6% of the EU-28 accounted sink of -
115.7 Mt CO2-eq. The Netherlands is one of six EU example of how to link sector-specific policies on other
interlinked themes such as agriculture-nature-water and
Member States which showed net debits in this
transport-air-health.
preliminary accounting exercise.
The EU Strategy on adaptation to climate change,
adopted in 2013, aims to make Europe more climate-
resilient, by promoting action by Member States, better-
informed decision making, and promoting adaptation in
key vulnerable sectors. By adopting a coherent approach
and providing for improved coordination, it seeks to
enhance the preparedness and capacity of all governance
levels to respond to the impacts of climate change.
The Netherlands adopted its first national adaptation
strategy in 2007. Adaptation policy has two components:
the 2016 national climate adaptation strategy ‘Adapting
59
with ambition’ (December 2016, following an initial
adaptation strategy from 2007) and the 2010 Delta
programme. The adaptation strategy complements the
60
Delta programme . It describes how climate change will
affect life in the Netherlands, drawing particular
attention to those effects which are likely to have
significant impact in the years ahead, such as water
management, health, agriculture and forestry,
recreation, infrastructure and energy.
Through its role complementing the national climate
adaptation strategy, the Delta programme involves many
adaptation measures. The aim is to ensure that flood risk
management, freshwater supply and spatial planning will
be climate-proof and water-resilient by 2050, in the face
of increasing weather extremes. A Delta plan on spatial
61
adaptation has been published . In line with the 2014
Delta decision on spatial adaptation, it specifically adopts
a territorial approach. The action programme on
adaptation was launched in March 2018 and the
monitoring and evaluation framework is being set up.
Total revenue from auctioning emission allowances
under the EU ETS for 2013-2017 was EUR 786 million. The
Netherlands does not earmark auctioning revenue for
specific uses. An amount equalling 100 % of the
59
Government of the Netherlands, National Climate Adaptation
Strategy, 2016.
60
Government of the Netherlands, Delta Programme.
61
Government of the Netherlands, Delta Plan on Spatial Adaptation
2018.
12Environmental Implementation Review 2019 – the Netherlands
2. Protecting, conserving and enhancing natural capital
been observed in the country and still need to be
Nature and biodiversity addressed, plus some potential gaps in the SPA
67
network .
The EU biodiversity strategy aims to halt the loss of
biodiversity in the EU by 2020. It requires full Farmland bird populations continue to experience
implementation of the Birds and Habitats Directives to significant population declines despite protection
achieve favourable conservation status of protected measures. For example, populations of the oystercatcher
species and habitats. It also requires that the agricultural (Haematopus ostralegus), the black-tailed godwit (Limosa
and forest sectors help to maintain and improve limosa) and the skylark (Alauda arvensis) have declined
biodiversity. by more than 60 % between 1990 and 2015.
Dutch overseas countries and territories benefited from
Biodiversity strategy calls under the BEST 2.0 Programme68.
62
Various Dutch policy plans together serve as a revised
national biodiversity strategy and action plan. Based on Progress in maintaining or restoring favourable
the recommendations of the Taskforce on Biodiversity conservation status of species and habitats
and Natural Resources, the document ‘Natural capital Member States report only every 6 years on progress
agenda: conservation and sustainable use of made under the two directives, so no new information is
63
biodiversity‘ sets the biodiversity implementation available on the state of natural habitats and species, or
agenda to 2020 for the Netherlands and the Dutch on progress made in improving the conservation status of
64
Caribbean . species and habitats, since the 2017 EIR. However, it is
65 clear that there are still certain situations of non-
The ‘government vision 2014’ advocates a shift in
thinking about nature policy, from protecting nature compliance in relation with the insufficiency of the
from society towards strengthening nature with society. network (SPAs and SCIs) and qualitative aspects of some
Biodiversity targets should be reached by using all management plans in place.
opportunities for synergy between the value of nature 2019 priority actions
and social and economic activities.
Further optimise the contribution of Natura 2000
Setting up a coherent network of Natura 2000 sites and national nature protection networks to
achieving good conservation status, in particular by
By early 2018, 13.3 % of the national land area of the
ensuring sufficient resources for full implementation
Netherlands was covered by Natura 2000 (EU average
of the Natura 2000 management plans in order to
18.1 %). Special areas of protection (SPAs), under the
maintain/restore species and habitats of community
Birds Directive, covered 11.5 % (EU average 12.3 %) and
interest to a favourable conservation status across
Sites of community importance (SCIs), under the Habitats
66 their natural range.
Directive, covered 8 % (EU average 13.8 %) .
Reduce habitat fragmentation, atmospheric nitrogen
deposition, desiccation and acidification.
Designating Natura 2000 sites and setting conservation
Take the necessary measures to halt the decline of
objectives and measures
meadow and farmland birds and to re-establish a
The latest assessment of the Natura 2000 network shows sufficient area and diversity of habitats for them.
that the Netherlands has largely completed its Natura
2000 network on land and on sea. There are a few minor
gaps, mainly concerning species that have only recently
62
Ministry of Economic Affairs, The Natural Way Forward: Government
67
Vision 2014, 2014. For each Member State, the Commission assesses whether the
63
Ministry of Economic Affairs, Natural Capital Agenda, 2014. species and habitat types listed in Annexes I and II of the Habitats
64
Ministry of Economic Affairs, Nature Policy Plan for the Caribbean Directive are sufficiently represented by the sites designated to date.
Netherlands, 2014. This is expressed as a percentage of species and habitats for which
65
Ministry of Economic Affairs, The Natural Way Forward: Government further areas need to be designated in order to complete the network
Vision 2014, 2014. in that country. The current data, which were assessed in 2014-2015,
66
The figures do not add up because some sites are designated as both reflect the situation to December 2013.
68
SCIs and SPAs. Special Areas of Conservation (SACs) are SCIs designated BEST, Voluntary Scheme for Biodiversity and Ecosystem Services in
as such by the Member States. Territories of European Overseas.
13Environmental Implementation Review 2019 – the Netherlands
Maintaining and restoring ecosystems and than specific habitats or species, and opportunities for
their services increasing the value of nature are considered.
Since 2016, groups of farmers have been allowed to
The EU biodiversity strategy aims to maintain and restore apply for subsidies in areas with high potential to
ecosystems and their services by including green increase natural value. These subsidies aim to
infrastructure in spatial planning and restoring at least 15 complement the NEN. The NEN is protected by spatial
% of degraded ecosystems by 2020. The EU green planning schemes in provincial regulations and listed as a
infrastructure strategy promotes the incorporation of national priority in the national policy strategy for
green infrastructure (GI) into related plans and infrastructure and planning (Structuurvisie Infrastructuur
74
programmes. en Ruimte) . In that strategy, ´building with nature´ is
The EU has provided guidance on the further deployment mentioned as a way to create nature value within other
69
of green and blue infrastructure in the Netherlands and tasks. National and local authorities, businesses and non-
a country page on the Biodiversity Information System governmental organisations (NGOs) are working together
70
for Europe (BISE) . This information will also contribute to incorporate nature into infrastructure (highways,
to the final evaluation of the EU Biodiversity Strategy to railways, waterways) through green deals. These forms of
2020. infrastructure, and ecological barriers formed by highly
intensive agricultural areas, are the main challenges for
The Netherlands has several policies and strategies GI.
including relevant green infrastructure measures. The
National Ecological Network (NEN)
71
includes existing Water-related projects and nature restoration
protected areas and areas that need to be restored, and The Netherlands excels at water-related projects and
is intended to be connected to other European countries, nature restoration (on former agricultural lands).
but the extent of progress is unclear. Examples include projects such as the Sand Motor and
75
the Marker Wadden and the transformation of 80 000
hectares of agricultural lands, which have been included
in the NEN. Another interesting approach is that of the
project Temporary Nature, which enables flora and fauna
to emerge on wasteland areas. To prevent developers
from having to compensate for habitats that have
emerged, when the building project is carried out, a
green deal with the national government allows
developers to be exempted from the Flora and Fauna
Law — so there is no incentive to try to keep out
protected species from temporary waste ground. This
way, a temporary habitat can be created or naturally
emerge on waste land.
76
The NEN is complemented by the policy documents ‘The The National Green Fund (Nationaal Groenfonds)
72
Natural Way Forward: Government Vision 2014’ , which finances projects that improve the quality of the natural
promotes ‘nature combinations’ (combining nature with environment. Green deals are another way to promote
agriculture, private estates, recreation, water extraction, and sometimes finance sustainable projects. Several
cities, business areas, waterways, etc.) and ‘Nature projects also receive co-finance from the EU.
73
ambition for large waters’ . The latter envisages
The Netherlands has developed a dynamic strategic
optimising ecosystem services in the major national
framework for setting priorities for ecosystem
waters.
restoration at sub-national and national level. The
GI has been included in water management. New water framework has four layers; (1) its prioritised action
management measures focus on natural processes rather framework for Natura 2000, (2) its national ecological
network, (3) its policy strategy for large waters, and (4)
69
smaller national projects. It will be regularly updated.
The recommendations of the green infrastructure strategy review
report and the EU Guidance on a strategic framework for further
supporting the deployment of EU-level green and blue infrastructure.
70
Biodiversity Information System for Europe.
71 74
Government of the Netherlands, National Ecological Network (NEN). Government of the Netherlands, Summary of the national policy
72
Ministry of Economic Affairs, The Natural Way Forward, 2014. strategy for infrastructure and spatial planning.
73 75
Ministry of Economic Affairs, Natuurambitie Grote Wateren 2050 en University of Delft, Marker Wadden: Building wetlands with soft mud.
76
verder, 2014. Government of the Netherlands, Green Deals.
14Environmental Implementation Review 2019 – the Netherlands
Estimating natural capital NCW, CSR Netherlands, IUCN Netherlands and the
83
professional body for accountants NBA have joined
The EU biodiversity strategy calls on Member States to forces with the government to scale up natural capital. It
map and assess the state of ecosystems and their offers business-to-business solutions, insights, events and
77 — most importantly — a relevant business network
services in their national territories by 2014, assess the
economic value of such services and integrate these working on natural capital in the Netherlands. The
84
values into accounting and reporting systems at EU and Leaders for Nature network brings together 20
national level by 2020. multinationals and major Dutch enterprises aiming to
make ecosystem thinking central to business decision-
The Netherlands has implemented the Mapping and making.
Assessment of Ecosystems and their Services (MAES) via In November 2016 and 2017, the Netherlands co-hosted
78
its Atlas of Natural Capital and the development of a 85
the first and second WAVES policy forums . WAVES
79
system of National Natural Capital Accounts , leading (Wealth Accounting and the Valuation of Ecosystem
efforts on ecosystem accounting. Services) is a World Bank-led global partnership to
To enhance the applicability of the data, CBS developed a promote sustainable development by ensuring that
natural capital model based on the national land cover natural resources (including ecosystems and ecosystem
and ecosystems unit maps. The model consists of a set of services) are mainstreamed in development planning and
input maps, a simulation tool and output maps which set national economic accounts. The Netherlands supports
out the relationship between the ecosystems and the this programme with expertise from CBS and PBL.
services they provide and that is consistent with the At the final Esmeralda workshop and MAES Working
United Nations System of Environmental Economic Group meeting in Brussels in September 2018, the
Accounting (SEEA). The applicability of the maps is now Netherlands was shown to be one of the leading
being tested in various pilot studies. countries when it comes to the implementation of MAES
80 (Figure 10). This assessment was produced by the
The TEEB project has delivered a tool which calculates
the monetary value of green areas in cities. Over 20 Esmeralda project based on 27 questions about
municipalities, several research institutes and other implementation and is updated every 6 months.
relevant parties agreed to cooperate on improving and Figure 10: Implementation of MAES (September 2018)
86
integrating the existing tools for better decision-making
on natural capital.
Wageningen Environmental Research, in cooperation
with the PBL, the RIVM and the Belgian INBO and VITO,
has started a project to create a tool for devising
scenarios for natural capital. This instrument should
enable authorities, assessment agencies, companies and
other stakeholders to estimate the effects of strategies or
policies on natural capital and ecosystem services. The
project also aims to provide a range of practical The Commission encourages the Netherlands to continue
approaches to natural capital for various actors. sharing its experience with other Member States.
Business, nature organisations and governments have set Business and biodiversity platforms, networks and
81
up an online platform, ‘Naturalcapital.community’ to communities of practice are key tools for promoting and
scale up the application of natural capital principles in facilitating natural capital assessments (NCA) among
daily business practice. business and financial service providers, for instance via
82
The Natural Capital Community is part of the Dutch the Natural Capital Protocol designed by the Natural
87
societal programme for natural capital, a national Capital Coalition . NCAs help private business to better
programme in which the employers’ organisation VNO- understand and put a value not only on their impacts, but
77 83
Ecosystem services are benefits provided by nature such as food, Koninklijke Nederlandse Beroepsorganisatie van Accountants,
clean water and pollination on which human society depends. website.
78 84
Atlas of Natural Capital, website. International Union for Conservation of Nature (IUCN) National
79
The system will be completed in 2019, and the regular monitoring Committee of the Netherlands, Leaders for Nature.
85
implemented in 2020. WAVES Partnership, WAVES Hosts the First Policy Forum with the
80
TEEB, The Economics of Ecosystems and Biodiversity. Netherlands Government.
81 86
MVO Nederland, Naturalcapital.community. Esmeralda project, website.
82 87
MVO Nederland, Naturalcapital.community. Natural Capital Protocol, Natural Capital Coalition.
15You can also read