COVID-19 is also a reallocation shock - Jose Maria Barrero, Instituto Tecnológico Autónomo de México Nick Bloom, Stanford University Steven J ...
←
→
Page content transcription
If your browser does not render page correctly, please read the page content below
BPEA Conference Drafts, June 25, 2020

COVID-19 is also a reallocation shock
Jose Maria Barrero, Instituto Tecnológico Autónomo de México
Nick Bloom, Stanford University
Steven J. Davis, University of Chicago
Conflict of Interest Disclosure: The authors did not receive financial support from any firm or person
for this paper or from any firm or person with a financial or political interest in this paper. They are
currently not officers, directors, or board members of any organization with an interest in this paper.
No outside party had the right to review this paper before circulation. The views expressed in this paper
are those of the authors, and do not necessarily reflect those of the Instituto Tecnológico Autónomo de
México, Stanford University, or the University of Chicago.
COVID-19 Is Also a Reallocation Shock

 Jose Maria Barrero, Nick Bloom and Steven J. Davis

 5 May 2020, last edited on 21 June 2020

 Abstract

Drawing on firm-level forecasts at a one-year horizon in the Survey of Business Uncertainty
(SBU), we construct novel, forward-looking reallocation measures for jobs and sales. These
measures rise sharply after February 2020, reaching rates in April that are 2.4 (3.9) times the pre-
COVID average for jobs (sales). We also draw on special SBU questions to estimate that the
COVID-19 shock caused 3 new hires for every 10 layoffs, that 32-42% of COVID-induced layoffs
will be permanent, and that one-tenth of all work days (one-fifth for office workers) will shift from
business premises to residences in the post-pandemic world relative to the pre-pandemic situation.
Our survey evidence aligns well with anecdotal evidence of large pandemic-induced demand
increases at many firms, evidence on job openings, gross job creation and gross business
formation, and a sharp pandemic-induced rise in equity return dispersion across firms. After
developing the evidence, we consider implications for the economic outlook and for policy
responses to the pandemic. Unemployment benefit levels that exceed worker earnings, policies
that subsidize employee retention, land-use restrictions, occupational licensing restrictions, and
regulatory barriers to business formation will impede reallocation responses to the COVID-19
shock.

JEL Numbers: D22, D84, E24, H12, H25, J21, J62, J63, J65, R32

Keywords: COVID-19, coronavirus, reallocation shock, layoffs, working from home, Survey of
Business Uncertainty, CARES Act

Acknowledgements: We thank Katherine Abraham, Dave Altig, Joseph Beaulieu, Jason
Cummins, Eddie Lazear, Brent Meyer, Adam Milsap, Giuseppe Moscarini, Jim Stock and
seminar participants at CBO, IGIER and the IMF for helpful comments and Emil Mihaylov for
outstanding research assistance. We gratefully acknowledge financial support from the Federal
Reserve Bank of Atlanta, the Sloan Foundation, Stanford University, and the University of
Chicago Booth School of Business.
The COVID-19 pandemic and efforts to contain the virus are exacting a staggering economic
toll in countries around the world. China’s economy shrank 6.8 percent in the first quarter of
2020 on a year-on-year basis, and Eurozone economies shrank at a 14.8 percent annualized rate.
In the United States, nearly 28 million persons filed new claims for unemployment benefits over
the six-week period ending April 25.1 The U.S. economy shrank at an annualized rate of 4.8
percent in the first quarter of 2020, and many analysts project it will shrink at a rate of 25% or
more in the second quarter. 2 Yet, even as much of the economy is shuttered, some firms are
expanding in response to pandemic-induced demand shifts. As the Wall Street Journal put it,
“The coronavirus pandemic is forcing the fastest reallocation of labor since World War II, with
companies and governments mobilizing an army of idled workers into new activities that are
urgently needed.”3 In other words, Covid-19 is also a major reallocation shock.

 We develop evidence on the extent and character of this reallocation shock for the U.S.
economy. We start with anecdotal evidence, drawing on news reports and other sources.
Anecdotal evidence is useful for its immediacy, as a source of hypotheses, and for insights into
broader forces. Next, we turn to the Survey of Business Uncertainty (SBU) to construct novel,
forward-looking measures of expected sales and job reallocation across American firms at a one-
year look-ahead horizon. The SBU is a monthly panel survey developed and fielded by the
Federal Reserve Bank of Atlanta in cooperation with Chicago Booth and Stanford.

 We use firm-level employment forecasts in the SBU to calculate the following quantity: the
gross expected job gains at firms that anticipate growing over the next year plus the gross
expected job losses at firms that anticipate shrinking minus the absolute value of the net change
obtained by summing over all the forecasts. We activity weight the firm-level forecasts in this
calculation and divide by aggregate employment to obtain the expected excess job reallocation
rate at a one-year look-ahead horizon. This statistic quantifies the volume of cross-firm job

1 The unemployment claims data are available at https://oui.doleta.gov/unemploy/claims_arch.asp.
2 As of 31 March, Goldman Sachs projects that U.S. GDP will fall 34 percent (annualized) in the second
quarter of 2020 (Carew, 2020). Baker, Bloom, Davis and Terry (2020) obtain a similar figure using the
estimates implied by an empirical model of disaster effects that Baker, Bloom and Terry (2020) fit to
historical data for 38 countries. According to Blue Chip Economic Indicators report of 10 April 2020, the
mean forecast for U.S. GDP is a 24.5 percent (annualized) drop in the second quarter of 2020.
3 The quotation is from Bender and Dalton (2020).

 1
reallocation in excess of the amount needed to accommodate the aggregate net change. It is the
forward-looking analog to the backward-looking measures of excess job reallocation examined
in Dunne, Roberts and Samuelson (1989) and Davis and Haltiwanger (1992). 4

 Our measure of the expected excess job reallocation rate rises from 1.5 percent of
employment in January 2020 to 5.4 percent in April. The April value is 2.4 times the pre-COVID
average and is, by far, the highest value in the short history of the series. We also use firm-level
sales forecasts in the SBU to compute the expected excess sales reallocation rate at a one-year
forecast horizon. Expected sales reallocation shows a similar time-series pattern, reaching values
from March to June that are four-to-six times the pre-pandemic average. Thus, our expected excess
reallocation rate measures support the view that COVID-19 is a major reallocation shock.

 We also quantify the near-term reallocative impact of pandemic-related developments on
business staffing. For this purpose, we draw on two special questions fielded in the April 2020
SBU. One question asks (as of mid-April) about the coronavirus impact on own-company staffing
since 1 March 2020, and another asks about the anticipated impact over the ensuing four weeks.
Cumulating responses over firms and across these two questions, the data say that pandemic-
related developments caused near-term layoffs equal to 12.8 percent of March 1 employment and
new hires equal to 3.8 percent. In other words, the COVID-19 shock caused 3 new hires in the near
term for every 10 layoffs. Similarly, the Job Openings and Labor Turnover Survey (JOLTS)
reports more than 4 hires for every 10 layoffs in March and April. These sizable new hires amidst
a tremendous overall contraction align well with our anecdotal evidence of large pandemic-
induced increases in demand at certain firms. ADP statistics in Cajner et al. (2020) and Census
Bureau statistics on gross business formation also point to high rates of job creation and gross
hiring activity, even in the near-term wake of the pandemic.

4Many later studies consider backward-looking job reallocation measures. See Davis and Haltiwanger
(1999) for a review. For applications of analogous backward-looking reallocation measures to other
outcomes, see Dell’Ariccia and Garibaldi (2005) and Craig and Haubrich (2013) on bank lending, Eisfeldt
and Rampini (2006) on physical capital, Davis et al. (2009) on sales, Broda and Weinstein (2010) on
consumer products, Iacovone and Jovorcik (2010) on export products, Herrera, Kolar and Minetti (2011)
on business credit, and Afonso and Lagos (2015) on the federal funds market.
 2
Next, we draw on special questions put to firms in the May 2020 SBU to quantify the
anticipated shift to working from home after the coronavirus pandemic ends, relative to the
situation that prevailed before the pandemic. To do so, we first ask firms about the share of full
work days performed at home by their full-time employees in 2019. (Responses to this question
for the pre-pandemic situation align well with worker responses to similar questions about working
from home in the 2017-18 American Time Use Survey.) We also ask firms about the share of full
work days performed at home that they anticipate for their full-time employees after the pandemic
is over. Comparing response to the before and after question, we find that full work days performed
at home will triple in the post-pandemic economy. This tripling will involve shifting one-tenth of
all full work days from business premises to residences (and one-fifth for office workers). Since
the scope for working from home rises with worker earnings, the shift in worker spending power
from business districts to locations nearer residences is even greater.

 Finally, we consider time-series evidence on the dispersion in monthly equity returns
across U.S.-listed firms. Return dispersion relates less directly to future reallocation activity, but
its availability over several decades helps us put the COVID-19 episode in perspective. Whether
measured by the interquartile range or the standard deviation of returns in the value-weighted
distribution, the dispersion in equity returns jumps sharply in March 2020, reaching levels last
seen during the financial crisis of 2008-09 and the dot.com bust of the early 2000s. These three
episodes exhibit the highest return dispersion in our sample period, which starts in 1984.

 After presenting the evidence, we consider implications for the economic outlook and for
policy responses to the pandemic. Even if medical advances or natural forces bring an early end
to the health crisis, pandemic-induced shifts in working arrangements, consumer spending
patterns, and business practices will not fully reverse for several reasons. First, more than half of
all employees in the United States were working from home as of May 2020. These employees
and their organizations have, of necessity, learned how to more effectively work and interact
remotely. This type of learning by doing is a source of persistence in new working arrangements.
Second, millions of households have tried online shopping and delivery services in recent
months, and many will continue to value the convenience and (perceived) safety. Third, after
turning to virtual meetings out of necessity, many businesses will find they offer an easier,
cheaper alternative to travel and in-person meetings. Fourth, spurred by the pandemic, businesses
 3
and other organizations are undertaking investments in equipment, infrastructure and platforms
that raise employee effectiveness when working remotely or engaging customers virtually. Fifth,
also spurred by the pandemic, leading technology companies plan to intensify efforts to develop
new products that improve the effectiveness of remote interactivity. Sixth, the pandemic has
knocked down regulations that had inhibited a shift from in-person to virtual interactions,
especially in the delivery of healthcare services.

 Thus, much of the near-term reallocative impact of the pandemic will also persist, as
indicated by our forward-looking reallocation measures and our evidence on the shift to working
from home. Drawing on special questions in the April SBU and historical evidence of how
layoffs relate to realized recalls, we project that 32 to 42 percent of COVID-induced layoffs will
be permanent. We also construct projections for the permanent-layoff share of recent job losses
from other sources, obtaining similar results.

 Historically, creation responses to major reallocation shocks lag the destruction responses by
a year or more. Partly for this reason, we anticipate a drawn-out economic recovery from the
COVID-19 shock, even if the pandemic is largely controlled within a few months. Multiple
forces contribute to delayed creation, as we discuss. Policy responses to major shocks and
inherited features of the policy landscape can further stretch out the creation response, slowing
the recovery. In this regard, we discuss four aspects of U.S. policy that retard creation responses
to the pandemic-induced reallocation shock: Unemployment benefit levels that exceed earnings
for many American workers under the Coronavirus Aid, Relief, and Economic Security
(CARES) Act, policies that subsidize employee retention irrespective of the employer’s longer
term outlook, land-use restrictions that inhibit the reallocation of jobs and workers, occupational
licensing restrictions the impede mobility across occupations and states, and regulations that
inhibit business formation and expansion.

 I. Anecdotal Evidence

 a. Hiring and job reallocation

 Recent news stories highlight the millions of layoffs triggered by the pandemic and
lockdown. They also recount many examples of large-scale hiring. Walmart has hired 235,000
new employees since mid-March and plans to convert many of them to permanent positions.
 4
Amazon has hired 175,000 new employees since March and plans to convert more than 70
percent of them to permanent positions (Herrera, 2020). Dollar General aimed to hire 50,000
new workers by the end of April.5 Lowe’s, the home improvement chain, aimed to hire 30,000
new employees this spring (Tyko, 2020). As of late March, many takeout and delivery-oriented
firms were scrambling to hire workers. Instacart, for example, added 300,000 shoppers to its
payroll, and Domino’s added 10,000 pizza delivery drivers (Bender and Dalton, 2020). Papa
John’s sought 20,000 new employees to meet heightened demand for pizza delivery (Bandolm,
2020). Outschool sought to hire 5,000 new teachers in the last two weeks of March to offer more
online classes in light of school closures.6 Beyond the massive increase in shipping, delivery and
warehouse staff, there are large surges in demand for contact tracers, thermal monitors, social-
distancing monitors, and decontamination technicians (Green and Matthews, 2020).

 Stafford et al. (2020) describe how COVID-induced “changes to the way people
everywhere work, talk, eat and shop “led to explosive growth at six companies: MarketAxess, an
electronic bond trading platform saw large increases in trading volume and its stock market
value; Discord, a gaming-orienting messaging app, has morphed into a home school aid; Nissin
Foods, a producer of instant noodles with 36 factories in 16 countries, has enjoyed large gains in
sales and profitability; FRP Advisory, which advises firms on restructuring, has experienced a
quadrupling of client numbers; customer orders at Berlin-based Delivery Hero doubled from a
year earlier, leading the firm to open dozens of its own kitchens to service its delivery
operations; retail sales at Lavazza, the Italian coffee firm, grew 15 percent globally and 10
percent in Italy during the first four months of 2020 as compared to 2019. A recent Financial
Times report (2020) identifies the 100 publicly listed companies with the largest market
capitalization gains in 2020 and briefly explains how pandemic-induced shifts are benefiting
each company. Heading the list are Amazon, Microsoft, Apple, Tesla, Tencent, Facebook,
Nvidia, Alphabet, PayPal and T-Mobile. Other companies on the list include Netflix, Shopify,
Zoom Video, Adobe, Abbvie, Alibaba, Home Depot, Roche and Regeneron Pharmaceuticals.

5See https://careers.dollargeneral.com. Accessed on 19 April 2020.
6See https://blog.outschool.com/outschool-needs-5-000-teachers-to-start-offering-live-online-classes-
outschool-needs-5-000-teachers-to-start-offering-live-online-classes-in-the-next-2-weeks/. Accessed on
19 April 2020.
 5
Some companies formed partnerships that exploit the reallocative nature of the COVID-
19 shock to speed hiring. Supermarket chain Kroger created an exchange with Sodexo, Sysco
and Marriott International to hire workers laid off from food-service and hospitality firms. CVS
Healthcare sought to recruit 50,000 new staff by partnering with the Hilton hotel chain, clothing
retailer Gap, and Delta Airlines (Weber, 2020). Uber now lists job openings at 7-Eleven,
Amazon and McDonald’s and a dozen other companies for its unemployed drivers (Lee, 2020a).

 The near-term reallocative effects of the COVID-19 shock are also evident in consumer
spending patterns. Earnest Research, a data analytics firms, tracked credit and debit card
purchases for nearly six million Americans to assess the impact of the COVID-19 shock on
consumer spending. For the week ending 1 April 2020, their data show that spending on airlines,
hotels, rental cars, taxis, ride sharing and movie theaters was down 75-95 percent relative to
spending in 2019 (Leatherby and Gelles, 2020). Spending on fast food, auto parts, and autos was
down 35 percent, and spending on apparel was down 70 percent. At the same time, spending on
home improvement, video streaming, gaming, food delivery, and online grocers boomed.

 b. Intra-Industry Reallocation

 Perhaps because we often conceptualize the economy in terms of industries and regions,
one might guess that pandemic-induced reallocation will mainly involve cross-industry and
cross-region shifts. A large body of evidence suggests otherwise. Idiosyncratic, employer-
specific factors dominate gross job creation and destruction, while employment shifts between
industries and regions account for only a small share of job reallocation. For example, when
Davis and Haltiwanger (1992) split the U.S. manufacturing sector into about 450 four-digit
Standard Industrial Classifications, between-industry shifts account for only 13 percent of annual
excess job reallocation during the 1970s and 1980s. When they split manufacturing into roughly
a thousand groups defined by the cross product of states and two-digit SICs, between-group
shifts account for only 14 percent of excess job reallocation. This type of finding has been

 6
replicated many times across countries, sectors and time periods.7 Hence, we expect the bulk of
the pandemic-induced reallocation response to occur within industries and regions.

 The restaurant industry provides a salient example of intra-industry reallocation in the
current crisis. A survey by the National Restaurant Association in late March finds that 3 percent
of restaurant owners and operators had permanently closed in response to COVID-19, and
another 11 percent expected to close permanently in the next 30 days (Taylor, 2020). Applying
these figures to the number of U.S. restaurants yields more than 100,000 permanent restaurant
closures in the near-term wake of the COVID-19 shock. At the same time, takeout and delivery-
oriented chains are experiencing a huge demand boom, as illustrated by the anecdotes for
Domino’s Pizza and Papa John’s. Much of this immediate reallocative impact will likely persist.

 Turning to another salient example, an unsettled economy and uncertain outlook favor
large incumbents with deep pockets (Mims, 2020). As Cutter and Thomas (2020) write:

 The biggest players in tech are hoovering up talent in the midst of the coronavirus
 pandemic. As some of Silicon Valley’s most-promising startups lay off workers
 and others freeze hiring, established companies including Apple Inc., Alphabet
 Inc.’s Google and Amazon.com Inc. are pursuing software engineers, data
 scientists, product designers and others. Facebook Inc. says usage has spiked
 during the coronavirus crisis and it is committed to policing platforms ahead of
 the 2020 presidential election, so it will hire more than 10,000 people this year for
 critical roles on its product and engineering teams. The current moment may give
 well-capitalized tech companies a chance to poach skilled workers who until
 recently were gravitating to smaller upstarts, veteran technology recruiters say.
These remarks suggest that the pandemic will induce a reallocation from smaller, younger tech
firms to larger, established ones. A similar dynamic may play out in other industries as
incumbents with deep pockets and established markets attract workers with newly-heightened
concerns about job security.

 A third example highlights the role of new-found concerns about face-to-face
interactions. Before the pandemic, Medicare and Medicaid regulations largely precluded doctors,
nurse practitioners, clinical psychologists and licensed social workers from reimbursement for

7 Davis and Haltiwanger (1999, Table 5) review evidence from studies that span thirteen countries.
Employment shifts between regions and industries account for less than 10 percent of excess job
reallocation in half the studies and 10 to 20 percent in the rest.
 7
patient services provided in virtual consultations. These regulations were cast aside during the
pandemic, unleashing a flood of virtual consultations and surging interest in “telemedicine.”8 In
a recent article in Medical Economics, a publication aimed at healthcare professionals and
business managers, Mann (2020) remarks that telemedicine works “for most medication refills
… urinary tract infections, colds and rashes, diabetes and hypertension follow-ups, lab results,
post-op visits, birth control and fertility, and mental health.” While a pandemic-induced shift to
telemedicine may have little impact on the net demand for medical services, some physician
practices and medical clinics will respond adroitly to the shift, and many will not. Horn (2020)
offers an insightful glimpse into the commercial challenges presented by a partial shift to
telemedicine. As his discussion suggests, there is high potential for a reallocation of customers,
revenues and workers across practices and clinics. A similar dynamic will play out in other
professional, business, and personal services: Some businesses will respond deftly to newly-
intensified customer concerns about face-to-face interactions, and many will not.

 A fourth example pertains to the grocery business and general retail. Concerns about
face-to-face interactions have stimulated huge increases in the demand for online grocery
shopping and delivery services. As of May 2020, online U.S. grocery sales are up an estimated
450 percent from August 2019 and 24 percent from April 2020.9 One-third of U.S. households
used online grocery shopping services in May 2020, more than double pre-pandemic projections
for the month. Many large retailers, including Whole Foods, have hired new staff and re-
configured stores to meet the growing demand for online shopping. Walmart is testing new
technology to autonomously select items from a store room, pack them, and prepare them for
pickup or delivery. Amazon is experimenting with robot-powered fulfillment centers for online
orders. These capacity expansions and investments in new technologies suggest that retailers see
the pandemic as driving a persistent shift from traditional shopping modes to online shopping.
Amazon, Walmart and some other retailers are well positioned to respond to this shift. Many
other retailers are not. So, a large shift in shopping modes also means a reallocation of jobs and
workers across firms. This process is already well underway, as indicated by a wave of recent

8 For a description of these regulatory changes, see the announcements by the Centers for Medicare &
Medicaid Services at www.cms.gov/newsroom.
9 This and other factual claims in this paragraph are based on Lee (2020b).

 8
bankruptcies and massive downsizings at J.C. Penney (general merchandise), J.Crew (apparel),
Nieman Marcus (luxury retailer), Pier 1 (imported household goods), Stage Stores (department
stores), and Victoria’s Secret (lingerie) (Kapner, 2020ab).

 There are also well-documented examples of major past structural transformations that
took the form of intra-industry reallocation. Foster, Haltiwanger and Krizan (2006) attribute
large productivity gains in the U.S. retail sector in the 1990s mainly to a reallocation from small
retail outlets to larger, more productive stores operated by national chains. Walmart, Target,
Home Depot, Staples, Barnes & Noble and Best Buy played significant roles in this process,
expanding at the expense of rivals. Later, the rise of online shopping brought another major
reallocation. In this regard, it’s worth recalling that Amazon began as an online bookseller,
eventually displacing rival booksellers who shifted online too little or too late. The coronavirus
pandemic is accelerating the shift to online shopping.

 II. Systematic Evidence

 a. Constructing Forward-Looking Reallocation Measures

 We construct forward-looking reallocation measures using data from the Survey of
Business Uncertainty (SBU), which samples senior executives in American firms at a monthly
frequency. The SBU covers all 50 states, every major nonfarm industry, and a range of firm sizes.
Core survey questions elicit subjective forecast distributions over own-firm future outcomes at a
one-year look-ahead horizon. (More precisely, the look-ahead horizon is twelve months for
employment and four quarters for sales.) The survey instrument also gathers data for current and
past outcomes. See Altig, Barrero et al. (2020c) for more information.

 Let E , +12 denote the expected level of employment in month + 12 at firm implied
by its subjective forecast distribution at t. Define the corresponding month-t expected employment
growth rate at a 12-month look-ahead horizon as the arc percentage change, 10

10This growth rate measure is symmetric about zero, bounded between -2 and 2, and equal to log changes
up to a second-order Taylor series approximation. Growth rates computed in this manner aggregate exactly
when combined with suitable weights, given by the simple mean of initial and (expected) terminal levels.
 9
E , +12 −
 E , +12 = ,
 0.5( + E , +12 )

where all quantities on the right side derive from survey responses in month . Denote the firm’s
activity weight as ≡ 0.5( + E , +12 ) and aggregate activity as = ∑ . Let +and

 −denote the sets of firms at with positive and negative values, respectively, for E , +12.

 We compute the expected excess job reallocation rate in month t as

 jobs
 E +12 = ∑ ( ) | E , +12 | + ∑ ( ) E , +12 − |∑ ( ) E , +12 |,

 ∈ − +
 ∈

where the first term on the right side is the expected gross job destruction rate over the 12-month
forecast horizon, the second term is the expected gross job creation rate, and the third term is the
absolute value of the expected net employment growth rate.11 We compute the expected excess
sales reallocation rate at a four-quarter forecast horizon in an analogous manner. 12

 Since we use SBU data to construct our forward-looking reallocation measures, we would
like some assurance that the underlying firm-level data contain meaningful forecasts. In this
regard, Altig, Barrero et al. (2020c) and Barrero (2020) show that firm-level growth rate
expectations in the SBU data are highly predictive of realized growth rates. Moreover, firm-level
subjective uncertainty measures in the SBU response are highly predictive of the magnitudes of
firms’ forecast errors and future forecast revisions. Using survey questions with the same design
as the SBU questions, a revision underway of Bloom et al. (2017) finds that plant-level growth
rate expectations in the Census Bureau’s Manufacturing and Organizational Practices Survey are

This approach to growth rate measurement and aggregation has become standard in the literature on
business-level dynamics. See Davis and Haltiwanger (1999).
11 In practice, we winsorize the values at 500 and the E , +12 values at the 1st and 99th percentiles of

the distribution of expected employment growth rates in data pooled over the period from October 2014
to December 2018. These thresholds follow Altig, Barrro et al. (2020c).
12 For sales, we winsorize at the 90th percentile of its distribution in the pooled sample from September

2016 to April 2020. We winsorize E , +12 at the 1st and 99th percentiles of the distribution of expected
sales growth rates in the pooled sample for the period from October 2014 to December 2018. See Altig,
Barrero et al. (2020c) for an explanation of how we obtain arc percentage changes and implied levels of
expected future sales from SBU data on the forecast distribution over future sales growth rates.
 10
also highly predictive of realized outcomes. These studies give us confidence that our forward-
looking reallocation measures reflect meaningful forecasts of firm-level growth rates.

 That said, there are good reasons to think that our SBU-derived measures understate the
expected reallocation rate on average, and that they also understate the rise in expected reallocation
activity in the wake of the pandemic. First, the SBU under samples younger firms, which have
much higher reallocation rates than mature firms. See Altig, Barrero et al. (2020c) for additional
discussion and references to the relevant literature. Second, highly stressed firms are less likely to
respond to surveys, which leads to an understatement of expected destruction activity.13 Third, we
cannot sample firms that will enter in the future, which causes an understatement of expected
creation activity. Thus, we regard our estimates of forward-looking reallocation rates as
conservative in terms of both average levels and the pandemic-induced response.

 b. Expected Excess Reallocation Rates

 Table 1 reports average expected growth rates and excess reallocation rates from
September 2016 to January 2020, before the Covid-19 pandemic impacted the U.S. economy.14
The expected excess reallocation rate averages 0.97 percent for sales and 2.23 percent for jobs.
Figure 1 displays the expected excess job reallocation rate from October 2016 to May 2020. It
rises from 1.54 percent in January 2020 to 5.39 percent in April, which is 2.4 times the pre-COVID
mean. The upward jump from March to April is the largest move in the short history of the series.
Figure 2 shows a similar pattern for the expected sales reallocation rate, which jumps from 0.24
percent in January 2020 to 4.08 percent in March and above 6 percent in May. The March, April
and May values are also the highest in the history of the series, and several times the pre-COVID
mean. In sum, our forward-looking relocation measures confirm that the COVID-19 pandemic is
a large reallocation shock.

13 In line with this remark, the survey response rates among active SBU panelists are 57% in January 2020
60% in February, 57% in March and 52% in April, where “active” panelists are those who responded to
the survey at least once in the previous six months.
14 The SBU first went to field in October 2014, but the early monthly samples were small and our
formulation of the look-ahead questions did not stabilize until September 2016.
 11
Several other countries conduct surveys that could be used to construct forward-looking
reallocation measures like the ones shown in Figures 1 and 2. The U.K. Decision Maker Panel, a
monthly survey that began in August 2016, includes questions patterned after the ones in the SBU
(Bloom et al., 2018). Surveys in Germany, Italy and Japan also collect data on the expectations of
firm-level variables. See Guiso and Parigi (1999), Bachmann and Elstner (2015), Bachman et al.
(2018), Massenot and Pettinichi (2018), Tanaka et al. (2019) and Chen et al. (2019). Thus, it is
feasible to construct forward-looking excess reallocation time series for several countries, which
would be quite helpful in evaluating their predictive content and usefulness for policy makers.

 c. Expected Growth Rates in the Wake of the Pandemic

 Figures 1 and 2 also show the monthly paths of expected employment and sales growth
rates for the period covered by the SBU. Expected twelve-month employment growth fell about
3.4 percentage points from February to May 2020, and expected sales growth fell about 7.3
percentage points from February to April. While these statistics point to a sharp deterioration in
the U.S. economic outlook in the wake of the COVID-19 shock, they are milder than some
projections. One possibility is that SBU firms expect a very large near-term hit from the pandemic
and lockdown in 2020 and a substantial, but partial recovery by April 2021.

 To investigate that possibility, we turn to a special question fielded as part of the April
2020 SBU. The question reads as follows: “What is your best guess for the impact of coronavirus
developments on your firm’s sales revenue in 2020?” The response options are a respondent-
supplied percentage amount, up or down, and no effect. The results, summarized in Table 2, say
that firms expect the coronavirus pandemic to lower their sales by 18-19 percent in 2020. This is
an enormous negative shock, and it is more than twice as large as the fall from January to April
2020 in the average one-year sales forecast. Taken together, the evidence in Table 2 and Figure 2
says that firms in the SBU anticipate a huge negative shock to their sales in 2020 followed by a
considerable but highly incomplete bounce back by April-June 2021.

 d. Gross Hiring and Business Formation in the Pandemic’s Immediate Wake

 The top part of Table 3 presents two questions about the impact of COVID-19 on staffing
levels that appeared in the April 2020 SBU. One question asks about impact on own-company
staffing levels since 1 March 2020, and the other asks about the anticipated impact over the next
 12
four weeks. For each question, the survey instrument allows responses in five categories: number
of permanent layoffs, with no expectation of recall; number of temporary layoffs and furloughs;
hires of new employees; cuts to the number of contractors and leased workers; and additions to
the number of contractors and leased workers. Cumulating the responses to these two questions
and aggregating over firms yields a near-term net contraction (exclusive of quits) equal to 10.8
percent of March 1 employment.15 92 percent of this net contraction happened between March 1
and the mid-April survey response period, and the rest is anticipated to happen over the ensuing
four weeks. Using JOLTS statistics to impute quits, we obtain a net staffing reduction equal to
13.7 percent of March 1 employment, which is very similar to the fall in active employment
among continuing firms that Cajner et al. (2020, Figure 2.B) find over the same time period in
tabulations of ADP payroll records.

 Despite the large negative employment impact of the pandemic and lockdown, the
coronavirus shock caused sizable gross staffing gains over the span of two and one-half months:
new hires equal to 3.8 percent of March 1 employment, and new contractors and leased workers
equal to 0.2 percent. SBU data also say the COVID shock caused gross staffing reductions equal
to 14.9 percent of March 1 employment (17.8 percent inclusive of quits), mostly due to
temporary layoffs and furloughs.16 Echoing our remarks in Section II.a, the under sampling of
young firms in the SBU, the omission of new firms from our sample frame, and the lower
response rates of highly stressed firms are reasons to think our estimates of gross staffing
changes are downwardly biased.

15 Bartik et al. (2020) find a 40 percent employment contraction from 31 January to late March/early April
in their survey of American firms with fewer than 500 employees. The gap between their employment
contraction figure and ours is partly due to their focus on small firms. As they report in their Table 2,
smaller firms in their sample contract more sharply in this period. We also find sharper contractions
among the smallest firms in the SBU. However, the firm-size differential is too small to fully explain the
discrepancy between their estimated employment contraction and ours.
16 We can obtain a corresponding estimate of aggregate gross staffing reductions in the private sector as
follows: There were 152.5 million employees in the nonfarm private sector as of February 2020,
according to the BLS Current Employment Statistics. According to BLS (2017), independent contractors
are 6.9 percent of employment in the Current Population Survey. Multiplying the February 2020 CPS
employment figure by 6.9 percent yields an estimated 10.9 million contract workers. Finally, 17.8% of
163.4 (=152.5 + 10.9) million yields aggregate gross staffing reductions of 28.4 million.
 13
We can restate our results about gross staffing gains and losses in terms that are less
sensitive to these sources of bias. In particular, Table 3 implies that coronavirus-related
developments caused about 3 new hires for every 10 layoffs. If we include contactors and leased
workers, the ratio is about 2.7 gross staffing gains for every 10 gross staffing reductions. JOLTS
data for March and April show 4.3 hires for every 10 layoffs.17 Similarly, Cajner et al. (2020)
find a high incidence of new hires in ADP data for April and May 2020. While it might seem
surprising to find so many hires amidst the sharpest employment contraction since records began,
simultaneous large-scale hiring and separations are a ubiquitous feature of U.S. labor markets.
See, for example, Davis, Faberman and Haltiwanger (2006) and Lazear and Spletzer (2012).

 JOLTS data on job openings also point to large-scale hiring plans in the immediate wake
of the COVID-19 pandemic. There were about 6.2 million job openings in the U.S. private sector
on the last (business) day of January and February 2020, 5.3 million on the last day of March,
and 4.4 million on the last day of April. In other words, job openings after the pandemic struck
were about 71 to 85 percent as large as before it struck. In this regard, it’s important to note that
the JOLTS concept of job openings excludes positions open only to internal transfers, positions
to be filled by recalls from temporary layoffs, and positions that are not available to start within
30 days. According to JOLTS data, actual hires in April 2020 were 60 percent of actual hires in
February. Thus, JOLTS statistics confirm that large-scale hiring activity, actual and planned,
have continued during the pandemic recession, though at a much-reduced pace.

 Census Bureau statistics on gross business formation also point to gross hiring activity in
the near-term wake of the pandemic, again at a slower pace than pre-COVID. These statistics
derive from administrative data on applications for a new Employer Identification Number (EIN)
on IRS Form SS-4. Figure 3 reports statistics for “high-propensity” applications, which are the
subset of applications for a new EIN that the Census Bureau regards as having a high propensity

17The JOLTS sample is much larger than the SBU sample, and presumably more representative of the
U.S. private sector. SBU-based statistics are available much earlier, which is a major advantage in the
wake of a huge and atypical shock. We first reported Table 3 on 1 May in Altig, Barrero et al., (2020b),
while the JOLTS-based statistics for April were first reported on 9 June. Note that the two surveys also
ask somewhat different questions: The SBU asks explicitly about the causal impact of COVID-19
developments. In contrast, the JOLTS askes about all hires and separations, regardless of cause.
 14
to hire paid employees. The figure makes three points. First, gross business formation rates in the
second half of March and throughout April are down 20 to 38 percent relative to the same week
in the 2019. Second, and perhaps surprisingly, high-propensity business applications continue at
the pace of 20-30 thousand per week. While depressed, business formation did not dry up in the
immediate wake of the COVID-19 shock. Third, new business applications began to recover in
May and by the end of May were down less than five percent from a year earlier. In sum, new
business formation was greatly depressed, but not moribund, in the wake of the COVID-19
shock, and it has mostly recovered from its post-pandemic lows.

 The statistical evidence in Table 3 and Figure 3 align well with the anecdotal evidence in
Section I of large pandemic-induced demand increases at certain firms, even as layoffs in the
U.S. economy exceeded thirty million. At the risk of belaboring the obvious, it’s also worth
remarking on an important distinction between the evidence in Table 3 and Figure 3, on the one
hand, and Figures 1 and 2 on the other. Table 3 speaks to the near-term reallocative impact of the
COVID-19 shock, and Figure 3 provides evidence that job-creating business formation continues
in the face of the pandemic and lockdown. In contrast, Figures 1 and 2 provide evidence that the
shock is expected to trigger unusually large rates of job and sales reallocation across firms over
the next year. Thus, our evidence speaks to both near-term and medium-term reallocative effects
of the COVID-19 shock.

 e. The Shift to Working from Home

 COVID-19 has led to a huge social experiment in working from home. To quantify this
phenomenon, we surveyed 2,500 U.S. residents aged 20-64 who earned more than $20,000 in
2019. Figure 4 summarizes their current work status as of late May 2020 based on responses to
the following question: “Currently (this week) what is your work status?” Response options are
“Working on my business premises,” “Working from home,” and other options that Figure 4
groups under “Not working.” Nearly 42 percent of our 2,500 respondents report working from
home (50 percent on an earnings-weighted basis). Adjusting for those not working, our survey
results say that 62 percent of labor services were supplied from home as of late May (67 percent
on an earning-weighted basis). In an independently conducted survey, Brynjolfsson et al. (2020)

 15
find that 50 percent of employed persons were working from home as of early May. Both
surveys confirm that COVID-19 has triggered a massive shift to working from home.

 Anecdotal accounts and economic reasoning suggest that much of this shift will persist.
For example, Horwitz (2020) reports that Facebook will move to a “substantially remote
workforce over the next decade” in response to the “dispersed structure that the coronavirus
pandemic forced on it.” Facebook foresees a gradual shift to working from home, because it
“will require new techniques and tools to compensate for the loss of in-person office
interactions.” Given its success in creating platforms and tools for remote interactivity,
Facebook’s efforts to develop better tools for remote worker interactions are likely to have an
outsized impact on the overall extent of working from home.

 A large, permanent shift to working from home would have powerful effects on the
spatial distributions of jobs, labor supply, and worker spending, with profound implications for
the future of cities. Motivated by these considerations, we posed two questions in the mid-May
SBU to assess how firms expect COVID-19 to change the extent of working from home after the
pandemic recedes. To get a pre-pandemic starting point, we asked “What percentage of your full-
time employees worked from home in 2019?” And, to gauge the post-pandemic situation, we
asked “What percentage of your full-time employees will work from home after the coronavirus
pandemic?” For each question, we let firms sort their full-time employees into five categories,
ranging from the share that works from home five full days per week to the share that rarely or
never works from home.

 Table 4 summarizes the employment-weighted survey responses by firms as well as
worker responses to a similar question in the 2017–18 American Time Use Survey (ATUS). The
firm-side SBU and worker-side ATUS yield quite similar pre-COVID results. Both surveys say
90 percent of employees rarely or never worked from home, and a very small fraction worked
from home five full days per week. 18 As reported in the rightmost column, about 5 to 6 percent

18For SBU industry sectors that we can match directly to ATUS statistics, the two data sources imply a
similar incidence of working from home before COVID-19. For manufacturing, SBU data say 9 percent
of employees worked at home at least one day a week prior to COVID-19, and the ATUS data that 7.3
percent did so. For retail and wholesale trade, the corresponding figures are 4.1 percent and 4.0 percent,
respectively.
 16
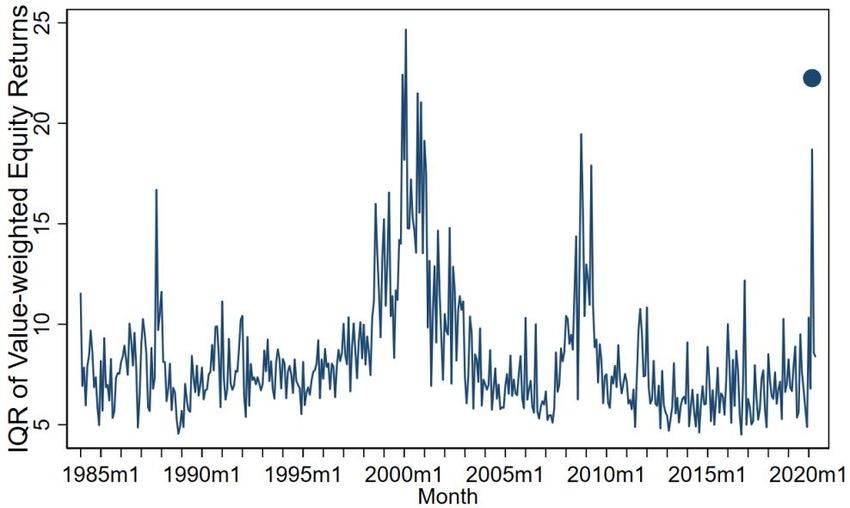
of full working days were performed at home before the pandemic hit. According to the SBU
results, the anticipated share of full working days at home is set to triple after the pandemic
ends—rising from 5.5 percent to 16.6 percent of all working days. Put differently, more than
one-tenth of full work days will shift from business premises to residences. The implied spatial
shift in worker spending is greater yet, because the scope for working from home is strongly
positively correlated with earnings (Dingel and Nieman, 2020).

 As reported in Table 5, firms in every sector anticipate a large shift to working from
home. Consider Finance, Insurance, Professional Services and Business Services, industries that
disproportionately employ well-paid office workers in city business districts. Firms in this sector
anticipate that full work days at home by full-time employees will rise from 10.7 percent of all
work days before the pandemic to 29.2 percent after the pandemic. These figures say that 21
percent of full work days performed on business premises before COVID-19 will switch to
working from home.19 This statistic implies a huge, persistent shift in worker spending power
away from central business districts to locations closer to residences.

 f. Dispersion in Equity Returns Across Firms

 Tables 1-5 and Figures 1-4 draw on data sources with short histories, which makes it hard
to situate the evidence in a broad historical context. Thus, we turn to time-series evidence on the
dispersion of returns across the common equity securities of U.S.-listed firms.20 Specifically, we
compute the interquartile range and the standard deviation of value-weighted returns across firms
using closing market prices from the end of one month to the end of the next. We consider return
dispersion rather than the excess reallocation of equity value given the predominant role of
discount rate variation in aggregate stock market moves (e.g., Shiller, 1981, Campbell and
Shiller, 1988, and Cochrane, 2011). If discount rates on risky securities generally rose in reaction
to the COVID-19 shock, an excess reallocation measure would obscure heterogeneity in the

19Calculated as 100 times (29.2 – 10.7)/(100 -10.7).
20We are hardly the first to use the dispersion in stock returns as a proxy for reallocative shocks. See, for
example, Loungani, Rush and Tave (1990), Brainard and Cutler (1993) and Davis, Loungani and
Mahidhara (1997). Unlike these earlier works, which focus on cross-industry return dispersion, we
consider the dispersion in value-weighted returns across firms.
 17
shock’s impact on expected firm-level cash flows.21 In contrast, this heterogeneity shows up in
return dispersion measures if the discount rate variation itself is dominated by common factors.

 Figure 5 displays the dispersion in monthly equity returns from January 1984 to April
2020. Three episodes stand out: the dot-com market bust in the early 2000s, the financial crisis of
2008-2009, and the market’s reaction to the COVID-19 shock in March 2020. The first two
episodes involve high return dispersion for more than a year and multiple peaks. It remains to be
seen whether the same pattern will play out this time. Nevertheless, Figure 5 suggests that the
COVID-19 shock triggered unusually large differences across firms in shocks to their expected
future cash flows. That is, the stock return data support the view that the COVID-19 shock had
large reallocative effects among publicly traded firms. When we consider the one-month interval
from 24 February to 21 March, the impact of the COVID-19 shock on the dispersion in returns is
greater yet, as shown by the large dots in Figure 5.22

 Several recent studies provide evidence on the sources of heterogeneity in the COVID-19
impact on listed firms. Hassan et al. (2020) characterize and quantify the concerns that senior
executives express in corporate earnings conference calls. As the pandemic spread from January
to March, executives voiced growing concerns about negative demand shifts, rising uncertainty,
supply chain disruptions, capacity curtailments, and employee welfare. Davis, Hansen and
Seminario (2020) and Ramelli and Wagner (2020) trace COVID-induced differences in firm-
level returns to differences in their exposures to global supply chains, exports to China, food and
drug regulation, energy regulation, and financial regulation. Papanikolaou and Schmidt (2020)
report daily equity returns in 2020 for firms sorted by the share of employees able to work
remotely. From 14 February 2020 to 15 June, the cumulative return differential between the top
and bottom quartiles is 19.4 percentage points, with the bulk of the return differential emerging
by mid-March.23 Pagano et al. (2020) also find much higher returns in the wake of COVID-19 at

21 Our supposition here on the rise in discount rates in reaction to the COVID-19 shock finds support in
Gormsen and Koijen (2020).
22 We chose 24 February, because it is the first large daily move in the U.S. stock market that next-day
journalistic accounts attribute to the COVID-19 pandemic. See Baker et al. (2020).
23 See the third chart at https://sites.google.com/site/lawrencedwschmidt/covid19, accessed on 18 June. 14
February 14 is the baseline date in their chart, and 15 June is the most recent available date.
 18
firms that are “resilient” to social distancing requirements, as measured by ability to perform
jobs at home and without interactions in physical proximity. Resilient firms also enjoyed strong
relative returns from 2014 to 2019, suggesting that the COVID-19 shock reinforced shifts in the
economy that began before the pandemic. This reinforcing aspect of the shock may further raise
unemployment and slow its decline, as argued in Davis (1987). Finally, Pagano et al. provide
evidence that investors continue to price pandemic-related risks into firm-level equity prices as
of May 2020, suggesting they assign material probabilities to future pandemics.

 III. Implications for the Economic Outlook

 a. Reasons to Anticipate a Slow Recovery

 As of 4 June, confirmed cases of COVID-19 exceed 6.7 million, with 395 thousand persons
known to have died from the disease. 24 The weekly death toll in the United States has drifted
downward since late April, but there remains great uncertainty about the future course of the
pandemic and the duration, extent and effectiveness of economic lockdowns and voluntary social
distancing efforts. In particular, we do not know whether a gradual re-opening of the economy
will lead to a major surge in new cases, prompting authorities to re-impose tight restrictions on
commercial activity. Obviously, if the pandemic and partial shutdown linger, the economic
recovery will be delayed. Thus, the future course of the pandemic and containment efforts could
lead to a delayed or sluggish recovery. If global pandemics with serious health consequences
become an oft-recurring phenomenon, they will undercut growth for many years.

 Under an optimistic scenario, the pandemic recedes in the coming weeks and months,
COVID-19 treatments improve, an effective vaccine becomes available and widely deployed
within 12 months, and the economy gradually comes back on line over the next 2-3 months
without serious setbacks. Even in this scenario, we see several reasons to anticipate a lengthy
recovery. U.S. real GDP may not surpass its 2019 level until the latter half of 2021 or later, and
the return path to full employment is likely to take even longer. We turn to the reasons now.

24 See the Johns Hopkins Coronavirus Resource Center at https://coronavirus.jhu.edu/map.html.
 19
The pandemic and lockdown will curtail current and near-term aggregate demand through
several channels. First, labor incomes and profits are severely depressed and will remain so for
some time. Second, economic uncertainty is extraordinarily elevated, which further depresses
consumption expenditures and investment demand. Since uncertainties about the course of the
pandemic and the stringency of social distancing measures are likely to abate in the coming
weeks and months, firms have especially strong incentives to defer investments that are costly to
reverse. Third, temporary disruptions on the supply side of the economy can cause aggregate
demand to fall more than one-for-one with the direct impact of the supply shock (Guerrieri et al.,
2020). Fourth, as we discuss momentarily, the COVID-19 shock has negative effects on the
economy’s productive potential in the future. That lowers expected future incomes, which further
depresses current spending demands by forward-looking agents.

 The overall fall in aggregate demand is massive. While policymakers have aggressively
deploying fiscal and monetary tools to counter this fall, it seems unlikely that they will or can
achieve a full offset. Thus, we expect demand-side forces to depress employment and output for
several months or more.

 We now turn to supply-side considerations, with a focus on developments that influence the
economy’s future productive potential. First, the cash-flow crunch caused by the lockdown,
uncertainty about the future course of the pandemic, concerns about reduced incomes in the near-
and medium-term, and uncertainty about the outlook for growth and product demand are all
likely to depress capital investment for several months or more. Thus, the economy will carry a
smaller stock of productive capital into the future as a consequence of the COVID-19 shock. In
addition, pandemic-induced demand shifts and continuing concerns about infectious disease will
undercut the production value of certain forms of capital such as large-scale entertainment
venues, high-density retail facilities, and restaurants with closely-packed patrons.

 Second, universities, government labs, and commercial facilities have shuttered non-COVID
research projects. Schools have sent students home, and universities are making do with remote
classes. Barrero, Bloom and Wright (2017) and Bansal et al. (2019) provide evidence that R&D
investments are highly sensitive to uncertainty, because they are irreversible and riskier than
investments in physical capital. The same may hold for investments in worker training, strong

 20
managerial practices, and other forms of intangible capital. Given the extraordinarily high levels
of economic uncertainty in the wake of the COVID-19 shock (Altig, Baker et al., 2020),
investment rates in these intangibles are likely to be at least temporarily depressed. Immigration
and trade, facilitators of innovation, have also shriveled. We expect these developments to lower
the trajectory of future productivity into 2021 and beyond.

 The third reason we anticipate a slow recovery on the supply side leads us back to the
pandemic-induced reallocation shock and is the focus of the next section.

 b. Creation Lags Destruction in the Response to Reallocation Shocks

 Davis and Haltiwanger (2001) study the dynamic effects of oil price shocks in the 1970s
and 1980s on job creation and destruction activity in the U.S. manufacturing sector. They find
sizable reallocative effects of oil price shocks spread out over several years. A key message is
that the destruction side of reallocation precedes the creation side by 1-2 years. Employment and
output are depressed in the interim. Reasons for the delayed creation response include the time
needed to plan new enterprises and business activities, the time required to navigate regulatory
hurdles and permitting processes to start or expand businesses, time-to-build in capital formation,
uncertainties that lead to delays in making sunk investments, and search and matching frictions
in forming new relationships with suppliers, employees, distributors, and customers.

 To appreciate why creation responses can lag months and years behind destruction
responses, consider the experience of the American auto industry in the wake of the 1973 oil
price shock.25 As Bresnahan and Ramey (1993) document, the shock increased the demand for
small, fuel-efficient cars and simultaneously reduced the demand for larger cars. Capacity
utilization and output fell in the wake of the oil price shock, even though a handful of plants
equipped to produce small cars operated at peak capacity.

 Several factors made it hard for the industry to respond rapidly to the increased demand
for small, fuel-efficient cars. First, much of the physical capital in the U.S. auto industry was
dedicated to the production of larger rather than smaller cars. Second, U.S. auto workers had
accumulated skills that were specialized in the production of particular models, and these tended

25 This paragraph and the next borrow from Davis and Haltiwanger (2001).
 21
You can also read