Incentivized Resume Rating: Eliciting Employer Preferences without Deception - The Interdisciplinary Center for ...
←
→
Page content transcription
If your browser does not render page correctly, please read the page content below
Incentivized Resume Rating: Eliciting Employer
                      Preferences without Deception
              Judd B. Kessler, Corinne Low, and Colin D. Sullivan∗

                                    November 6, 2018

                                          Abstract

          We introduce a new experimental paradigm to evaluate employer prefer-
      ences for job candidates, called Incentivized Resume Rating (IRR). Employers
      evaluate resumes they know to be hypothetical in order to be matched with
      real job seekers, allowing researchers to randomly assign resume characteristics
      while preserving incentives and avoiding deception. We deploy IRR to investi-
      gate preferences of employers recruiting prestigious college graduates and find
      evidence of discrimination. Employers recruiting for science and engineering
      positions are less interested in hiring females and minorities. Moreover, em-
      ployers believe females and minorities are less likely to accept jobs when offered,
      suggesting a novel channel for discrimination.

   ∗
     The Wharton School, University of Pennsylvania, 3620 Locust Walk, Steinberg
Hall-Dietrich Hall, Philadelphia, PA 19104 (email: judd.kessler@wharton.upenn.edu, cor-
low@wharton.upenn.edu, colins@wharton.upenn.edu). We thank the participants of the NBER
Summer Institute Labor Studies, the Berkeley Psychology and Economics Seminar, the Stanford
Institute of Theoretical Economics Experimental Economics Session, Advances with Field Experi-
ments at the University of Chicago, the Columbia-NYU-Wharton Student Workshop in Experimen-
tal Economics Techniques, and the Wharton Applied Economics Workshop for helpful comments
and suggestions.

                                              1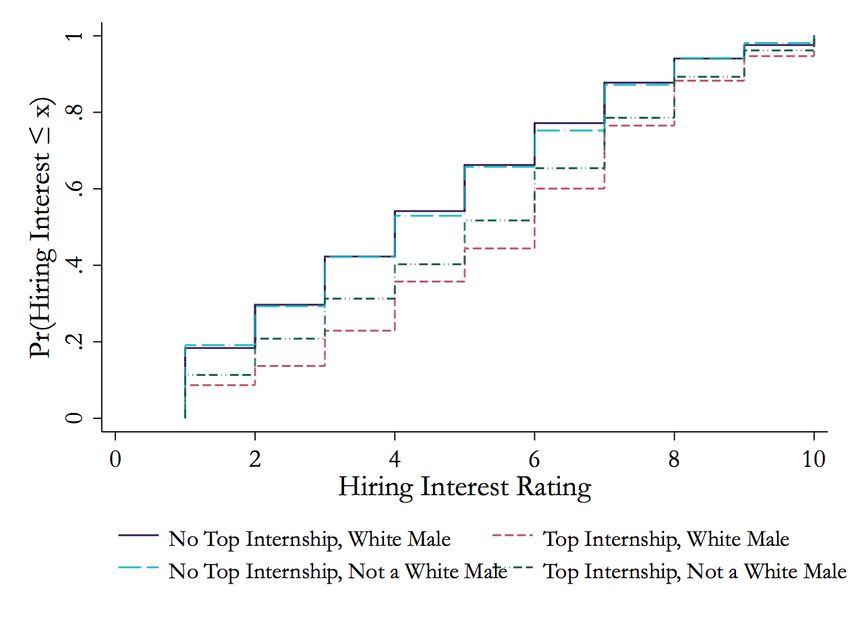
1        Introduction
        How labor markets reward education, work experience, and other forms of human
capital is of fundamental interest in labor economics and the economics of education
(e.g., Autor and Houseman [2010], Pallais [2014]). Similarly, the role of discrimina-
tion in labor markets is a key concern for both policy makers and economists (e.g.,
Altonji and Blank [1999], Lang and Lehmann [2012]). Correspondence audit stud-
ies, including resume audit studies, have become powerful tools to answer questions
in both domains.1 These studies have generated a rich set of findings on discrimina-
tion in settings as diverse as employment (e.g., Bertrand and Mullainathan [2004]),
real estate and housing (e.g., Hanson and Hawley [2011], Ewens et al. [2014]), and
retail (e.g., Pope and Sydnor [2011], Zussman [2013]).2 More recently, resume audit
studies have been used to investigate how employers respond to other characteris-
tics of job candidates, including unemployment spells [Kroft et al., 2013, Eriksson
and Rooth, 2014, Nunley et al., 2017], for-profit college credentials [Darolia et al.,
2015, Deming et al., 2016], college selectivity [Gaddis, 2015], and military service
[Kleykamp, 2009].
        Despite the strengths of this workhorse methodology, resume audit studies also
face some limitations. First, resume audit studies require deception. While there is
generally a prohibition on deception within experimental economics [Ortmann and
Hertwig, 2002], audit and resume audit studies are granted an exception, presum-
ably because of the importance of the questions they tackle combined with a lack
of alternative options to answer them. Second, audit studies generally report call-
back results, which (a) may conflate an employer’s interest in a candidate with the
employer’s expectation of a candidate’s interest in the employer and (b) can only
    1
     Resume audit studies send otherwise identical resumes, with only minor differences associated
with a treatment (e.g., different names associated with different races), to prospective employers and
measure the rate at which candidates are called back by those employers (henceforth the “callback
rate”). These studies were brought into the mainstream of economics literature by Bertrand and
Mullainathan [2004]. By comparing callback rates across groups (e.g., those with White names
to those with minority names), researchers can identify the existence of discrimination. Resume
audit studies were designed to improve upon traditional audit studies of the labor market, which
involved sending matched pairs of candidates (e.g., otherwise similar study confederates of different
races) to apply for the same job and measure whether the callback rate differed by race. These
traditional audit studies were challenged on empirical grounds for not being double-blind [Turner
et al., 1991] and for an inability to match candidate characteristics beyond race perfectly [Heckman
and Siegelman, 1992, Heckman, 1998].
   2
     See Bertrand and Duflo [2016] for a thorough summary of field experiments on discrimination
in myriad domains.

                                                  2
identify preferences at one point in the quality distribution (i.e., at the callback
threshold), which may not be generalizable [Heckman, 1998, Neumark, 2012].3 In
this paper, we pioneer a new experimental paradigm that addresses these challenges
and allows us to study employers in markets not accessible to resume audit studies.
       Our paradigm is called Incentivized Resume Rating (IRR). IRR invites employ-
ers to evaluate resumes that they know to be hypothetical—avoiding deception—
and provides incentives by matching employers with real job seekers based on these
evaluations. As we demonstrate through our implementation of IRR, researchers us-
ing the paradigm can: (a) recruit employers who would not respond to unsolicited
resumes, (b) elicit a single employer’s preferences over multiple resumes, (c) random-
ize many candidate characteristics simultaneously, (d) collect a granular measure of
employer interest in each candidate rather than a binary callback decision, (e) ask
employers to provide a separate measure of likelihood of offer acceptance to mit-
igate against it confounding the rating of interest in a candidate, and (f) collect
supplemental data about the specific individuals reviewing resumes and their firms.
       We deploy IRR in partnership with the University of Pennsylvania (Penn) Ca-
reer Services office to study the preferences of employers hiring graduating seniors
through on-campus recruiting, a market largely unexplored by the resume audit
literature.4 We find that employers value higher grade point averages as well as the
quality and quantity of summer internship experience. Employers place extra value
on prestigious and substantive internships but do not appear to value summer jobs
that Penn students typically take for a paycheck (i.e., rather than to develop human
capital for a future career), such as barista, server, or cashier. This result suggests
a potential benefit on the post-graduate job market for students who can afford to
take unpaid or low-pay internships rather than needing to work for an hourly wage.
   3
     The former concern might contribute to counterintuitive results in the resume audit literature,
such as higher callback rates for unemployed than employed candidates [Kroft et al., 2013, Nunley
et al., 2017, 2014, Farber et al., 2018]. Researchers who use audit studies aim to mitigate such
concerns (e.g., Bertrand and Mullainathan [2004] attempted to construct high-quality resumes
that did not lead candidates to be “overqualified,” page 995). While the latter concern might be
mitigated by the callback threshold being empirically relevant—we may particularly care about
detecting preferences at the callback margin—such preferences may not generalize to other relevant
margins (e.g., when firms are expanding and hiring more candidates).
   4
     Presumably, the resume audit literature has left this market unexplored because firms hiring
students coming out of prestigious colleges and universities typically do not recruit candidates by
responding to cold resumes.

                                                 3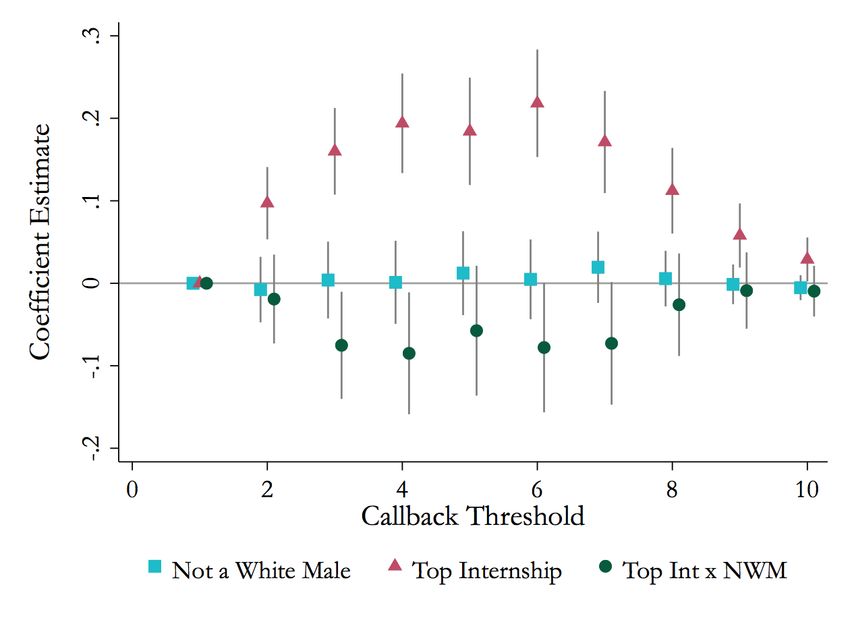
Studying this population of employers also allows us to investigate whether race
and gender discrimination is active in this market—a market in which many employ-
ers claim to have a preference for diversity.5 We do not find evidence that employers
are less interested in female and minority candidates on average, but we do find dis-
crimination among employers looking to hire candidates with STEM majors.6 We
find suggestive evidence that discrimination in hiring interest is due to implicit bias
by observing how discrimination changes as employers evaluate multiple resumes.7
    By asking employers to evaluate their interest in candidates on a 10-point Likert
scale (i.e., rather than asking for binary callback decisions), we are able to identify
how employer preferences for specific candidate characteristics differ as candidate
quality changes. Our results suggest that most of the preferences we identify main-
tain sign and significance across the distribution of quality. However, we find that
the effects of major and of work experience are most pronounced towards the middle
of the quality distribution and smaller in the tails.8
    To mitigate against employers’ ratings of interest in a candidate being con-
founded with employers’ beliefs about the likelihood that a candidate would accept
a job offer, we asked employers to rate their interest in each candidate assuming
the candidate would accept a job if offered, and we separately asked employers for
their evaluations of each candidate’s likelihood of accepting a job. The likelihood of
offer acceptance data provide additional insights. Employers report believing that
minority and female candidates are less likely to accept job offers than their White
male counterparts, which suggests a novel channel for discrimination. Due to the
cost of recruiting, firms may be reluctant to pursue female and minority candidates
who they do not believe will accept a position if offered.
    5
      In a survey employers complete after evaluating resumes in our study, over 90% of employers
report that both “seeking to increase gender diversity / representation of women” and “seeking to
increase racial diversity” factor into their hiring decisions, and 82% of employers rate both of these
factors at 5 or above on a Likert scale from 1 = “Do not consider at all” to 10 = “This is among
the most important things I consider.”
    6
      STEM is a common acronym for “Science, Technology, Engineering, and Math.”
    7
      In addition, consistent with results from the resume audit literature finding lower returns to
quality for minority candidates (see Bertrand and Mullainathan [2004]), we find that candidates
who are not White males receive a lower return to work experience at prestigious internships.
    8
      For example, employers display a strong preference for candidates who attend Wharton (the
business school at Penn) over candidates from the College of Arts and Sciences on average but such
a preference would be difficult or impossible to detect in the low callback rate environments typical
of resume audit studies.

                                                  4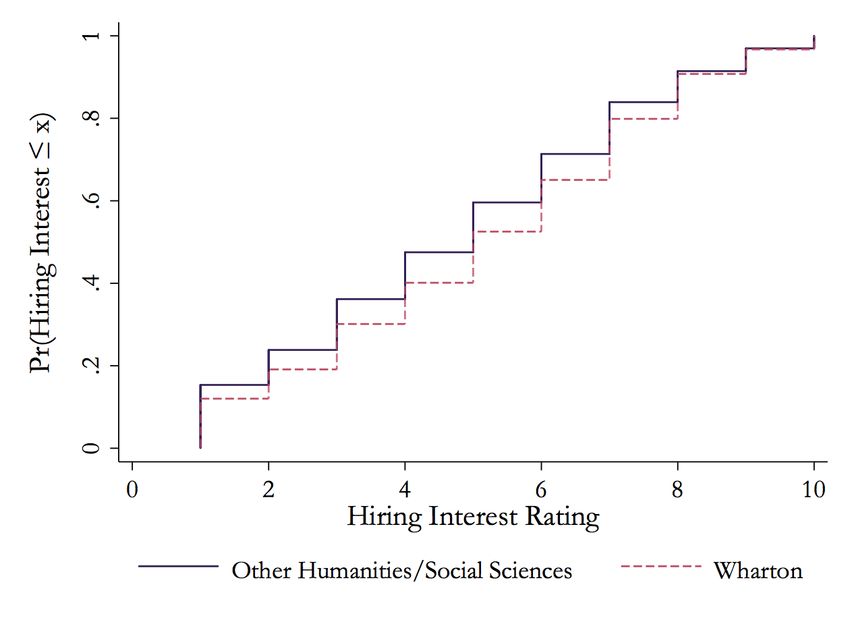
In addition to presenting results on employer preferences, this paper describes
in detail how to implement an IRR study, which we hope will be of value to fu-
ture researchers. IRR provides a path forward for those interested in studying
discrimination and other employer preferences without using deception. While cor-
respondence audit studies have been tremendously useful, their proliferation has
raised concerns about whether the use of unwitting subjects’ time (see Hamermesh
[2012] for a critique) and other possible harms of deception are outweighed by the
social benefits of the research.9 Audit studies have typically been insulated against
a principal critique of deception in the lab—that it pollutes the subject pool for fu-
ture research—because of the notion that the experimenter’s manipulation is small
relative to the market as a whole. However, this argument becomes less valid as
the number of audit studies grows, particularly now that many studies are run in
the same venues (e.g., certain online job boards). Thus, the continued expansion of
resume audit studies raises the concern that employers could become wary of certain
types of resumes sent out by researchers and that this could not only harm the va-
lidity of future research but also real job seekers whose resumes are similar to those
sent by researchers.10 Given these concerns, we believe IRR provides significant
value as a deception-free alternative to measure employer preferences.
       The remainder of this paper proceeds as follows. Section 2 describes the IRR
paradigm and our specific experimental design. Section 3 reports on the results
about the preferences of employers recruiting at the University of Pennsylvania.
   9
      As evidence of their proliferation, Baert [2018] notes 90 resume audit studies focused on dis-
crimination against protected classes in labor markets alone between 2005 and 2016. The method
has also proliferated into other domains, such as requesting in-person meetings from professors
[Milkman et al., 2012, 2015]. Bertrand and Duflo [2016] argues that the literature has generally
not evolved past measuring differences in callback means between groups, and that it has been less
successful in illuminating mechanisms driving these difference. That said, there have been some
exceptions, like Bartoš et al. [2016], which uses a novel design where employers and landlords can
click a link in an email to acquire more information on the candidate to show that less attention is
allocated to candidates one discriminates against.
   10
      These harms might be particularly relevant when the populations being audited are likely to
become aware of the research ex post. For example, college professors (audited in Milkman et al.
[2012, 2015]) might take such studies as an excuse to ignore future student emails. The popularity
of the method makes it likely that employers are aware of it as well, especially as audit studies
can be used as legal evidence of discrimination [Neumark, 2012]. Other expansions of the audit
methodology may be particularly concerning, such as auditing politicians’ responses to putative
constituents (see Butler and Broockman [2011], Distelhorst and Hou [2017]), which might distort
politicians’ beliefs about the priorities of the populations they serve. This may be particularly
problematic when researchers seek a politician-level audit measure, which requires sending many
fake requests to the same politician.

                                                 5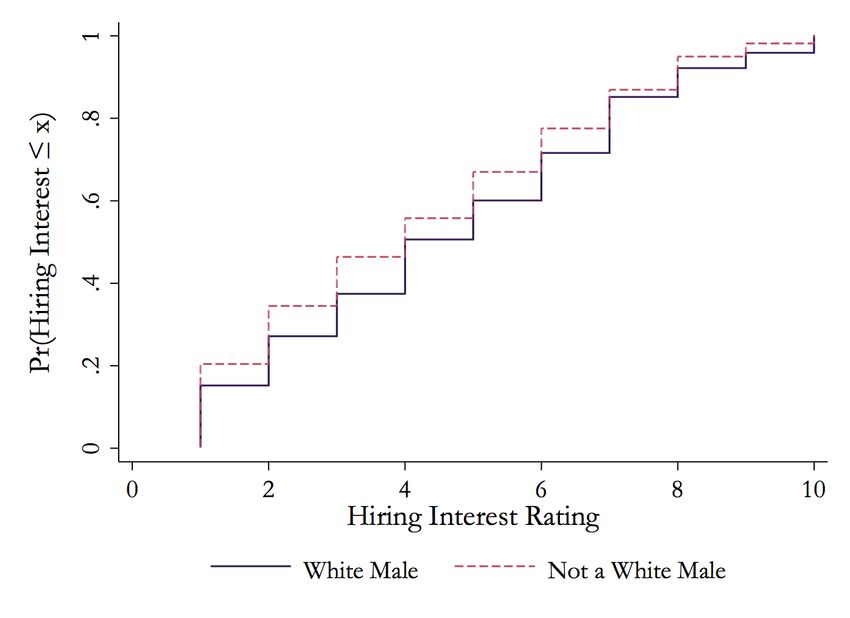
Section 4 discusses a replication study we conducted at the University of Pittsburgh.
Section 5 discusses the costs and benefits of IRR, highlights the implications of our
results, and concludes.

2         Study Design
         In this section, we describe our implementation of IRR, which combines the in-
centives and ecological validity of the field with the control of the laboratory. In
Section 2.1, we outline how we recruit employers who are in the market to hire elite
college graduates. In Section 2.2, we describe how we provide employers with in-
centives for reporting preferences without introducing deception. In Section 2.3, we
detail how we created the hypothetical resumes and describe the extensive variation
in candidate characteristics that we included in the experiment, including grade
point average and major (see 2.3.1), previous work experience (see 2.3.2), skills (see
2.3.3), and race and gender (see 2.3.4). In Section 2.4, we highlight the two questions
that we asked subjects about each hypothetical resume, which allowed us to get a
granular measure of interest in a candidate without a confound from the likelihood
that the candidate would accept a job if offered.

2.1        Employers and Recruitment

         IRR allows researchers to recruit employers in the market for candidates from
particular institutions and those who do not screen unsolicited resumes and thus may
be hard—or impossible—to study in audit or resume audit studies. To leverage
this benefit of the experimental paradigm, we partnered with the University of
Pennsylvania (Penn) Career Services office to identify employers recruiting highly
skilled generalists from the Penn graduating class.11
         Penn Career Services sent invitation emails (see Appendix Figure A.1 for re-
cruitment email) in two waves during the 2016-2017 academic year to employers
who historically recruited Penn seniors (e.g., firms that recruited on campus, regu-
larly attended career fairs, or otherwise hired students). The first wave was around
    11
    We initially partnered with Penn Career Services since all the authors were affiliated with the
University of Pennsylvania. As described in detail in Section 4, we replicated our experiment at
University of Pittsburgh (Pitt). We identified Pitt by reaching out to the career services depart-
ments of other Pennsylvania schools that differed from Penn on a number of dimensions. Pitt’s
career services department was the most willing to participate.

                                                6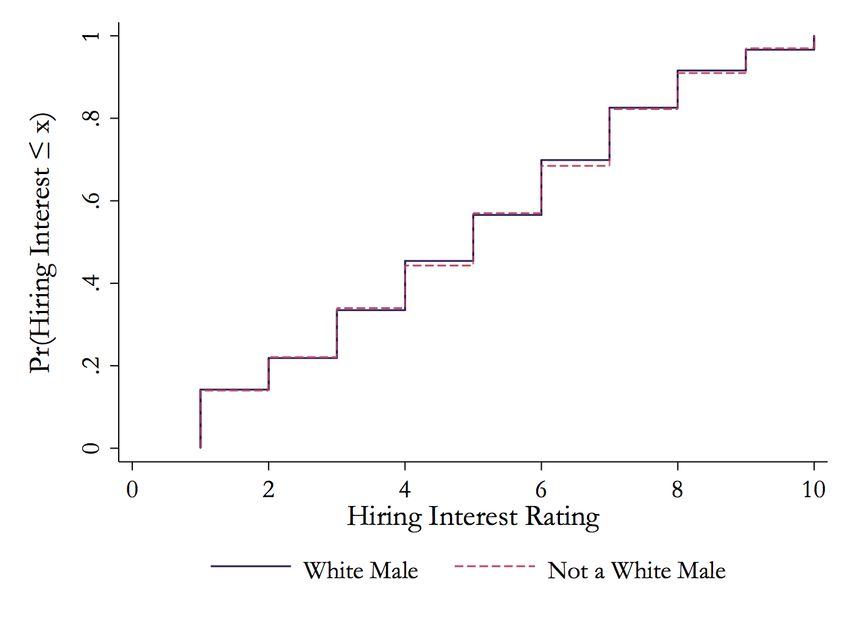
the time of on-campus recruiting in the fall of 2016. The second wave was around the
time of career-fair recruiting in the spring of 2017. In both waves, the recruitment
email invited employers to use “a new tool that can help you to identify potential
job candidates.” While the recruitment email and the information that employ-
ers received before rating resumes (see Appendix Figure A.3 for instructions) noted
that anonymized data from employer responses would be used for research purposes,
this was framed as secondary. The recruitment process and survey tool itself both
emphasized that employers were using new recruitment software. For this reason,
we note that our study has the ecological validity of a field experiment.12 As was
outlined in the recruitment email (and described in detail in Section 2.2), each em-
ployer’s one and only incentive for participating in the study is to receive 10 resumes
of job seekers that match the preferences they report in the survey tool.13

2.2      Incentives

       The main innovation of IRR is its method for incentivized preference elicitation,
a variant of a method pioneered by Low [2017] in a different context. In its most
general form, the method asks subjects to evaluate candidate profiles, which are
known to be hypothetical, with the understanding that more accurate evaluations
will maximize the value of their participation incentive. In our implementation of
IRR, each employer evaluates 40 hypothetical candidate resumes and their partic-
ipation incentive is a packet of 10 resumes of real job seekers from a large pool of
Penn seniors. For each employer, we select the 10 real job seekers based on the
employer’s evaluations.14 Consequently, the participation incentive in our study be-
  12
      Indeed, the only thing that differentiates our study from a “natural field experiment” as defined
by Harrison and List [2004] is that subjects know that academic research is ostensibly taking place,
even though it is framed as secondary relative to the incentives in the experiment.
   13
      We timed recruitment so that employers would receive these 10 resumes around the time they
were on campus in order to facilitate meeting the job seekers. In addition, we offered webinars
for employers who were interested in learning about the survey screening experience before they
participated. Employers could anonymously join a call where they viewed a slideshow about the
survey software and could submit questions via chat box. Attendance at these webinars was low.
   14
      The recruitment email (see Appendix Figure A.1) stated: “the tool uses a newly developed
machine-learning algorithm to identify candidates who would be a particularly good fit for your job
based on your evaluations.” We did not use race or gender preferences when suggesting matches
from the candidate pool. The process by which we identify job seekers based on employer evaluations
is described in detail in Appendix A.3.

                                                  7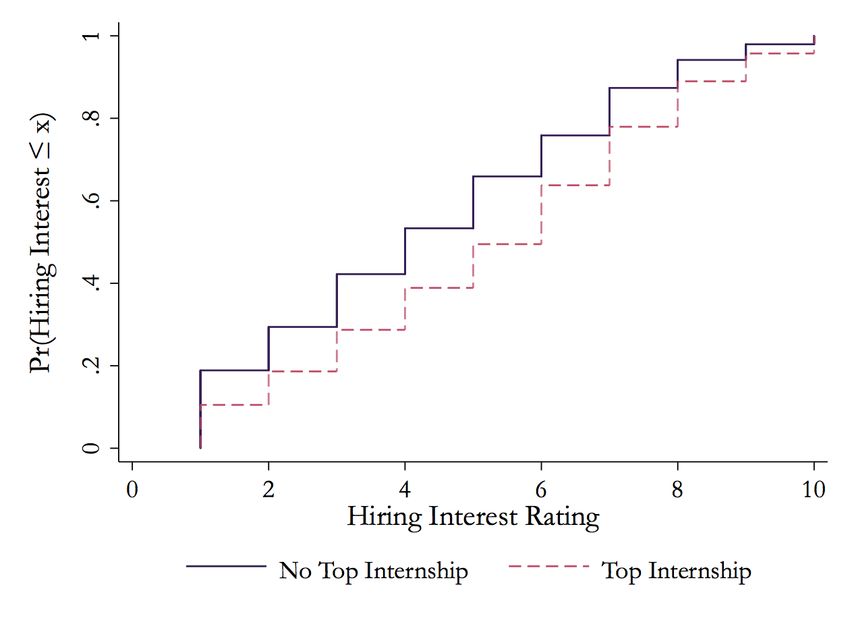
comes more valuable as employers’ evaluations of candidates better reflect their true
preferences for candidates.15
       A key design decision to help ensure subjects in our study truthfully and ac-
curately report their preferences is that we provide no additional incentive (i.e.,
beyond the resumes of the 10 real job seekers) for participating in the study, which
took a median of 29.8 minutes to complete. Limiting the incentive to the resumes of
10 job seekers makes us confident that participants value the incentive, since they
have no other reason to participate in the study. Since subjects value the incentive,
and since the incentive becomes more valuable as preferences are reported more
accurately, subjects have good reason to report their preferences accurately.

2.3      Resume Creation and Variation

       Our implementation of IRR asked each employer to evaluate 40 unique, hypo-
thetical resumes, and varied multiple candidate characteristics simultaneously and
independently across resumes. This allows us to estimate employer preferences for
each characteristic, identified over a rich space of baseline candidate characteris-
tics.16 In particular, when an employer began the survey tool, each of the 40 resumes
was dynamically populated with independently drawn, randomly selected candidate
characteristics. As shown in Table 1 and described below, we randomly varied a set
of candidate characteristics related to education; a set of candidate characteristics
related to work, leadership, and skills; and the candidate’s race and gender.
       We made a number of additional design decisions to increase the realism of the
hypothetical resumes and to otherwise improve the quality of employer responses.
  15
     In Low [2017], heterosexual male subjects evaluated online dating profiles of hypothetical
women with an incentive of receiving advice from an expert dating coach on how to adjust their
own online dating profiles to attract the types of women that they reported preferring. While this
type of non-monetary incentive is new to the labor economics literature, it has features in common
with incentives in laboratory experiments, in which subjects make choices (e.g., over monetary
payoffs, risk, time, etc.) and the utility they receive from those choices is higher as their choices
more accurately reflect their preferences.
  16
     In a traditional audit or resume audit study, researchers are limited in the number of candidates
or resumes that they can show to any particular employer—sending too many fake resumes to
the same firm might trigger ethics concerns or cause employers to become suspicious. They are
additionally limited in how candidate characteristics can covary across resumes—a resume with a
very low GPA but very prestigious internships might appear unusual or suspicious. For example, in
their seminal resume audit study paper, Bertrand and Mullainathan [2004] only send four resumes
to each firm and only create two quality levels of resumes (i.e., a high quality resume and a low
quality resume, in which various candidate characteristics vary together).

                                                  8
First, we built the hypothetical resumes using components (i.e., work experiences,
leadership experiences, and skills) from real resumes of seniors at Penn. Second, we
asked the employers to choose the type of candidates that they were interested in
hiring, based on major (see Appendix Figure A.4). In particular, they could choose
either “Business (Wharton), Social Sciences, and Humanities” (henceforth “Human-
ities & Social Sciences”) or “Science, Engineering, Computer Science, and Math”
(henceforth “STEM”). They were then shown hypothetical resumes focused on the
set of majors they selected. As described below, this choice affects a wide range
of candidate characteristics; majors, internship experiences, and skills on the hypo-
thetical resumes varied across these two major groups.17 Third, to enhance realism,
and to make the evaluation of the resumes less tedious, we used 10 different resume
templates, which we populated with the candidate characteristics and component
pieces described below, to generate the 40 hypothetical resumes (see Appendix Fig-
ure A.5 for a sample resume). We based these templates on real student resume
formats (see Appendix Figure A.6 for examples).18 Fourth, we gave employers short
breaks within the study by showing them a progress screen after each block of 10
resumes they evaluated. In Section 3.4, we use the change in attention induced by
these breaks to construct tests of implicit bias.
2.3.1 Education Information
In the education section of the resume, we independently randomized each can-
didate’s grade point average (GPA) and major. GPA is drawn from a uniform
distribution between 2.90 and 4.00, shown to two decimal places and never omitted
from the resume.19 Majors are chosen from a list of Penn majors, with higher prob-
ability put on more common majors. Each major was associated with a degree (BA
or BS) and with the name of the group or school granting the degree within Penn
(e.g., “College of Arts and Sciences”).20
17
The resumes of the 10 real job seekers the employers were sent after completion of the study
were also drawn from a set of majors corresponding to the employer’s choice.
18
We blurred the text in place of a phone number and email address for all resumes, since we
were not interested in inducing variation in those candidate characteristics.
19
Some students omit GPA from their resumes, presumably to avoid reporting a low GPA. We
chose not to test how employers respond to the omission of the GPA for this experiment, but it
would be an easy modification to our experimental design for future researchers.
20
Table A.3 shows the list of majors by major category, school, and the probability that the
major was used in a resume.
9Table 1: Randomization of Resume Components
Resume Component Description Analysis Variable
Personal Information
First & last name Drawn from list of 50 possible names given selected Not a White Male (67.15%)
race and gender (names in Tables A.1 & A.2) Not White (34.3%)
Race drawn randomly from U.S. distribution (65.7% Female (50%)
White, 16.8% Hispanic, 12.6% Black, 4.9% Asian)
Gender drawn randomly (50% male, 50% female)
Education Information
GPA Drawn U nif [2.90, 4.00] to second decimal place GPA
Major Drawn from a list of majors at Penn (Table A.3) Major (weights in Table A.3)
Degree type BA, BS fixed to randomly drawn major Wharton (40%)
School within university Fixed to randomly drawn major School of Engineering and
Graduation date Fixed to upcoming spring (i.e., May 2017) Applied Science (70%)
Work Experience
First job Drawn from curated list of top internships and Top Internship (20/40)
regular internships
Title and employer Fixed to randomly drawn job
Location Fixed to randomly drawn job
Description Bullet points fixed to randomly drawn job
Dates Summer after candidate’s junior year (i.e., 2016)
Second job Left blank or drawn from curated list of regular Second Internship (13/40)
internships and work-for-money jobs (Table A.5) Work for Money (13/40)
Title and employer Fixed to randomly drawn job
Location Fixed to randomly drawn job
Description Bullet points fixed to randomly drawn job
Dates Summer after candidate’s sophomore year (i.e., 2015)
Leadership Experience
First & second leadership Drawn from curated list
Title and activity Fixed to randomly drawn leadership
Location Fixed to Philadelphia, PA
Description Bullet points fixed to randomly drawn leadership
Dates Start and end years randomized within college
career, with more recent experience coming first
Skills
Skills list Drawn from curated list, with two skills drawn from Technical Skills (25%)
{Ruby, Python, PHP, Perl} and two skills drawn from
{SAS, R, Stata, Matlab} shuffled and added to skills
list with probability 25%.
Resume components are listed in the order that they appear on hypothetical resumes. Italicized
variables in the right column are variables that were randomized to test how employers responded
to these characteristics. Degree, first job, second job, and skills were drawn from the different
lists for Humanities & Social Sciences resumes and STEM resumes. Name, GPA, and leadership
were drawn from the same lists for both resume types. Weights of characteristics are shown as
fractions when they are fixed across subjects (e.g., each subject saw exactly 20/40 resumes with a
Top Internship) and percentages when they represent a draw from a probability distribution (e.g.,
each resume a subject saw had a 67.15% chance of having an assigned white name).
102.3.2 Work Experience
We included realistic work experience components on the resumes. To generate
the components, we scraped more than 700 real resumes of Penn students. We then
followed a process described in Appendix A.2.5 to select and lightly sanitize work
experience components so that they could be randomly assigned to different resumes
without generating conflicts or inconsistencies (e.g., we eliminated references to
particular majors or to gender or race).21
Our goal in randomly assigning these work experience components was to in-
troduce variation along two dimensions: quantity of work experience and quality
of work experience. To randomly assign quantity of work experience, we varied
whether the candidate only had an internship in the summer before senior year, or
also had a job or internship in the summer before junior year. Thus, candidates
with more experience had two jobs on their resume (before junior and senior years),
while others had only one (before senior year).22
To introduce random variation in quality of work experience, we grouped work
experience components into three categories: (1) “top internships,” which were
internships with prestigious firms as defined by being a firm that successfully hires
many Penn graduates; (2) “work-for-money” jobs, which were paid jobs that—at
least for Penn students—are unlikely to develop human capital for a future career
(e.g., barista, cashier, waiter, etc.); and (3) “regular” internships, which comprised
all other work experiences.23
21
The work experience component included the associated details from the real resume from
which the component was drawn. For example, a work experience component would include an
employer, title, location, and a few bullet points with a description of the tasks completed while in
that internship.
22
The resume was constructed dynamically, so if only one job was listed on the resume, the work
experience section of the resume appeared shorter (i.e., rather than introducing empty space).
23
See Appendix Table A.4 for a list of top internship employers and Table A.5 for a list of work-
for-money job titles. As described in Appendix A.2.5, different internships (and top internships)
were used for each major type but the same work-for-money jobs were used for both major types.
The logic of varying internships by major type was based on the intuition that internships could
be interchangeable within each group of majors (e.g., internships from the Humanities & Social
Sciences resumes would not be unusual to see on any other resume from that major group) but
were unlikely to be interchangeable across major groups (e.g., internships from Humanities & Social
Sciences resumes would be unusual to see on STEM resumes and vice versa). We used the same
set of work-for-money jobs for both major types, since these jobs were not linked to a candidate’s
field of study.
11The first level of quality randomization was to assign each hypothetical resume to
have either a top internship or a regular internship in the first job slot (before senior
year). This allows us to detect the impact of having a higher quality internship.24
The second level of quality randomization was in the kind of job a resume had in
the second job slot (before junior year), if any. Many students may have an economic
need to earn money during the summer and thus may be unable to take an unpaid or
low-pay internship. To evaluate whether employers respond differentially to work-
for-money jobs, which students typically take for pay, and internships, resumes were
assigned to have either have no second job, a work-for-money job, or a standard
internship, each with (roughly) one-third probability (see Table 1). This variation
allows us to measure the value of having a work-for-money job and to test how it
compares to the value of a standard internship.
2.3.3 Leadership Experience and Skills
The procedure followed to select leadership experience components was similar to
that for work experiences. A leadership experience component includes an activity,
title, date, and a few bullet points with a description of the experience (Philadelphia,
PA was given as the location of all leadership experiences).25
Leadership experiences were included so our resumes would more realistically
resemble typical student resumes. We randomly assigned two leadership experiences,
with randomly selected ranges of years from within the four years preceding the
graduation date, to each resume.26
24
Since the work experience component was comprised of employer, title, location, and bullets
about the job—as in practice—a higher quality work experience necessarily reflects all features of
this bundle. Consequently, while we could additionally estimate how employers respond to specific
elements of the component (e.g., a candidate having an internship in a particular city or working for
a Fortune 500 company), these elements were not independently randomized and so are correlated
with other features of the work experience that employers likely also care about.
25
We used the same leadership positions for both major types under the assumption that most
extracurricular activities at Penn could plausibly include students from all majors; however, this
required us to exclude the few leadership experiences that were too revealing of field of study (e.g.,
“American Institute of Chemical Engineers”). For additional details, see Appendix A.2.5.
26
As with work experiences, the richness in detail of a leadership experience would theoretically
allow us to estimate how employers respond to specific elements of the leadership experience (e.g.,
a candidate being a president of a club or the captain of a team), but, again, these elements were
not independently randomized and are correlated with other features of a leadership experience
that employers might care about.
12With skills, by contrast, we added a layer of intentional variation. First, each
resume was randomly assigned a list of skills drawn from real resumes. We stripped
from these lists any reference to Ruby, Python, PHP, Perl, SAS, R, Stata, and
Matlab. With 75% probability, the hypothetical resume included one of these lists.
With 25% probability, we appended to this list four technical skills: two randomly
drawn advanced programming languages from {Ruby, Python, PHP, Perl} and two
randomly drawn statistical programs from {SAS, R, Stata, Matlab}. This variation
allows us to measure how employers value candidates with more technical skills
listed on their resumes.
2.3.4 Names Indicating Gender and Race
We randomly varied gender and race by assigning each hypothetical resume a
name that would be indicative of gender (male or female) and race / ethnicity
(Asian, Black, Hispanic, or White).27 In order to do this randomization, we needed
to first generate a list of names that would clearly indicate both gender and race for
each the these groups.
We created names by independently generating first names and last names. For
first names, we used a dataset of all births in the state of Massachusetts between
1989-1996 and in New York City between 1990-1996 (the approximate birth range
of job seekers in our study). Following Fryer and Levitt [2004], we generated an
index for each name indicating how distinctively the name was associated with a
particular race and gender. From these, we generated lists of 50 names by selecting
the most indicative names and removing names that were strongly indicative of
religion (such as Moshe) or gender ambiguous in the broad sample, even though
they might be unambiguous within an ethnic group (such as Courtney, which is
a popular name among both Black men and White women). We used a similar
approach to generating racially indicative last names, under the assumption that
last names should not be informative of gender. We used last name data from the
2000 Census tying last names to race. We implemented the same measure of race
specificity and required that the last name make up at least 0.1% of that race’s
population, to ensure that the last names were sufficiently common. Finally, we
27
For ease of exposition, we will refer to race / ethnicity as “race” throughout the paper.
13combined first and last names within race.28 The full lists of names are given in
Appendix Tables A.1 and A.2 (see Appendix A.2.3 for additional details).
For realism, we randomly selected races at rates approximating the distribution
in the US population (65.7% White, 16.8% Hispanic, 12.6% Black, 4.9% Asian).
While a less subtle variation in race might increase statistical power to detect race-
based discrimination, such an approach would risk signaling to subjects our intent
to study racial preferences. As a result, we evaluate all discrimination on a pooled
gender and race measure, looking at White males compared to all those who are
not White males (minorities and women combined). In Appendix B.3.4, we examine
these demographic groups separately to see if results are always directionally aligned
between the two groups.
2.4 Rating Candidates on Two Dimensions
As noted in the introduction, audit and resume audit studies generally report
results on callback, which has two limitations. First, callback only identifies pref-
erences for candidates at one point in the quality distribution (i.e., at the callback
threshold), so results may not generalize to other environments or to other can-
didate characteristics. Second, while callback is often treated as a measure of an
employer’s interest in a candidate, there is a potential confound to this interpre-
tation. Since continuing to interview a candidate, or offering the candidate a job
that is ultimately rejected, can be costly to an employer (e.g., it may require time
and energy and crowd out making other offers), an employer’s callback decision will
optimally depend on both the employer’s interest in a candidate and the employer’s
belief about whether the candidate will accept the job if offered. If the likelihood
that a candidate accepts a job when offered is decreasing in the candidate’s quality
(e.g., if higher quality candidates have better outside options), employers’ actual
effort spent pursuing candidates may be non-monotonic in candidate quality. Con-
28
This resulted in eight lists of first name-last name pairs for each of: Asian females, Asian males,
Black females, Black males, Hispanic females, Hispanic males, White females, and White males.
Each list contained 50 names.
14sequently, concerns about a candidate’s likelihood of accepting a job may be a
confound in interpreting callback as a measure of interest in a candidate.29,30
An advantage of the IRR methodology is that researchers can ask employers to
provide richer, more granular information than a binary measure of callback. We
leveraged this advantage to ask two questions, each on a Likert scale from 1 to
10.31 In particular, for each resume we asked employers to answer the following two
questions (see an example at the bottom of Appendix Figure A.5):
1. “How interested would you be in hiring [Name]?”
(1 = “Not interested”; 10 = “Very interested”)
2. “How likely do you think [Name] would be to accept a job with your organi-
zation?”
(1 = “Not likely”; 10 = “Very likely”)
In the instructions (see Appendix Figure A.3), employers were specifically told
that responses to both questions would be used to generate their matches. In ad-
dition, they were told to focus only on their interest in hiring a candidate when
answering the first question (i.e., they were instructed to assume the candidate
would accept an offer if given one). We denote responses to this question “hiring
interest.” They were told to focus only on the likelihood a candidate would ac-
cept a job offer when answering the second question (i.e., they were instructed to
assume they candidate had been given an offer and to assess the likelihood they
29
A salient example of this potential confound for academic economists who have participated in
junior recruiting (outside of the most desirable departments), is to imagine what an audit study of
economics departments would find if it randomly added publications to the CVs of graduate students
on the job market. Additional “top-five” publications could very likely decrease the chance that a
student receives flyouts from departments that are concerned with whether the candidate is likely
to be out of reach.
30
Audit and resume audit studies focusing on discrimination do not need to interpret callback as
a measure of an employer’s interest in a candidate to demonstrate discrimination (any difference in
callback rates is evidence of discrimination). Nevertheless, richer information might help identify
the mechanism driving the discrimination and show whether its magnitude is likely to differ in
other environments or as candidate characteristics vary.
31
The 10-point scale has two advantages. First, it provides additional statistical power, allowing
us to observe whether an employer values a characteristic even when it is added to an inframarginal
resume that would not be pushed over a binary callback threshold in a resume audit setting. For
example, if an employer were to call back anyone they rated an 8 or above on our Likert scale, we
can still observe when a characteristic increases an employer’s rating from a 6 to a 7 or from a 9
to a 10. Second, it allows us to explore how employer preferences vary across the distribution of
hiring interest, an issue we explore in depth in Section 3.3.
15would accept it). We denote responses to this question a candidate’s “likelihood of
acceptance.” We asked the first question to assess how resume characteristics affect
hiring interest. We asked the second question both to encourage employers to focus
only on hiring interest when answering the first question and to explore employers’
beliefs about the likelihood that a candidate would accept a job if offered.
3 Results
3.1 Data and Empirical Approach
We recruited 72 employers through our partnership with the University of Penn-
sylvania Career Services office in Fall 2016 (46 subjects, 1840 resume observations)
and Spring 2017 (26 subjects, 1040 resume observations). The employers who par-
ticipated in our study as subjects were primarily female (60%) and primarily White
(79%) and Asian (15%). They were approximately as likely to work at a large
firm with over 1000 employees (38%) as a small firm with less than 100 employees
(40%).32
As described in Section 2, each employer rated 40 unique, hypothetical resumes
with randomly assigned candidate characteristics. For each resume, employers rated
hiring interest and likelihood of acceptance, each on a 10-point Likert scale. Our
analysis focuses initially on hiring interest, turning to how employers evaluate likeli-
hood of acceptance in Section 3.5. Our main specifications are ordinary least squares
(OLS) regressions. These specifications make a linearity assumption with respect
to the Likert-scale ratings data. Namely, they assume that, on average, employers
treat equally-sized increases in Likert-scale ratings equivalently (e.g., an increase in
hiring interest from 1 to 2 is equivalent to an increase from 9 to 10). In some spec-
ifications, we include subject fixed effects, which accounts for the possibility that
employers have different mean ratings of resumes (e.g., allowing some employers to
be more generous than others with their ratings across all resumes), although it
preserves the linearity assumption. To complement this analysis, we also run or-
dered probit regression specifications, which relax this assumption and only require
32
These small firms are mostly hedge fund, private equity, consulting, or wealth management
companies that are attractive employment opportunities for Penn undergraduates. Large firms
include prestigious Fortune 500 consumer brands, as well as large consulting and technology firms.
Our sample also included a small number of nonprofit and public interest organizations.
16that employers, on average, consider higher Likert-scale ratings more favorably than
lower ratings.
In Section 3.2, we examine how human capital characteristics (e.g., GPA, ma-
jor, work experience, and skills) affect hiring interest. These results report on the
mean of preferences across the distribution; we show how our results vary across
the distribution of hiring interest in Section 3.3.33 In Section 3.4, we discuss how
employers’ ratings of hiring interest respond to demographic characteristics of our
candidates. In Section 3.5, we investigate the likelihood of acceptance ratings and
identify a potential new channel for discrimination.
3.2 Effect of Human Capital on Hiring Interest
Employers in our study are interested in hiring graduates of the University of
Pennsylvania for full-time employment, and many recruit at other Ivy League schools
and other top colleges and universities. This labor market has been unexplored by
resume audit studies.34 In this section, we evaluate how randomized candidate
characteristics—described in Table 1 and Section 2.3—affect employers’ ratings of
hiring interest.
We denote Vij as employer i’s rating of a resume j on the 1–10 Likert scale
and estimate variations of the following regression specification (1). This regression
allows us to investigate the average response to candidate characteristics across
employers in our study.
Vij = β0 + β1 GPA + β2 Top Internship + β3 Second Internship + β4 Work for Money +
β5 Technical Skills + β6 Not a White Male + µj + γj + ωj + αi + εij (1)
In this regression, GPA is a linear measure of grade point average. Top Intern-
ship is a dummy for having a top internship, Second Internship is a dummy for
having an internship in the summer before junior year, and Work for Money is a
dummy for having a work-for-money job in the summer before junior year. Techni-
cal Skills is a dummy for having a list of skills that included a set of four randomly
33
Mean preferences may not be reflective of preferences at the tail of a distribution, as highlighted
by the Neumark [2012] critique of correspondence audit studies.
34
The positions employers aim to fill through on campus recruiting at Penn are highly unlikely
to be filled through online job boards or by screening unsolicited resumes.
17assigned technical skills. Not a White Male is a dummy equal to 1 if the name of
candidate was not indicative of a White male, a measure that allows us to combine
discrimination based on race and discrimination based on gender.35 µj are dummies
for each major. Table 1 provides more information about these dummies and all the
variables in this regression. In some specifications, we include additional controls.
γj are dummies for each of the leadership experience components. ωj are dummies
for the number of resumes the employer has evaluated as part of the survey tool.36
Finally, αi are employer (i.e., subject) fixed effects that account for different average
ratings across employers.
Table 2 shows regression results where Vij is Hiring Interest, which takes values
from 1 to 10. The first three columns report OLS regressions with slightly different
specifications. The first column includes all candidate characteristics we varied to
estimate their impact on ratings. The second column adds leadership dummies γ
and resume order dummies ω. The third column also adds subject fixed effects α.
As expected, results are robust to the addition of these controls. These regression
show that employers respond strongly to candidate characteristics related to human
capital.
GPA is an important driver of hiring interest. The coefficient on GPA ranges
from 2.1–2.2 Likert-scale points, suggesting an increase in GPA of one point (e.g.,
from a 3.0 to a 4.0) increases ratings on the Likert scale by 2.1–2.2 points. The
standard deviation of quality ratings is 2.81, suggesting that a point improvement
in GPA moves hiring interest ratings by about three quarters of a standard deviation.
Employers additionally value the quality and quantity of a candidate’s work
experience. The quality of a candidate’s work experience in the summer before
senior year has a large impact on hiring interest ratings. The coefficient on Top
Internship ranges from 0.9–1.0 Likert-scale points, which is roughly a third of a
standard deviation of ratings. Comparing regression coefficients, we see that a top
internship is approximately equivalent to a half-point improvement in GPA, meaning
that, on average, a candidate with a 3.5 GPA and a prestigious internship is viewed
equivalently to a candidate with a 4.0 GPA and a regular internship.
35
While we do not discuss results about Not a White Male in this section, we include a control
for this randomized resume component in our regressions and discuss the results in Section 3.4 and
Appendix B.3. In Appendix B.3.4, we analyze race and gender separately.
36
Since leadership experiences are independently randomized and orthogonal to other resume
characteristics of interest, and since resume characteristics are randomly drawn for each of the 40
resumes, our results should be robust to the inclusion or exclusion of these dummies.
18Table 2: Human Capital Experience
Dependent Variable: Hiring Interest
Ordered
OLS OLS OLS Probit
GPA 2.124∗∗∗ 2.189∗∗∗ 2.195∗∗∗ 0.890∗∗∗
(0.145) (0.150) (0.129) (0.0613)
Top Internship 0.905∗∗∗ 0.904∗∗∗ 0.902∗∗∗ 0.379∗∗∗
(0.0944) (0.0988) (0.0806) (0.0396)
Second Internship 0.463∗∗∗ 0.487∗∗∗ 0.463∗∗∗ 0.206∗∗∗
(0.112) (0.118) (0.0947) (0.0468)
Work for Money 0.112 0.152 0.149 0.0510
(0.110) (0.113) (0.0913) (0.0468)
Technical Skills 0.0499 0.0557 -0.0680 0.0133
(0.104) (0.108) (0.0900) (0.0441)
Not a White Male -0.122 -0.157 -0.117 -0.0531
(0.0987) (0.103) (0.0842) (0.0415)
Observations 2880 2880 2880 2880
R2 0.129 0.180 0.482
p-value for test of joint
significance of Majors < 0.001 < 0.001 < 0.001 < 0.001
Major FEs Yes Yes Yes Yes
Leadership FEs No Yes Yes No
Order FEs No Yes Yes No
Subject FEs No No Yes No
Ordered probit cutpoints: 1.91, 2.28, 2.64, 2.94, 3.26, 3.6, 4.05, 4.51, and 5.03.
Table shows OLS and ordered probit regressions hiring interest from
Equation (1). Robust standard errors are reported in parentheses. ∗ ,
∗∗ , ∗∗∗ denote p < 0.1, 0.05, and 0.01, respectively. GPA, Top In-
ternship, Second Internship, Work for Money, Technical Skills, and
Not a White Male and major are characteristics of the hypothetical
resume, constructed as described in Section 2.3 and in Appendix A.2.
Fixed effects for major, leadership experience, resume order, and sub-
ject included in some specifications as indicated. R2 is indicated for
each OLS regression. The p-value of a test of joint significance of
major fixed effects is indicated (F -test for OLS, likelihood ratio test
for ordered probit).
19Employers value a second work experience on the candidate’s resume, but only if
that experience is an internship and not if it is a work-for-money job. In particular,
the coefficient on Second Internship, which reflects the effect of adding a second
internship to a resume that otherwise has no work experience listed for the summer
before junior year, is 0.4–0.5 Likert-scale points.37 While listing an internship before
junior year is valuable, listing a work-for-money job that summer does not appear to
increase hiring interest ratings. The coefficient on Work for Money is small and not
statistically different from zero in our data. While it is directionally positive, we can
reject that work-for-money jobs and regular internships are valued equally (p < 0.05
for all tests comparing the Second Internship and Work for Money coefficients).
We see no effect on hiring interest from increased Technical Skills, suggesting
that employers on average do not value the technical skills we randomly added to
candidate resumes or that listing technical skills does not credibly signal sufficient
mastery to affect hiring interest (e.g., employers may consider skills listed on a
resume to be cheap talk).
Table 2 also reports the p-value of a test of whether the coefficients on the major
dummies are jointly different from zero. Results suggest that the randomly assigned
major significantly affects hiring interest. While we do not have the statistical
power to test for the effect of each major, we can explore how employers respond to
candidates being from more prestigious schools at the University of Pennsylvania.
In particular, 40% of the Humanities & Social Sciences resumes are assigned a BS
in Economics from Wharton and the rest have a BA major from the College of Arts
and Sciences. In addition, 70% of the STEM resumes are assigned a BS from the
School of Engineering and Applied Science and the rest have a BA major from the
College of Arts and Sciences. As shown in Appendix Table B.2, in both cases, we
find that being from the more prestigious school—and thus receiving a BS rather
than a BA—is associated with an increase in hiring interest ratings of about 0.4–0.5
Likert-scale points.38
37
This effect is substantially smaller than the effect of Top Internship (p < 0.05 for all tests
comparing the Second Internship and Top Internship coefficients). A second summer of internship
experience is worth approximately half as much as having a higher-quality internship experience in
the summer before senior year.
38
Note that since the application processes for these different schools within Penn are different,
including the admissions standards, this finding also speaks to the impact of institutional prestige,
in addition to field of study (see, e.g., Kirkeboen et al. [2016]).
20We can loosen the assumption that employers treated the intervals on the Likert
scale linearly by treating Hiring Interest as an ordered categorical variable. The
fourth column of Table 2 gives the results of an ordered probit specification with
the same variables as the first column (i.e., omitting the leadership dummies and
subject fixed effects). This specification is more flexible than OLS, allowing the
discrete steps between Likert-scale points to vary in size. The coefficients reflect
the effect of each characteristic on a latent variable over the Likert-scale space, and
cutpoints are estimated to determine the distance between categories. Results are
similar in direction and statistical significance to the OLS specifications described
above.39
As discussed in Section 2, we made many design decisions to enhance realism.
However, one might be concerned that our independent cross-randomization of var-
ious resume components might lead to unrealistic resumes and influence the results
we find. We provide two robustness checks in the appendix to address this concern.
First, we recognize that while our design and analysis treats each work experience
as independent, in practice, candidates may have chosen to work in related jobs
over a series of summers to create a compelling work experience “narrative.” If
employers value combinations of work experiences, narrative might be an omitted
variable that could introduce bias (e.g., if our Top Internships are more likely to
generate narratives than regular internships, we may misestimate its effect on hir-
ing interest). In Appendix B.1, we describe how we test for the importance of work
experience narrative, and show regression results in Appendix Table B.1. We find
that employers do respond positively to work experience narrative (p = 0.054), but
our main results are robust to the inclusion of this omitted variable.
Second, the GPA distribution we used for constructing the hypothetical resumes
did not perfectly match the distribution of job seekers in our labor market. In
Appendix B.2, we re-weight our data to match the GPA distribution in the can-
didate pool of real Penn job seekers and show that our results are robust to this
39
The ordered probit cutpoints (2.14, 2.5, 2.85, 3.15, 3.46, 3.8, 4.25, 4.71, and 5.21) are approx-
imately equally spaced, suggesting that subjects treated the Likert scale approximately linearly.
Note that we only run the ordered probit specification with the major dummies and without lead-
ership dummies or subject fixed effects. Adding too many dummies to an ordered probit can lead
to unreliable estimates when the number of observations per cluster is small [Greene, 2004].
21re-weighting.40 These exercises provide some assurance that our results are not an
artifact of how we construct hypothetical resumes.
3.3 Effects Across the Distribution of Hiring Interest
The regression specifications described in Section 3.2 identify the average effect
of candidate characteristics on employers’ hiring interest. As pointed out by Neu-
mark [2012], however, these average preferences may differ in magnitude—and even
direction—from differences in callback rates, which derive from whether a char-
acteristic pushes a candidate above a specific quality threshold (i.e., the callback
threshold). For example, in the low callback rate environments that are typical of
resume audit studies, differences in callback rates will be determined by how em-
ployers respond to a candidate characteristic in the right tail of their distribution
of preferences.41 To make this concern concrete, Appendix B.4 provides a simple
graphical illustration in which the average preference for a characteristic differs from
the preference in the tail of the distribution.42
An advantage of the IRR methodology, however, is that it can deliver a granular
measure of hiring interest to explore whether employers’ preferences for character-
istics do indeed differ in the tails of the hiring interest distribution. We employ two
basic tools to explore preferences across the distribution of hiring interest: (1) the
empirical cumulative distribution function (CDF) of hiring interest ratings and (2)
a “counterfactual callback threshold” exercise. In the latter exercise, we impose a
40
Matching the underlying distribution of characteristics in hypothetical resumes to the distri-
bution of real candidates is also an issue for resume auditors who must contend with a limited
number of underlying resumes (i.e., resumes that they alter to create treatment variation). Given
uncertainty about the characteristics of candidates and the limited number of underlying resumes,
resume auditors may not be able to perfectly match the distribution of characteristics of a target
population. An additional advantage of the IRR methodology is that it involves collecting a large
number of resumes from an applicant pool of real job seekers, which gives us information on the
distribution of candidate characteristics that we can use to re-weight the data ex post.
41
A variant of this critique was initially brought up by Heckman and Siegelman [1992] and
Heckman [1998] for in-person audit studies, where auditors may be imperfectly matched, and was
extended to correspondence audit studies by Neumark [2012] and Neumark et al. [2015]. A key
feature of the critique is that certain candidate characteristics might affect higher moments of the
distribution of employer preferences so that how employers respond to a characteristic on average
may be different than how an employer responds to a characteristic in the tail of their preference
distribution.
42
In a case where there is a conflict between average preferences and preferences in the tail, it is
unclear which preference we care about for policy. For example, we may care about the preference
at the relevant thresholds for callback or hiring, but we may also be interested in whether those
preferences are robust to a hiring expansion or contraction where those thresholds change.
22You can also read