Scientific RepoRt 2019 ccR
←
→
Page content transcription
If your browser does not render page correctly, please read the page content below
Scientific Report
    2019 CCR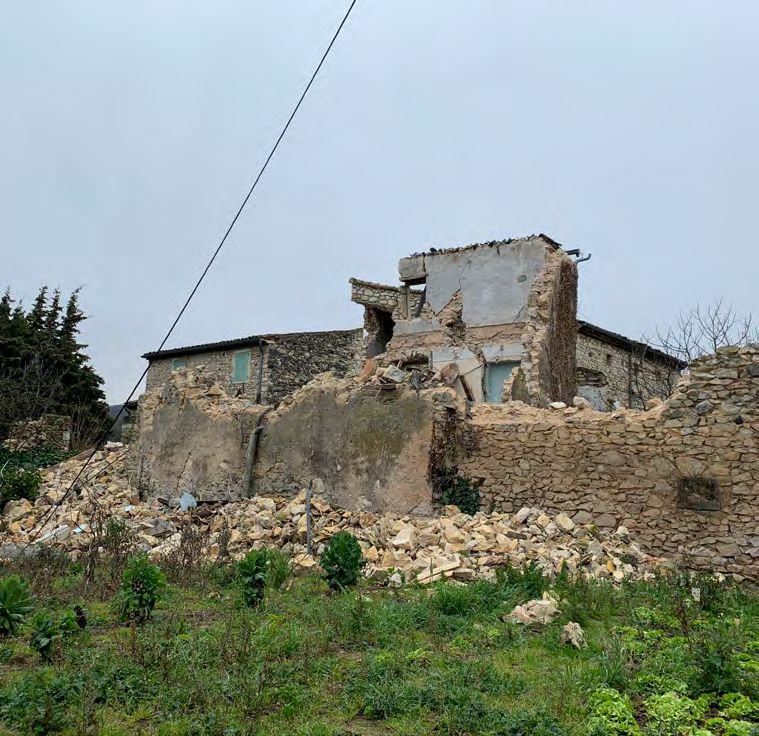
contents

 01        Editorial by Antoine Quantin,
            Chief Underwriting Officer - Public
            Reinsurance and Guaranty Funds
     02     2019 Retrospective
     06     CCR publications
     07     Outlooks by David Moncoulon,
            Head of Department R&D
            Modelling - Cat & Agriculture

 08         cliMAte risks                         42	CLI   NGE

     09     Contributions of satellite             43       Modelling climate change
            imagery to the characterization                 impacts on oversea territories
            of floods
                                                   47       Modelling crop losses
     14     Modelling urban runoff                          at horizon 2050
     18     Nature-based solutions: the
            European project H2020 NAIAD
     23     Propagating uncertainties in          51        DAtA science
            the marine submersion model
                                                  52        Quantile mixing and
     28     Modelling the geotechnical
            drought                                         model uncertainly measures
                                                  56        Modelling insured values
                                                  59        Using the text-mining
33        geologicAl hAzArDs                                in reinsurance

34        Measuring seismic exposure
38        Measuring earthquakes’                  62        CCR Cat Nat AWARD
          consequences                            64        Citations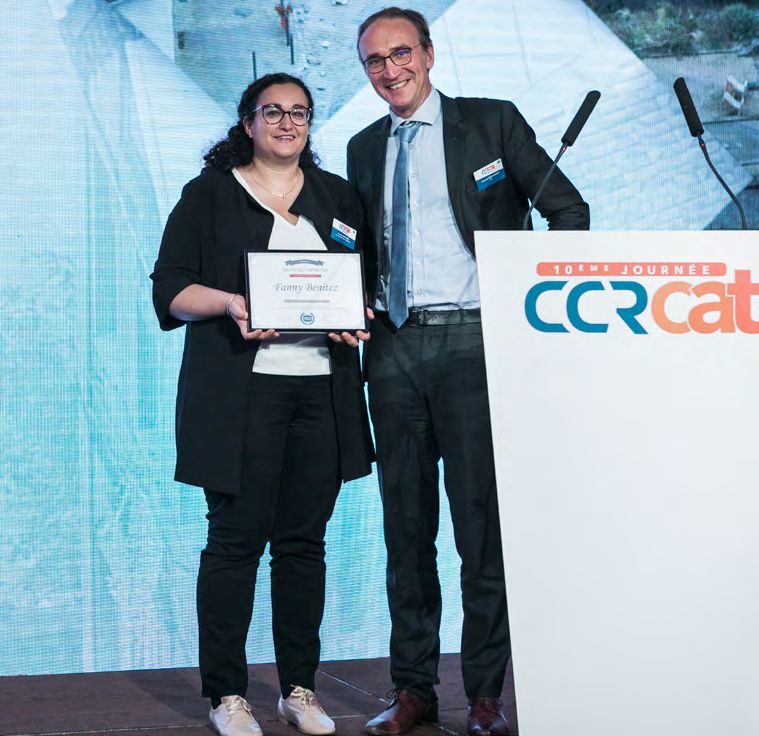
e D ITORI A L
“This second edition of
the CCR’s scientific report
takes the format of
scientific papers co-written
with our partners.”
Antoine Quantin,
Chief Underwriting Officer - Public
Reinsurance and Guaranty Funds
W hat is the cost of damage caused
by an event that has just occurred? What
Year after year, to reach those objectives,
CCR has been associated to renowned
is the distribution of probable losses for scientific partners, at the forefront of
the State, for CCR or for an insurance which, we can quote Météo-France and
company? What are the uncertainties the French Geological Survey (BRGM), as
for those estimations and how to reduce well as lot of schools or universities.
them? What is the obtained benefit of
prevention measures implemented or In order to highlight this partnership ap-
envisaged? What is the expected impact proach, this second edition of the CCR’s
of climate change? scientific report, takes the format of scien-
tific papers co-written with our partners.
It is a set of issues at the heart of CCR’s This is the moment for me to thank them
reinsurance and prevention activities. To for their support in the service of risk
respond to these questions it is neces knowledge and beyond the resilience of
sary to develop a fine knowledge of risks, territories and risk prevention. /
by focusing on collecting and processing
data and on the modelling of physical
phenomenon, from hazard to damage
estimation.
CCR is performing these different tasks
since more than 20 years, based on the
implementation a team of pluridisplinary
experts, on the development of analysis
and modelling tools.
Scientific Report 2019 CCR 01
2 0 19
Retrospective
FEBRUARY 27th/
Paris 7°
UNESCO HQ,
Operandum project
Operandum project welcomed European
projects related to risk prevention and APRIL 2nd/
the climate change adaptation topics to Paris 9°
make a presentation of their researches French High Committee
and results. The NAIAD project has been for National Resilience
presented by focusing on hazard and in- (HCFDC)
sured damage modelling.
Several times per year, the HCFDC orga-
nizes technical round tables. For example,
MARCH 25 – 26th/ CCR has been invited in April, during the
Montpellier technical talk on “Which strategy of re-
silience for 2025-2030?”. The economic
Montpellier, National interest of a resilience approach for orga-
Conference on Natural Risks nization has been discussed.
MARCH 28th/
(ANRN), AFPCN Paris 15°
Partner of the 2019 ANRN, CCR was the
Great Witness – with Météo-France – for AFPCN Workshop, MAY 13 – 17th/
climatic questions and participated in « Extreme events Milan, Italy
round table and participative workshops. and climate change » MiCo Milano Congressi,
The ANRN have notably made it possible The French Association for Natural Disas- Living Planet Symposium
to highlight the partnerships between ac- ters Prevention has organized a workshop 2019 (ESA)
tors in loss prevention and compensation. dedicated to the impact of climate change
The conference Living Planet Symposium
on different types of extreme events. CCR
of the European Spatial Agency is organ
intervened in the third part of the day with
ized every three years. In 2019 the meet
a thematic on the public policy actions
ing has been organized with the support
and focusing on “insurances and climate
of the Italian Spatial Agency. The Living
change”.
Planet Symposium focuses on Earth Ob-
servation and provides a contribution to
APRIL 2 – 5th/ the scientific world and to the overall so-
Cape Town, South Africa ciety. During the different workshops and
lectures, ESA, actors involved in the spa-
Actuarial Society tial area and the experts in remote sensing
of South Africa demonstrate the capacity of new satellite
The congress of the International Asso- technologies to transform the traditional
ciation of Actuaries had for thematic “The area of Earth Observation.
Modern Actuary: Challenge, Influence,
Lead” with objective to perform a state of
the art of knowledge in actuarial science.
The R&D research regarding “A quantile
mixing approach for the combination of
experts’ models” have been presented.
02
JUNE 27th/
Brest
Euro Institut d’Actuariat/
Optimind, Workshops
dedicated to diversity and
innovation
For the 30 years of EURIA, these days
MAY 26th/ have been organized to highlight the di-
Paris 12° versity of issues dealt by today’s actuaries
Salons de l’Aveyron, and the challenges for the future. It was
10th CCR CAT DAY the occasion to present the work on “nat
ural disasters and climate change: what
Considered as the annual meeting for
MAY 28-30th/ are the issues for the insurance sector and
the French insurance sector, this day is a
Lisbon, Portugal the actuaries ?”.
moment of knowledge exchange on nat
CCB, 4th European Climate ural disasters and their consequences.
Change Adaptation This year the thematic “solidarity and
JULY 3rd to 5th/
conference (ECCA) responsibility towards catastrophic risks”
Nantes
gathered around 200 participants from
This international meeting gathers all ac- Universal Exposure
the insurance sector, the scientific commu
tors involved in climate change and risk on the Sea XXL,
nity and the experts involved in natural
reduction topics. The NAIAD project’s Oceanext 2019
disasters. The CCR Cat Nat Award has
results have been presented during the
been delivered to Fanny Benitez for her Launched in 2016 by the Coselmar pro-
session so-called « The insurance value
PhD thesis on the issue “Coping or living gram, the pluridisciplinary and interna
of nature – ecosystem-based solutions
with disasters? Adaptive capacities and tional conference Oceanext of this year
to increase the resilience against climate
capabilities in individual and territorial was dedicated to the thematic “Building
change and natural disasters ».
resilience trajectories within the Caribbean the future of marine and littoral socio-
space”. ecosystems”. CCR has presented its works
MAY 26th/ on « Evaluation of climate change impact
Paris 4° over damages caused by coastal flooding
JUNE 17th/ in France ».
Hôtel de Ville, “Météo & Paris 14°
Climat”, 16th International Hôtel Marriott Rive Gauche,
Forum of meteorology Institute of Actuaries,
and climate 18th Congress of Actuaries
The association “Météo & Climat” or-
Unavoidable event for the place and for
ganizes an unavoidable meeting for the
the Institute, the thematic of the congress
education and the mobilization around
was, this year, around the climate change
climate issues dedicated to both people
issues as actuarial subject. Based on its
and professionals. CCR has participated in
expertise in the area, CCR participated in
the participative debate “towards natural
the workshop “Climate change impact on
disasters, adaptation and prevention to
the costs of natural disasters by 2050” by
avoid the worst”.
presenting the results of the 2018-climate
change study and with a special regards
on overseas territories. >
Scientific Report 2019 CCR 03
> SEPTEMBER 26th/
Paris
Fondation Xavier Bernard
de l’Académie d’Agriculture
The award of graduation thesis of the
Xavier Bernard Fundation is attributed
by a commission composed of members
of the Fundation, of the Academy Office
and experts, and has awarded the gradua-
tion thesis of Kapsambelis D., entitled [in
French] “Analysis of crop losses at farm
level in the context of multi-risk climate
JULY 10th/ insurance in mainland France”.
San Diego, United-State
ESRI, International Meeting SEPTEMBER 10 – 13rd/
of ESRI users Nancy
During this international meeting of GIS University of Lorraine,
users, CCR received the Special Achieve- Ring, 30th Ring Meeting
ment in GIS Award (SAG) for its expertise
The annual meetings organized by
in GIS to model natural disasters and for
the RING team are the occasion for re
the use of GIS web tools for the diffusion
searchers and students in geology to
and the valorization of the research.
exchange on their researches through
workshops, scientific posters, working
AUGUST 10 – 16th/ groups. The on-going PhD research at
State College, CCR have been presented “Stochastic
Pennsylvania, estimation of annual frequencies of main
United-States shock in France”.
SEPTEMBER 24 – 27th/
International Association Strasbourg
for Mathematical SEPTEMBER 9 – 13rd/ French Association of
Geosciences (IAMG) Copenhagen, Denmark Earthquake Engineering
This 20 th IAMG conference gathered European Conference (AFPS), 10th Quadrennial
scientists working in the area of geo- for Applied Meteorology Meeting
mathematics and geo-modelling. The on- and Climatology Dedicated to a large audience and pro-
going PhD research at CCR have been
This annual meeting is dedicated to cli- fessionals this meeting gathers oral and
presented “Regional and exhaustive
mate and meteorological issues, with a poster sessions. This year the thematic
French seismic catalogues”.
dedicated topic to agricultural meteoro- was “the society towards seismic risk:
logy. The on-going PhD research at CCR knowledge, protection and crisis man
have been presented “Impact of climate agement”. The on-going PhD research
change on agricultural economic losses at CCR have been presented [in French]
in France: modelling drought and frost “Stochastic generation of seismic cat
events in 2050 and their impact on agri- alogues for the French area” and “Earth
cultural yield loss rates”. quake: how to ensure the economic resi-
04
lience?” and “Calibration of attenuation
laws by simulating seismic wave propaga-
tion”.
OCTOBER 3rd/
Paris-Saclay
EDF Lab, Climate Day –
knowledge for action
NOVEMBER 21st/
This Climate Day has been organized by
Marne-la-Vallée, SHF
the EDF Lab. CCR has been invited to
present its R&D activities regarding cli- SHF Meeting: littoral and
mate change. climate change
OCTOBER 10th/
During the SHF Meeting, a seminar dedi-
Aubervilliers
cated to the littoral and climate change
OCTOBER 6 – 9th/ ESRI, GIS 2019 has been organized, CCR has shared
Bordeaux For the 2019 ESRI GIS meeting, CCR results of climate change study “conse-
35th Congress of the awarded by the SAG Award, has been quences of climate change on insured
International Association of invited to demonstrate [in French] “Spa- damage related to marine submersion.
Crop Insurers (AIAG) tial analysis methods and implementation Foresight at horizon 2050”.
within the reinsurance sector” and “ben
France is one of the members of the
efits of satellite imagery in the character
AIAG, this year in Bordeaux more than NOVEMBER 28th/
ization of floods in France: from hazard
400 participants from 40 states partici- Paris 6°
mapping to damage estimation”.
pated in the congress of French crop
insurers. The main thematic was “Risk Hôtel de l’Industrie,
Management for Agricultural Production, Météo & Climat,
OCTOBER 16 – 18th/ Scientific Meeting
Climate Volatility and the Role of the In-
Nice
surance Sector and the State”. CCR has Official partner of the Météo & Climat’s
shared results on “modelling crop losses Integrated Disaster Risk Scientific Days, CCR members partici-
towards climatic hazards”. Management (IDRIM), pated in the 11th meeting on the “Climate
10th IDRIM Conference change sustainable management of lands
for a safer world and food security” topic.
The CNRS, UMR Espace and AFPCN have
organizard the 10th IDRIM Conference
dedicated to the resilience of small areas NOVEMBER 28th/
and to the organization of risk manage- Lyon
ment and reduction. CCR was a member Plan Climat Energie Territorial
of the scientific community and also pre- Grand Lyon, Energy and
sented a lecture “Evaluating Financial Im- Climate Meeting
pact of Earthquakes for France within the
In the frame of the CCR results on the im-
Natural Disasters Compensation Scheme
pact of climate change on insured losses
- Benefits from a new modelling tool for
in France, the PCETGL has welcomed
both prevention and compensation”.
CCR to participate in the round table “Fi-
nances and Climate”.
Scientific Report 2019 CCR 05
CCR P u b l i c at i o n s

Cohignac T., and Kazi-Tani N.      Marchal R., Piton G.,             Onfroy T., Moncoulon D.,
2019. “Quantile Mixing             Lopez-Gunn E., et al. 2019.       et Faytre L. 2019.
and Model Uncertainty              “The (Re)Insurance Industry’s     “Étude expérimentale
Measures.” [sub.] https://hal.     Roles in the Integration of       sur le risque inondation
archives-ouvertes.fr/hal-          Nature-Based Solutions            dans le bassin versant
02405859                           for Prevention in Disaster        de la Bièvre.” In Cahiers
                                   Risk Reduction—Insights           de l’ONRN, 3:35–47.
Desarthe J. 2019. Les RETEX        from a European Survey.”          Le Partage Des Données Pour
dans l’histoire : une pratique     Sustainability 11 (22): 6212.     Une Meilleure Connaissance
ancienne dans la gestion           https://doi.org/10.3390/          Des Risques Naturels. ONRN.
des risques. In Proceedings        su11226212.
of the Acte du Colloque                                              Tourjansky L., Goislot D.,
Géorisque n°8; Montpellier,        Marchal R., et Moncoulon D.       et Bauduceau N. 2019.
France, 2019.                      2019. Modélisation de             Les Solutions d’adaptation
                                   l’efficacité et analyse coûts/    fondées sur la Nature dans
Giacona F., Martin B.,             bénéfices des Solutions           la politique de prévention
Eckert N., et Desarthe J. 2019.    fondées sur la Nature face        et de gestion des risques
Une méthodologie de                aux risques d’inondation et       et des catastrophes naturels.
la modélisation en géohistoire :   de sécheresse, Projet H2020       In Des Solutions fondées
de la chronologie (spatialisée)    NAIAD. In Des Solutions           sur la Nature pour s’adapter
des événements au                  fondées sur la Nature pour        au changement climatique,
fonctionnement du système          s’adapter au changement           Rapport de l’Onerc au Premier
par la mise en correspondance      climatique, Rapport de l’Onerc    ministre et au Parlement; Paris,
spatiale et temporelle.            au Premier ministre et au         France, 2019; pp. 176–183.
Physio-Géo 2019, Volume 4.         Parlement; Paris, France, 2019;
                                   pp. 172–175.
Gouache C., Bonneau F.,
Tinard P., et Montel J.-M. 2019    Moncoulon D. 2019. “Cyclones
(soumis). Estimation of main       and the Global Impact of
shock frequency - magnitude        Climate Change.” Intelligent
distributions by adapting the      Insurer. October 16, 2019.
inter event time method for        https://www.intelligentinsurer.
low-to-moderate seismicity         com/contributed-article/
areas. Application to French       cyclones-and-the-global-
mainland.                          impact-of-climate-change.

Kapsambelis D., Moncoulon D.,      Moncoulon D. 2019.
and Cordier J. 2019.               “Régime d’indemnisation
“An Innovative Damage Model        des catastrophes naturelles :
for Crop Insurance, Combining      les enjeux de la modélisation,”
Two Hazards into a Single          In Revue Banque No. 837
Climatic Index.”                   (Novembre 2019) p18–19.
Climate 7 (11): 125.
https://doi.org/10.3390/           Naulin J-Ph., Moncoulon D.,
cli7110125.                        et Quantin A. 2019.
                                   “Modélisation déterministe
                                   et probabiliste des
                                   dommages assurantiels
                                   causés par les phénomènes
                                   de submersion marine
                                   en France métropolitaine.”
                                   La Houille Blanche, no. 3–4
                                   (October): 130–39.
                                   https://doi.org/10.1051/
                                   lhb/2019022.

06
outlooks
“CCR R&D teams
are involved to provide
a technical expertise
to ongoing researches in
the insurance sector.”
David Moncoulon,
Head of Department R&D
Modelling - Cat & Agriculture
S ince 2015, the researches perfor-
med by CCR and its partners, especially
tion. The consequences of those events
will be simultaneity studied from this com-
sults in the next months.
An emphasis will be done in the next years
Météo-France, have demonstrated the mon situation. The consequences will also concerning the development of industri
increase of economic and insured dam be studies simultaneity for different areas: alized models, to project them on new is-
ages for the next decades on the French agriculture and crop losses, natural disas- sues (new hazards, new territories), in short
national area. This increasing exposure ters and economic damages. This innova- delays to respond to the emergence of
concerns all economic sectors, from tive approach will be based on the pursuit new subjects for public policies.
damages to assets (dwellings, industries) of on-going research projects (ANR PICS, The evolution of those models will allow
to crop losses for farmers. It is notably TIREX or European project NAIAD) and their deployment to realize studies at local
due to the climate evolution and its im- thesis in collaboration with scientific insti scale for organisms in charge of loss pre-
pact on the frequency and the severity tutes dedicated to applied researches vention, in order to assess, notably, the
of extremes events and also due to the (INRAE, ENSG, Ecole des Mines, Agro- costs and benefits of the actions imple-
increase of insured assets located in high campus Ouest). mented. Today, the fine and precise mo-
risk areas. The drought topic becomes notably es- delling, at different scales, is an effective
The insurance schemes have to change sential for all economic sectors, due to tool to improve risk knowledge exposure
and to adapt themselves to cope with major events occurred since 2015 and cli- of our territories. Beyond this knowledge,
the progression of the claims for the next matic models’ projections. The predicted it allows to test hypotheses for adapting
decades. CCR R&D teams are involved increase of those phenomena require a prevention and protection policies. /
to provide a technical expertise to on- finest knowledge of this hazard in order to
going researches in the insurance sector propose adaptive systems and to assess
and for a better implementation of loss their consequences.
prevention. After the Teil’s earthquake, the return on
Traditional models are evolving towards experience will increase the knowledge
a multi-hazards approach integrating fu- regarding the peril and the modelling
ture climatic scenarios to measure the of its consequences. In parallel, CCR is
financial exposure. Then, floods, marine developing its own earthquake exposure
submersion and drought events will be model in mainland France and in oversea
simulated from a common climatic situa- territories and will be able to share the re-
Scientific Report 2019 CCR 07
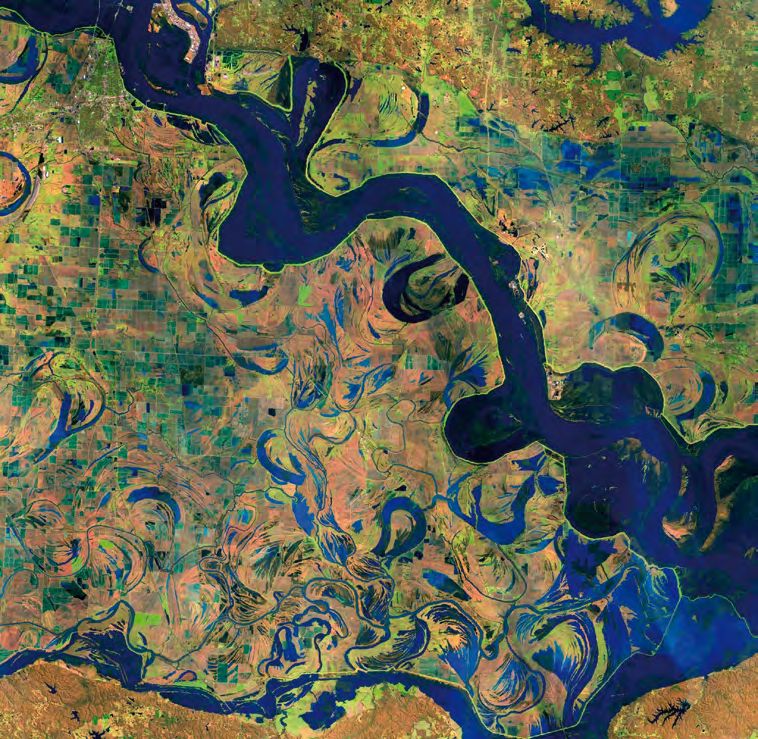
C l i mat e
risks

08
Contributions of satellite imagery
to the characterization of floods
Thomas Onfroy 1, Anas Nassih 2
(1) Department R&D Cat & Agriculture Modelling, CCR. (2) Master
2 IGAST (Geographic Information: Spatial Analysis and Remote Sensing) de l’ENSG (School of Geomatics)

ABSTRACT
In recent years, insurers and reinsurers       medium to high resolution satellite           # remote sensing
have been increasingly relying on              imaging data collected by Landsat-8,
space technologies to develop their            Sentinel-2, and Sentinel-1. The methods       # flooding
knowledge of risk and to estimate flood-       have been applied on three major flood        # insurance claims
related damage more accurately. This           events that occurred in mainland France:
Remote Sensing project demonstrated            Seine and Loire in May-June 2016, Seine       # insurance indicators
the potential of EO data and remote            and Marne in January-February 2018,
sensing methods in characterizing              and Languedoc in October 2018.
overflow flooding phenomena and
estimating insured damage from

Introduction

Nowadays, remote sensing is a valuable         and radar satellites are able to cover very   radar satellites, on the other hand, can
tool for mapping and monitoring natu-          large areas: up to 400 km for Sentinel-1      observe earth surface and floods through
ral disasters, especially flood events. It     radar satellites, 185 km for Landsat-8        clouds, day and night.
is an earth observation discipline based       (NASA/USGS) and 290 km for Sentinel-2         In 2019, CCR wanted to implement reliable
on the measurement of electromagnetic          (ESA). Satellite imagery data can be used     remote sensing methods that would en-
radiation emitted or reflected by surface      to monitor floods in real time or a few       able the use of these imaging data, in par-
targets (soil, water, vegetation, buildings,   days after their occurrence 1.                ticular through the involvement of an end-
and so on…) in the visible light or in the     However, during a flood event, the multi-     of-studies project of the Master Degree
invisible spectrum such as near or mid-        spectral data at medium (20-30m), high        IGAST of the School of Geomatics.
infrared light.                                (5-10m) or very high (< 1m) resolutions       The purpose of this research was to com-
Optical satellites acquire images of earth’s   are often altered by the presence of          pare the results of hydrological modelling
surface by receiving different wavelengths     clouds that prevent direct observation        with the flooded areas observed by remote
of the electromagnetic spectrum emitted        of the ground.                                sensing. Medium-to-high resolution satel-
from a surface using an on-board multi-        Their use can be unreliable or even impos-    lite imagery data (Landsat-8, Sentinel-2
spectral sensor. Most of today’s optical       sible in case of total cloudiness, whereas    and Sentinel-1 from 30 to 10 m resolu- >

                                                                                              Scientific Report 2019 CCR          09
Contributions of satellite imagery
to the characterization of floods
Figure 1 - Floods observed on multispectral imagery on the left (© NASA/USGS Landsat-8, 2018)
and on radar imagery on the right (© ESA Copernicus Sentinel-1, 2018).
> tion) for three major events occurring in Moreover, the radar waves have the ability by mathematical operations between the
the metropolitan area from 2016 to 2018 to penetrate the first centimeters of the different spectral bands of the satellite.
were studied: Seine and Loire flooding ground, notably then the ground is water- The results are spectral indices such as the
in May and June 2016, Seine and Marne logged. It makes it possible, under certain MNDWI (Modified Normalised Difference
flooding in January and February 2018, conditions, to distinguish flooded areas Water Index 4, Figure 2).
and Languedoc flooding in October 2018. from non-water areas and to provide de- In order to improve the characterization
Since the end of 2017, the processing and tailed information during the active phase of flooded areas from multi-spectral
post-event analysis of satellite imagery of the flood. Radar waves are sensitive data, a supervised classification using a
data has made it possible to provide in- to the roughness of the surface encoun- Random Forest algorithm was used. The
novative elements for the validation of the tered 2: roughness areas such as buildings classification relied on four main classes:
overflow flooding model’s results. and relief crests for example, have an im- water, soil, vegetation and wetland areas.
portant radar reflectivity and appear in Validation of the results was performed
light tones. On the contrary, smooth sur- using a confusion matrix. This method
Methodology faces appear in dark tones, which is the was applied for Languedoc 2018 floods
case for flooded areas. Raw radar images on Landsat-8 images acquired eight days
Radar satellites have the ability to acquire are processed using remote sensing soft after the event. Soils still waterlogged a
images of earth’s surface in whatever ware ESA SNAP. A radiometric threshold is week after the flood allowed the detec-
weather conditions. This is due to the defined to distinguish water surfaces from tion of flood leads.
ability of radar waves to operate outside non-water surfaces 3 (Figure 1). Radar imagery data can be also used in
the visible spectrum and to pass through For multi-spectral imagery, the methods dense urban areas following a method
the cloud layer both day and night. used differs. Flooded areas are detected based on interferometric coherence 5.
10Figure 2 - Extraction of flooded areas from the optical image (© ESA Copernicus Sentinel-2, 2018)
with MNDWI index (Languedoc 2018)
In the most urbanized areas, interfero interest in the interferometric coherence resulting from GIS post-processing of the
metric coherence makes it possible to method. observed areas.
define the buildings flooded during an In order to be considered in the damage For optical imagery, the MNDWI index
event 6. This method establishes cross- simulation, the flooded areas from image- was selected because it allows a finer
correlation between two radar images: ry have to be extracted in terms of water and more efficient delineation of water
one just before and one during the heights. Thus, from a Digital Terrain Model surfaces. The Random Forest classification
flood 7. The buildings have a very stable (IGN’s DTM at 25m resolution), the water proved very effective in defining the dis-
coherence value in normal times (near 1). heights resulting from overflow observed tribution of the flooded areas within the
During a flood, the coherence value of the by remote sensing are obtained through au- major river bed from the learning areas
building decreases (between 0.5 and 0.6). tomated geomatics processing in a Model integrated in the algorithm.
It is the decrease in the coherence value Builder workflow (Esri ArcGIS ®). This tool In the assessment of a supervised classifi-
which allows, a priori, to distinguish flood crosses-reference input data (DTM, hy- cation from a confusion matrix, when the
ed buildings from non-flooded ones. drography, major river beds, etc.) with the Kappa index 8 is between 60% and 80%,
However, the coherence values of the flooding areas resulting from remote sensing. the classification is considered as viable
vegetation or other types of land-use next and the results can be exploited. In this
to buildings can also decrease between case, the Kappa index obtained was
the two periods observed on the images. Results 96.2%, with an overall accuracy of 97.7%.
To avoid false alarms, the European set The results of the classified image are sat
tlement map foot spatial layer was used The application of remote sensing meth isfactory and usable.
to mask the other types of land-use and ods to the three studied events resulted in The results of the method based on
to retain only buildings, the only object of overflow hazard maps and water heights interferometric coherence on building >
Scientific Report 2019 CCR 11Contributions of satellite imagery
to the characterization of floods
Figure 3 - Results of water heights extraction on the Marne (Seine and Marne 2018) and Aude (Languedoc 2018) (background: OpenStreetMap ®)
> allowed a very good detection of flood alarms (POFD): percentage of insurance ference is due to variation of area and of
ed buildings. The result were validated by contracts located in the hazard area but water heights between the two hazards.
comparing it with claims data for the 2016 not damaged; It is especially at the communal level that
and 2018 events. - True Skill Score (TSS): POD subtracted to the cost of damage may vary according to
The next steps were to compare areas ob- the POFD. This score allows to measure the selected hazard.
tained by remote sensing with CCR’s over- the effectiveness of hazard modelling.
flow hazard simulations. The remote sens For example, for the Seine-Loire 2016
ing results were also overlaid on insured event, the POD increases from 69% with Conclusion
claims. The number of claims recorded the CCR model to 86.9% with remote
within remote sensing hazard is higher sensing alone and to 95.4% by combining The added value of satellite imagery, as a
for the three studied events, but it is by the two types of hazards. The POFD does complement to classic models, concern
combining the two types of hazards that not incur any degradation. ing the characterization of overflow ha-
a greater number of claims are identified. The cost of simulated damage according zard was demonstrated on three major
The false alarms are fewer in the remote to the two types of hazards are of the same floods occurred between 2016 and 2018.
sensing hazard area. The following insur order of magnitude for the Languedoc Diverse methods and data were used
ance indicators were calculated: 2018 event, which can be explained by according to the operating conditions of
- Probability of Detection (POD): percent the similarity of flooded areas. On the satellite images. Nevertheless, the remote
age of claims in the hazard area out of the contrary for Seine & Marne 2018 and sensing methods display some limits that
total number of claims; Seine & Loire 2016 there is a difference may affect the quality of the results:
- Probability of False Detection or false in terms of damage assessment. The dif - the use of a threshold for the multispec-
12The partner
In 2019, Anas Nassih student in the Master degree IGAST of the ENSG
worked on a remote sensing project at CCR. The Master 2 IGAST
is co-accredited by the University Paris-Est Marne-la-Vallée (UPEM) and
the School of Geomatics (ENSG) which provide courses in remote
sensing and analysis of geographical data.
tral indexes (optical) or for the radiometric References
thresholding (radar) may generate uncer-
1. Twele A., Cao W., Plank S., 6. Chini et al. 2019.
tainty in the classification between wet Martinis S. Sentinel-1-based “Sentinel-1 InSAR Coherence
and dry areas; flood mapping: a fully to Detect Floodwater
automated processing chain. in Urban Areas: Houston and
- the unavailability of images the day or in International Journal of Hurricane Harvey as A Test
the day following the flooding; Remote Sensing 2016, Case.” Remote Sensing 11 (2):
37, 2990–3004. 107. https://doi.org/10.3390/
- the use of interferometric coherence rs11020107
between images acquired at different 2. Curlander J.C., and
dates and for which terrain condition R.N. McDonough R. F., 7. Angiati et al. 2010.
1991. “Synthetic aperture “Operational Evaluation
may have changed (e.g. state of vegeta- radar - Systems and signal of Damages in Flooded
tion, presence/absence of vehicles, and processing”, John Wiley & Areas Combining Cosmo-
Sons, Inc, New-York. Skymed and Multispectral
so on...) Optical Images.” 2010. IEEE
Nevertheless, these methods improve 3. Long S., Fatoyinbo T.E., International Geoscience
Policelli F. Flood extent and Remote Sensing
hazard zoning and damage estimation. mapping for Namibia using Symposium, 2414–17.
They have now been implemented in the change detection and https://doi.org/10.1109/
process of post-event damage estima- thresholding with SAR. IGARSS.2010.5651502
Environmental Research
tion. / Letters 2014, 9, 035002. 8. Landis et al. 1977. “The
Measurement of Observer
4. Xu et al. 2006. Agreement for Categorical
”Modification of Normalized Data“ International Biometric
Difference Water Index Society, https://www.jstor.org/
(NDWI) to Enhance Open stable/2529310?seq=1
Water Features in Remotely
Sensed Imagery” International
Journal of Remote Sensing,
https://www.researchgate.net/
publication/232724072
5. Hanssen R. F., 2001.
“Radar Interferometry –
Data Interpretation and
Error Analysis“, 308 pp.,
Kluwer Academic Publishers,
Dordrecht, The Netherlands.
CITATION
Onfroy et al., Contributions
of satellite imagery in the
characterization of floods.
In Scientific Report CCR
2019 ; CCR, Paris, France,
2020, pp. 09-13.
Scientific Report 2019 CCR 13Modelling urban runoff David Moncoulon 1, Thomas Onfroy 1, Zi-Xiang Wang 1, Roxane Marchal 1 (1) Department R&D Cat & Agriculture Modelling, CCR ABSTRACT Flood modelling has been at the heart multiple partnerships with Météo- # floods of the CCR R&D activities for more France, of real-time alerts provided by than 15 years. The flood model is used the company Predict, and of Sertit and # runoff hazard to simulate hazard and to estimate ESA satellite imagery. Furthermore, the # catastrophe loss model losses in case a natural disaster occurs. model contributes to on-going research A probabilistic version of the model projects, adaptations are added for # claims is developed in parallel to assess the case studies (e.g. Cost-Benefit Analyses) # public stakeholders flood risk exposure of ceding companies or to respond to requests from and of the State. The impact model of territorial authorities. # prevention river overflow and runoff phenomena is regularly updated. CCR’s expertise has shown that a significant part of the flood losses are due to surface runoff. In order to continuously improve flood modelling, CCR takes advantage of Introduction Modelling overflow and runoff hazards to measure the financial flood exposure hazard but also to urban runoff. has been at the heart of CCR’s Research of the State, of CCR, and of insurance In 2019, the flood model was used several and Development activities for more than companies. times for real-time event monitoring, nota 15 years 1. It is an operational model to Thanks to the large number of flood bly during the October, November and De- characterize flood and to simulate real events simulated since the implementa- cember floods in Occitanie, in the South- events. This model, regularly updated, tion of the model, and based on its conti- East and in the South-West of France. The is calibrated on a selection of historical nuous improvement, CCR has acquired an model was also applied and improved events occurred in France from 1999. For expertise in estimates of flood damage. for projects realized for insurance com- the events that have not occurred but are This knowledge of water-related risks has panies, for research projects like the ANR probable, a probabilistic model based on demonstrated that a large part of the (PICS) and H2020 (NAIAD), and for studies a catalogue of fictive events is developed flood losses is not only due to overflow dedicated to local authorities. 14
Methodology provided by IPR and sewage system to take into account local issues in terms
networks provided by the Val-de-Marne of hazards and according to the availa-
The runoff model simulates surface water Department of Environmental and Sani- bility of detailed local data. Considering
flows at any point on the territory when tation Services have been integrated in the area of studied catchments, the mod
the intensity of rainfalls exceeds the infil- the flood model. el has been modified to calculate the
tration and the soils’ water retention ca- Moreover, to respond to requests from slopes by overlaying hourly water levels
pacity. It is performed for all catchments local and regional public authorities, to the DTM. Also, in the urban area, a
and ungauged water courses. Then, sur- the runoff model, on the perimeter of fictive pluvial sewage systems has been
face flows are distributed on the slopes of intervention of these actors, has been modelled to consider the absorption of
the Digital Terrain Model (IGN DTM-25 m improved in order to produce the runoff decennial hourly rainfall by underground
resolution). In addition, the runoff model intensity in cubic meters per second for sewage systems.
is also based on input data such as rainfall different return periods. Finally, the model is also used for internal
and land-use types (Figure1). Furthermore, CCR’s rainfall-flow model R&D projects. As shown by the research
For the simulation of real events, the is highlighted in the context of research on the consequences of climate change
precipitation data are acquired from the projects. For example, in the study of on overseas territories, in partnership with
Météo-France library for all rain gauge flood events on two demonstration Météo-France anw d RiskWeatherTech
stations available and Antilope images. sites in France, the October 2015 flood (cf. Oversea article p.43). The runoff model
Meteorological parameters used by the event on the Brague catchment and the has been transposed to oversea territories
model are daily rainfall, hourly rainfall 2014-flood events on the Lez catchment. to be used in the same manner as for the
and PET (Potential Evapo-Transpiration) The insured losses due to the flood metropolitan area. New input data includ
representing the theoretical amount of events have been analysed in the frame ing a DTM, a division into sub-catchments
water that evaporates from the soil or is of the European project called NAIAD and land-use have been integrated.
transpired by vegetation. (cf. NAIAD article p.18). A large part of The rainfall data are coming from the
The probabilistic runoff model relies on the insured damage are due to runoff 400 fictive years at current climate extract
a catalogue of thousand fictive events in these flood events. Methodological ed from Météo-France ARPEGE-Climat
simulated and based on rainfall data changes have been done in the model model. >
from the Météo-France climate model,
ARPEGE-Climat.
Land-use types described in the Corine
Land Cover database at a 250 m reso-
lution are used in the runoff model to
Data Models Results
characterize the flows and infiltration on
different types of surfaces. For each land-
use type (among 8 main types) roughness Rain gauges and
Maximal flows
Météo-France Runoff model: Flows in the talwegs
values are especially defined. Antilope images Ungauged water courses
throughout the
country
In addition to its use for real-time event
monitoring, the runoff model can be PET
adapted to carry out studies and analy-
sis of exposure to water-related risks on a Overflow model:
Measured flows Maximal water
Main gauged water courses
finer scale, on a targeted area, a commu- at stations heights
Overflow in the major riverbed
nity, or on small catchments for example.
That is the case for the experimental flood Parallelization
risk study performed for the Bièvre catch- IGN DTM 25m CorineLandCover Computing
ment (Val-de-Marne) led in partnership cluster
with the Paris Region Institute (IPR) 1. De-
tailed land-use data on the area (MOS) Figure 1 - Functional scheme of the flood model
Scientific Report 2019 CCR 15Modelling
urban runoff
> Results
For all ungauged water courses and for
each catchment, the runoff model repro-
duces surface flows from rainfall data,
and outputs, for each mesh of the DTM,
a value of the maximal flow reached dur
ing the event. Thus, the flows are distrib
uted on the DTM slopes and converging
downstream towards the talwegs.
The operational results related to the cli-
matic events are hazard maps modelling
local floods. For example, the result of the
simulation of the december 2019 flood
that occurred in the South-East of France,
in Bielle in the Pyrénées-Atlantiques re-
Figure 2 - December 2019 flash flood in Bielle (Pyrénées Atlantiques), CCR runoff model.
gion (Figure 2).
As regards the simulation of probable
events, a catalogue of one thousand fictive
event provides a distribution of maximal
runoff flows for the entire territory. This al-
lows to estimate hazard intensity on each
DTM mesh for a given return period. The
frequency of the phenomenon appears
higher in waterproofed areas than in the
areas covered by vegetation (Figure 3).
The study realized on the Bièvre catch-
ment is based on an improvement of the
input data quality for the flood model
(surface occupation data and sewage sys-
tems) participate in the implementation
of an infra-community exposure index
combining flood risk due to surface flows
modelled by CCR and flood risk due to
upwelling from sewage systems (Figure 4).
This index highlights the areas most ex-
posed to water-related hazards. The result Figure 3 - Probabilistic runoff in the la Ciotat area (Bouches-Du-Rhône).
has been linked and validated by geolo-
calized claims that have been calculated
for each 250m-mesh, with an important off according to four classes of intensity
number of claims (107/177) in the “high” have been shared for each return periods.
risk class. The mean annual losses modelled for the
Concerning the local authorities’ re- flood hazard in the frame of the Nat Cat
quests regarding an improvement of scheme and aggregated at the commu-
their knowledge of their exposure to ur- nity level have also been studied and
ban runoff, the maps classifying the run shared with the stakeholders.
16Conclusion Références
1. Moncoulon, D., Labat, D., 2. Onfroy T., Moncoulon D.,
The model simulates occurred events and Ardon, J., Leblois, E., Onfroy, and Faytre L. Étude
estimates the amount of insured damages T., Poulard, C., Aji, S., Rémy, A., expérimentale sur le risque
and Quantin, A. 2014. Analysis inondation dans le bassin
due to both overflow and runoff floods. of the French insurance market versant de la Bièvre.
The model is operational both when a exposure to floods: a sto- In Cahiers de l’ONRN;
chastic model combining river Le partage des données pour
natural disaster occurs or for specific overflow and surface runoff. une meilleure connaissance
studies in the frame of research projects Natural Hazards and Earth des risques naturels; ONRN,
or requests from local authorities. Finest System Science 14:2469–2485. 2019; Vol. 3, pp. 35-47
local input data can easily be integrated in
the model, which limits uncertainty due to
the quality or the accuracy of data.
The development of studies in the form CITATION
of partnerships contributes to reinforcing
Moncoulon et al.,
risk knowledge on urban runoff and can Modelling urban runoff.
be used to foster damage prevention In Scientific Report
CCR 2019 ; CCR, Paris,
policies. / France, 2020, pp. 14-17.
Exposure Index
(250m-mesh)
Risk - (exposition score in %)
No risk (0%)
Low (< to 15%)
Moderate (15 à 30%)
High (30 to 60%)
Very high (> to 60%)
Figure 4 - Exposure index to water-related risks aggregated at a 250m-resolution
mesh (Bièvre catchment, Val-de-Marne) 2.
Scientific Report 2019 CCR 17Nature-based solutions:
the European project H2020 NAIAD
Roxane Marchal 1, Guillaume Piton 2
(1) Department R&D Cat & Agriculture Modelling, CCR. (2) INRAE Grenoble, Snow Avalanche
Engineering and Torrent Control Research Unit (ETNA)
ABSTRACT
# flood model
The Brague river is one of the
demonstration sites of the H2020 # damage model
European project NAIAD: Nature
Insurance Value: Assessment and
# nature-based solutions
Demonstration (2016-2019). The # preventive measures
approach relies on the assessment of
overflow and runoff hazard, considering # insured damage
locally-adapted data, with the objective # climate change
of modelling avoided damage of
the implementation of nature-based
solutions. The consequences of the
climate change at horizon 2050 on
insured damages were also explored.
Introduction
The European project Horizon 2020 the Brague catchment in Antibes (Alpes- age and the landscape, the environmental
NAIAD (Nature Insurance Value: Assess- Maritimes). This article focuses only on the and the socio-economic co-benefits.
ment and Demonstration (2016-2019)) Brague DEMO. The Brague river is 21 km A fine comprehension of hazards and their
gathers 23 European partners, including long located in the Mediterranean area consequences in terms of insured damage
four French partners: the French Geologi and it is characterizes by destructive and has motivated the collaboration between
cal Survey (BRGM), INRAE, University of potentially murderer flash floods. The stud- INRAE and CCR. The INRAE expertise
Nice and CCR. The objective is to assess ied event is the October 2015 Cevenol has been applied on modelling overflow
and to demonstrate the effectiveness event which took the lives of 20 people hazard and on the use of damage curves
of nature-based solutions (NBS) to re- and the insured damages were estimated recommended by the French Ministry
duce water-related hazards (floods and at €M 520 (non-auto) by CCR. The flood of Ecological and Solidarity Transition
droughts). CCR intervenes principally on risk varies according to the localization in (MTES in French). CCR has adapted its
hazard modelling issues, on assessing the catchment: the low land area is more runoff model and its insurance damage
vulnerability and both current and po- exposed to overflow flooding from Brague curves to perform specific analysis for the
tentially avoided damage related to the river and its tributaries, while the upper Brague catchment. The assurance value of
implementation of NBS. The project is land is exposed to urban runoff. In that NBS has been estimated in terms of mean
based on demonstration sites (DEMOs) context, the assessment of grey or NBS annual avoided damage; the co-benefits
in Europe, and two in France: the Lez preventive measures is necessary. This as- generated by the implementation of these
catchment in Montpellier (Hérault) and sessment concerns both the avoided dam measures has been assessed in parallel 1.
18Methodology
The runoff hazard has been modelled
for the entire catchment. The approach
is based on the CCR flood model 2 with
a resolution of 25m (see: Runoff article).
Concerning the information about the
characteristics and the localization of the
October 2015 claims, the data has been
extracted from the CCR historical claims
portfolio and targeting only residential
homeowners. The climate change model-
ling has been based on the results of the
CCR and Météo-France 2018 study 3.
In addition to this large scale analysis, the
overflow hazard has been finest re-ana-
lysed on the low land where the most
important damages have been recorded.
INRAE has used the 2D-numerical model
Iber 4 to estimate water heights and flows
at 2 m resolution. A recent LIDAR survey
has been used to rebuild the geometry of Figure 1 - Modelling results of simulated water heights compared to
floodmarks collected during the 2015-flood.
the valley and the surveys of the earth’s
topography have been digitalized to
determinate the river bathymetry and
the geometry of numerous bridges and
hydraulic structures located on the river
and its tributaries. The BD Carto® and BD
Topo® data from the IGN have been used
to integrate all the buildings and roads
within the model, and the land-use data
have been checked and revised to mod
el the varying ground roughness. The
two major floods, October 2015 and No-
vember 2011 have been well documented
in recent reports and have been used to
numerically reconstitute these events and
to calibrate the model. More than 400
geolocalized flood leads reached by the
floods have been used to ensure reason
ableness of the calculated water levels
(Figure 1).
Then the SHYREG 5 method has been ap-
plied to calculate the flood events with a
given probability of occurrence under cur-
rent and future climate scenarios (RCP 4.5 >
Scientific Report 2019 CCR 19Nature-based solutions:
the European project H2020 NAIAD
> and 8.5 of IPCC). It has also been used in by numerous tributaries of the Brague
current and future land-use scenarios or catchment have generated floods near or
in the presence of conventional protective above a 100 year flood 7. The joint occur-
measures (retention dams) or NBS. rence of these magnitudes is even rarer.
The MTES has developed standardized The more or less chaotic aspect of the
and national damage curves systemati- flows in the peri-urban area of the lower
cally used to carry out cost-benefit anal Brague valley is partially reproduced by
ysis for the Barnier funds grants to flood the hydraulic models implemented. The
protection projects 6. Damage curves uncertainty related to the flows or to the
are functions highlighting the relation logjam have limited the accuracy regard
between measured damages (rebuild ing the modelled water heights.
ing costs) and hazard intensities (water After the assessment of current risk expo-
heights or flows). sure, it has been possible to assess the
These average curves have been com- effectiveness of preventive measures. For
pared to the observed damage and al- example, regarding the runoff hazard, an
ternative approaches developed by CCR. analysis has been performed by looking
The calibration of damage curves is based at the relation between runoff flows re-
on the use of insured claims data and ap- duction and consequences on damages
plied both on runoff and overflow hazard, whatever the implemented protective
according to the hazard intensity of Iber measures. Without hazard reduction,
model. Then, the damage curves have damages are estimated for the residential
been crossed with hazard modelling from homeowners of €M 4 for the Oct. 2015
the study on the consequences of climate event on the catchment. A decrease of
change on insured losses in France 3. 20% of runoff flows may reduce damage
to €M 3,5 either 12% (Graph below)
Results
Effect of hazard reduction on 2015-flood insured losses
2014 simulated insured losses in the Brague watershed,
The accuracy for flood levels is ±25 cm
amount of losses for residential homeowners (€M).
Damage model calibrated on the 2015 floods on the Brague DEMO.
for the calibration event (Oct. 2015) and Simulation error : -2% (simulated vs real losses).
fewer for the validation event (Nov. 2011).
- For water heights comprised between 45
1,5 and 3,5 m (Iber model 2m-resolution), 40
the destruction rate is around 30% of the 35
insured value. It was also found that areas 30
with water heights of less than 20 cm are 25
generally not affected. It is only from such
20
a height that the storm sewage system
15
are completely saturated and the water
reaches the power grids which significant- 10
ly increasing the damages; 5
- For runoff of 2,5 m3/s 25 m-resolution, 0
0% 10% 20% 30% 40% 50%
the mean destruction rate are around
15% of the insured value. This major loss
% Hazard reduction rate applied to the runoff flow (m3/s) at the insurance policy
is notably correlated to the exceptional scale before damage calculation - 0 represents no hazard reduction.
intensity of the 2015-flood event where
20The partner
INRAE (previously IRSTEA) and CCR are partners since 10 years including
3 years within the NAIAD project (2016-2019). The two partners are sharing
their knowledge regarding both hazards modelling and assessment of insured
damages. A lot of deliverables available on line underline the researches
performed within NAIAD, visit www.naiad2020.eu In 2020, IRSTEA and INRA
merged to become INRAE.
At the low land scale, the NBS scenario losses, a hazard reduction of 45% may
of restoration of the river’s hydraulic and be required to maintain the losses at the
ecological corridor “giving-room-to-the- current level, which is already considered
river” has been integrated in Iber model locally as unbearable (Graph below).
in order to estimate avoided damage due
to the implementation. According to the
estimates and the use of CGDD and CCR Conclusion
damage curves, the mean annual avoided
damage could reached k€ 200-700, either This in-depth and complementary analy-
30% of current mean annual damages. sis of overflow and urban runoff hazards
This without considering protective meas has improved risk knowledge on insured
ures to reduce runoff hazards that have to damage, on the assessment of avoided
be designed locally. Improving the quality damage and on the co-benefits resulting
of natural environments, the landscape, from NBS that could be implemented
the quality of life and the economic dy in the Brague catchment. According to
namics of the valley are all co-benefits that the estimates, the mean annual avoided
have been difficult to estimate precisely damage could reach 30% with the im-
but which could be evaluated at several plementation of preventive measures
million euros per year 2. The runoff from based on overflow hazard, without taking
the many vallons overlooking the lower into account runoff reduction. Generally
valley also limits the effectiveness of any speaking, in order to have a real impact
project that is limited to exclusive river on hazard and damage reduction, pre-
management. This highlights the need vention policies using NBS have to be
to pool the approaches and measures ambitious. The result of this study may >
envisaged: to reduce runoff as much as
possible and facilitate the flows of una-
voidable runoff.
The calibrated damage curves on the Oc- Required hazard reduction to maintain future damage at BAU level
tober 2015-flood event have been inte-
Damage model calibrated on the 2015 floods on the Brague DEMO.
grated in the damage model to estimate
400 years of climatic hourly rainfall from ARPEGE
watershed based on the stochastic simulation of
Simulation error : -2% (simulated vs real losses).
the cost of flooding at current and future
Annual average insured losses in the Brague
climat at current and 2050 conditions (€M).
climate. The curves have been validated 63
by comparing the real costs of the Oc- 61
tober 2015 losses with the estimate cost 59
Futur climate
Current climate
for the intensity levels modelled for this 57
event (less than 2%). At current climate, 55
the mean annual damages are estimated
53
at €M 48,7 for residential homeowners
51
only. The estimates tend to €M 61 at ho-
49
rizon 2050 for the IPCC RCP 8.5 scenario,
either an increase of 25% without taking 47
into account the increase of vulnerability. 45
0% 10% 20% 30% 40% 50%
The model indicate a potentially increase
of the frequency of extreme events and
% Hazard reduction rate applied to the runoff flow (m3/s) at the insurance policy
related losses. Thus, to limit the conse- scale before damage calculation - 0 represents no hazard reduction.
quences of climate change on insured
Scientific Report 2019 CCR 21Nature-based solutions:
the European project H2020 NAIAD
> participate to orientate local stakehol- References
ders involved in loss prevention through
1. Moncoulon D., Labat D., 4. Bladé E., Cea L.,
the use of cost-benefit and multicriteria Ardon J., Leblois E., Corestein G., Escolano E.,
analysis. The losses can be reduced, but Onfroy T., Poulard C., Aji S., Puertas J., Vázquez-Cendón E.,
Rémy A., and Quantin A. Dolz J., and Coll A. 2014.
the residual risk is always there, taking into 2014. Analysis of the French Iber: herramienta de
account uncertainty related to the hazards insurance market exposure simulación numérica del flujo
to floods: a stochastic model en rios. Revista Internacional
and to the climate change. / combining river overflow and de Métodos Numéricos para
surface runoff. Natural Hazards Cálculo y Diseño en
and Earth System Science Ingenieria 30:1–10.
14:2469–2485.
5. Arnaud et al. 2014.
2. Gnonlonfin A., Piton G., Hydro-meteorological risk
Marchal R., Munir M.B., estimation based on a
Wang Z.X., Moncoulon D., flood generation model:
Mas, A., Arnaud, P., SHYREG approach: The
Tacnet J-M. & Douai, A. 2019. method, its performances
DELIVERABLE 6.3 DEMO and the associated database
Insurance Value Assessment [Estimation de l’aléa
- Part 7: France: Brague, hydrométéorologique par
NAIAD H2020 project (Grant une méthode par simulation:
Agreement nº 730497), la méthode SHYREG *:
267-428. présentation - performances
- bases de données]. Houille
3. Moncoulon D., Blanche:20–26.
Desarthe J., Naulin J-P.,
Onfroy T., Tinard P., Wang 6. CGDD. 2018. Analyse
Z-X., Hajji C., Veysseire M., multicritère des projets de
Dequé M., and Régimbeau prévention des inondations -
F. 2018. “Conséquences du Guide méthodologique 2018.
changement climatique sur Commissariat général au
le coût des catastrophes développement durable.
naturelles en France à l’horizon
2050.” Paris : Caisse Centrale 7. Lebouc L. & Payrastre O.
de Réassurance & Météo- 2017. Reconstitution et analyse
France. des débits de pointe des crues
du 3 octobre 2015 dans les
Alpes Maritimes. Convention
DGPR-Ifsttar 2016, 18p.
The NAIAD project CITATION
The NAIAD project is financed by the European Commission under Marchal et al., Nature-based
solutions: the European
the H2020 Research and Innovation program, under the subvention No 730497. project H2020 NAIAD.
It gathers 23 european partners, including 4 French partners (BRGM, INRAE, In Scientific Report CCR 2019 ;
CCR, Paris, France, 2020,
Université de Nice et CCR) and it is coordinated by the Duero Hydraulogical pp. 18-22.
Confederation (Spain). The research project is applied on nine demonstration
sites accross eleven european countries with different scales: from urban
neighbouhood in Rotterdam to the Danube catchment for example.
22You can also read