OMITTED DAMAGES: What's Missing From the Social Cost of Carbon - March 13, 2014 Peter Howard 2014
←
→
Page content transcription
If your browser does not render page correctly, please read the page content below
OMITTED DAMAGES:
What’s Missing From the Social Cost of Carbon

                                           March 13, 2014
                                            Peter Howard
                                                     © 2014

                     The Cost of Carbon Project is a joint project
                       of the Environmental Defense Fund, the
                           Institute for Policy Integrity, and the
                            Natural Resources Defense Council.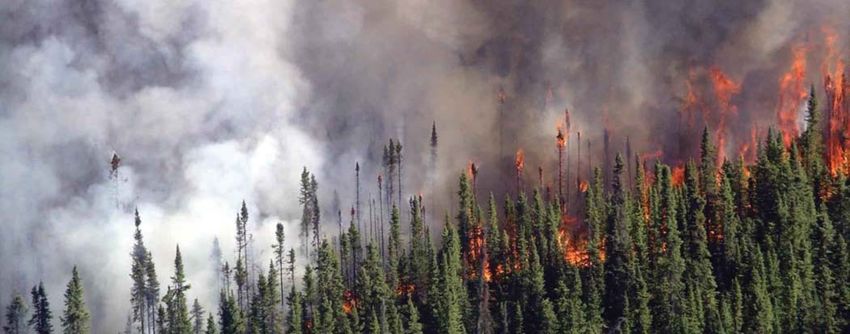
COSTOFCARBON.ORG
ABSTRACT
          he 2013 Interagency Working Group on the Social Cost of Carbon (IWG) updated the U.S. social

     T    cost of carbon (SCC) for 2015 from a central value of $24 to $37 using three integrated assessment
          models (IAMs): DICE-2010, FUND 3.8, and PAGE09. The SCC is the additional economic damage
     caused by one ton of carbon dioxide. While some have questioned the increase in the SCC as too
     high, a thorough examination of the latest scientific and economic research shows that $37 should
     be viewed as a lower bound. This is because the studies available to estimate the SCC omit many
     climate impacts—effectively valuing them at zero. Where estimates are available for a given type of
     impact, they tend to include only a portion of potential harms. This paper represents the first attempt
     to systematically examine and document these omissions for the latest versions of the three IAMs
     used by the IWG, as well as earlier versions when they are used in calibrating the updated models.

     The table on the following page summarizes hot spot damages including increases in forced
     migration, social and political conflict, and violence; weather variability and extreme weather
     events; and declining growth rates. A better accounting of catastrophic damages is also needed, as
     well as many other impacts.

     While there is a downward bias to the U.S. SCC estimates due to these omissions, the Office of
     Management and Budget (OMB) and other executive branch agencies should move forward to
     finalize proposed rules with the 2013 IWG’s current SCC estimates, as measuring at least some of
     the costs of carbon dioxide is better than assuming they are zero. At the same time, the OMB should
     more thoroughly document downward biases of the current U.S. SCC estimates, potentially using
     this report to list in detail all of the currently omitted damages.

OMITTED DAMAGES: What’s Missing From the Social Cost of Carbon                                                 1
Missing or Poorly Quantified Damages Needed to Improve SCC Models*

    General Impact    Category                                                                     Pages

                      Respiratory illness from increased ozone pollution, pollen, and wildfire
                                                                                                     30
                      smoke

                      Lyme disease                                                                   30
        Health
                      Death, injuries, and illnesses from omitted natural disasters and mass
                                                                                                     30
                      migration
                      Water, food, sanitation, and shelter                                           30

                      Weeds, pests and pathogens                                                     20

      Agriculture     Food price spikes                                                            Note 83

                      Heat and precipitation extremes                                                41
                      Acidification, temperature, and extreme weather impacts on fisheries,          18-20,
       Oceans         species extinction and migration, and coral reefs                            41-42

                      Storm surge interaction with sea level rise                                   37-38
                      Ecosystem changes such as pest infestations and pathogens, species
                                                                                                     20
                      invasion and migration, flooding and soil erosion
        Forests       Wildfire, including acreage burned, public health impacts from smoke
                      pollution, property losses, and fire management costs (including injuries     20, 30
                      and deaths)
                      Biodiversity**, habitat**, and species extinction**                            29

                      Outdoor recreation** and tourism                                               23

      Ecosystems      Ecosystem services**                                                          27-28

                      Rising value of ecosystems due to increased scarcity                          31-32

                      Accelerated decline due to mass migration                                      34

2                                                                                          COSTOFCARBON.ORG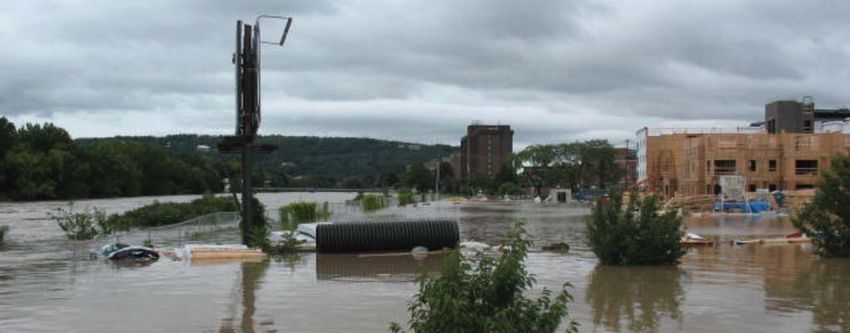
General Impact         Category                                                                                   Pages
                          Impacts on labor productivity and supply from extreme heat and weather,
                                                                                                                      24-25
                          and multiple public health impacts across different damage categories
      Productivity        Impacts on infrastructure and capital productivity and supply from
     and economic         damages from extreme weather events and infrastructure and diversion of                      25
        growth            financial resources toward climate adaptation
                          Impact on research and development from diversion of financial resources
                                                                                                                       25
                          toward climate adaptation
                          Availability and competing needs for energy production, sanitation, and
                                                                                                                     21, 41
         Water            other uses
                          Flooding                                                                                     41
    Transportation        Changes in land and ocean transportation                                                    21-22
         Energy           Energy supply disruptions                                                                    21

                          Rapid sea level rise**                                                                      8, 36
     Catastrophic         Methane releases from permafrost**                                                          8, 36
     impacts and
   tipping points**       Damages at very high temperatures***                                                      Note 23

                          Unknown catastrophic events                                                                36-37

    Inter- and intra-     National security                                                                          39, 41
        regional          Increased violent conflicts from refugee migration from extreme weather,
        conflict                                                                                                      34-35
                          and food, water and land scarcity

*This table catalogues climate impacts that have been largely unquantified in the economics literature and are therefore
largely omitted from SCC models. Quantified impacts represented in the models include: changes in energy (via cooling
and heating) demand; changes in agricultural and forestry output from changes in average temperature and precipitation
levels, and CO2 fertilization; property lost to sea level rise; coastal storms; heat-related illnesses; and some diseases (e.g.
malaria and dengue fever).

** These impacts are represented in a limited way in one or more of the SCC models: 1) they may be Included in some mod-
els, and not others; 2) they may be included only partially (e.g., only one or several impacts of many in the category are es-
timated); 3) they may be estimated using only general terms not specific to any one damage—in these instances, estimated
damages are usually very small relative to their potential magnitude, and relative to the impacts explicitly estimated in the
models. See complete report for details.

*** While technically represented in SCC models through extrapolations from small temperature changes, there are no
available climate damage estimates for large temperature changes, and these may be catastrophic.

OMITTED DAMAGES: What’s Missing From the Social Cost of Carbon                                                                3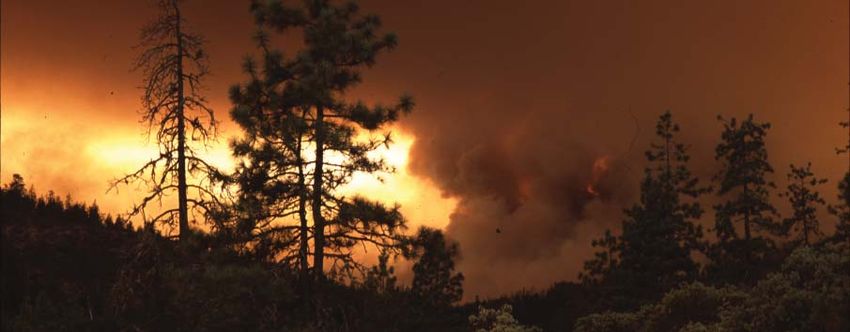
OMITTED DAMAGES:
                                              What’s Missing From the Social Cost of Carbon+
                                                                              Peter Howard*
   n 2008, the United States Court of Appeals for the Ninth Circuit ruled that executive branch agencies must

I  include the climate benefits of a significant regulatory action in federal benefit-cost analyses (BCA) to comply
   with Executive Order 12,866. In response, an Interagency Working Group on the Social Cost of Carbon was
formed in 2010 to develop a consistent and defensible estimate of the social cost of carbon (SCC) using models
drawn from the literature (Masur and Posner 2011). The SCC is the global cost to all future generations from one
additional unit of carbon pollution in a given time period; forest fires, drought, and disease are just some of the
costly consequences of climate change that are ideally included within it.1 Thus, the SCC captures the benefit of
reduced carbon pollution from a policy in terms of expenses avoided.

The SCC is estimated using Integrated Assessment Models (IAMs), which integrate a simplified climate model
and a simplified economic model into a cohesive numerical model to capture the feedback effects between the
two.2 Using a methodology specified in the 2010 Technical Support Document (IWG, 2010), the 2010 Interagency
Working Group developed a central estimate (corresponding to a constant discount rate of 3 percent) of $24 for
a 2015 emission of carbon using three Integrated Assessment Models (IAMs): DICE-2007 (Nordhaus 2008), FUND
3.5 (Anthoff and Tol 2010), and PAGE2002 (Hope 2006). Using an identical methodology and updated versions of
these three models—DICE-2010 (Nordhaus 2010), FUND 3.8 (Anthoff and Tol 2012),3 and PAGE09 (Hope 2011)—
the 2013 IWG re-estimated the central SCC estimate at $37 in 2015.4 See Tables 1-3 for a full comparison of the
2010 and 2013 SCC estimates.

With its release by the 2013 Interagency Working Group on the Social Cost of Carbon (IWG), the U.S. government’s
updated social cost of carbon estimate catapulted into the national political debate. This surge in interest is
mostly the result of the approximately 54 percent increase in the federal government’s central 2015 SCC estimate
from 2010 to 2013. Because the 2013 IWG used the same methodology to estimate the global SCC as the 2010 IWG
(IWG 2013),5 all changes in the SCC estimates are the result of updates to the three IAMs used for estimation.
Regardless, considerable debate has ensued due to the significant implication this increase has on current and
future U.S. policies.

While some conservative politicians and industry groups question the increase saying it is too high, this report
shows more generally that, if anything, these SCC estimates are biased downward, probably significantly so.
This downward bias is the result of modeling decisions by the 2010 IWG and modeling decisions by the authors
of the current IAMS, including the use of outdated damage estimates and the omission of several climate

* Peter Howard is an Economic Fellow at the Institute for Policy Integrity at the New York University School of Law. This position is jointly
funded by Environmental Defense Fund, Natural Resources Defense Council, and Policy Integrity.

+ Special thanks to Samuel Bird and John Bowman for their invaluable contributions to this work. I would also like to thank Chris Hope,
Laurie Johnson, and Gernot Wagner for their feedback. Additional thanks to the staff at the Institute for Policy Integrity, Elizabeth Gatto,
Kevin Khuong, Rachael Leven, and Claire Swingle. Finally, I would like to thank the Environmental Defense Fund, the Natural Resources
Defense Council, and Policy Integrity for their support.

4                                                                                                                    COSTOFCARBON.ORG
change impacts. This report focuses primarily on omitted damages due to the likelihood that their inclusion
would have a significant effect on the SCC.6 These omissions include climate impacts on the following market
sectors: agriculture, forestry, and fisheries (including pests, pathogens, and weeds, erosion, fires, and ocean
acidification); ecosystem services (including biodiversity and habitat loss); health impacts (including Lyme
disease and respiratory illness from increased ozone pollution, pollen, and wildfire smoke); inter-regional
damages (including migration of human and economic capital); inter-sector damages (including the combined
surge effects of stronger storms and rising sea levels), exacerbation of existing non-climate stresses (including the
combined effect of the over pumping of groundwater and climate-driven reductions in regional water supplies);
socially contingent damages (including increases in violence and other social conflict); decreasing growth rates
(including decreases in labor productivity and increases in capital depreciation); weather variability (including
increased drought and in-land flooding); and catastrophic impacts (including unknown unknowns on the scale
of the rapid melting of Arctic permafrost or ice sheets).

Despite these downward biases to federal SCC estimates, this report argues that the Office of Management and
Budget (OMB) and other executive branch agencies should move forward to finalize proposed rules with the
2013 IWG’s current SCC estimates; they are underestimates, but we should, at a minimum, count the damages
we can. At the same time, the OMB should emphasize more strongly the downward bias of the current SCC
estimates and commit to addressing this bias in future updates of the estimates.

This report focuses on identifying the important categories of harm from climate change that are omitted from
current IAMs. We first review the general categories of climate damages. Second, we describe how the latest
versions of the three IAMs (DICE-2013, FUND 3.6, and PAGE09) are calibrated.7 Third, we discuss a frequent
cause of omitting damages: a lack of sound damage estimate(s) in the literature resulting from scientific and
economic uncertainty in determining the magnitude of the effect. Fourth, using the previous two sections as
a basis, we discuss the important categories of damages that are omitted. Fifth, we discuss the treatment of
adaptation in these models, and whether omitted damages are likely to be incurred. Finally, we conclude with a
discussion of the findings and what our results imply for the future estimation of climate damages.

DAMAGES
The rising temperatures and ecological shifts brought on by global climate change are expected to affect myriad
aspects of natural ecosystems and human civilization. Though climate change may create benefits in some
regions and sectors, the long-term effects of climate change are projected to be overwhelmingly negative.
To help policymakers weigh the costs of climate mitigation and adaptation, these impacts are monetized by
economists as damages. Damages can be broadly segmented into market damages, which manifest as a loss
of gross domestic product (GDP) and non-market damages, which manifest in terms of lost welfare. Damages
also include shocks to political stability, massive ecological regime changes (such as tipping points and mass
species extinction), and impediments to sustained economic growth, none of which are easily predicted or
quantified (U.S. Climate Change Science Program, 2008; Yohe and Tirpak 2008).

Market Damages
Market damages refer to changes in welfare due to changes in income or the availability, quality, or price of a
market commodity or input. Most market damages result from shifts in productivity and a corresponding shift

OMITTED DAMAGES: What’s Missing From the Social Cost of Carbon                                                    5

in output and GDP. Market damages can also be the result of the loss or depreciation of capital such as land or
infrastructure (Goulder and Pizer 2006; Mendelsohn 2003).8

Sectors in which market damages from climate change are forecast include agriculture, due to increased
temperatures, CO2 fertilization, changing rainfall patterns, pests, and pathogens; energy demand, largely
due to the increased cost of space cooling and the decreased cost of space heating associated with global
temperature rise; energy supply, due to changing energy supply costs (such as increasing power plant cooling
costs) and extreme weather energy supply interruptions; transportation and communication, due to delays
and infrastructure losses from extreme weather events; forestry, due to shifting suitable habitat ranges, pests,
pathogens, and fires; fisheries, due to higher water temperatures, invasive species, and ocean acidification;
and water resources, due to increased evaporation rates and changing rainfall patterns. Market damages in the
form of land, property, and infrastructure loss and degradation are also expected as a result of sea level rise
and extreme weather events. While health damages have market (for example, labor availability and increased
healthcare costs) and non-market (such as suffering and the value of human life) aspects, the market damages
from health are relatively small compared the non-market damages because households place a high value on
human life (Tol 2009; Jorgenson et al., 2004).9

In some of these market sectors, climate change is projected to create a net benefit in some countries for
low-level temperature increases. For example, increased temperature will increase agricultural and forestry
productivity in some regions and increased CO2 concentrations can improve the nutritional value of soil (via
the CO2 fertilization effect). In some models, the benefits in some sectors are significant enough to result in
initial net benefits to the globe from climate change. These sector benefits and the resulting global net benefits,
however, are expected to be short-lived as temperatures continue to rise (Warren et al., 2006; Jorgenson et al.,
2004). While Tol (2009) finds evidence of net global benefits from climate change up to a 2.2 degrees Celsius
increase in temperature, this threshold differs between the three IAMs and even within variants of the same
IAM.10 Some IAMs, such as many of the more recent variants of DICE, find no such evidence of initial benefits.11

Non-market Damages
Non-market damages refer to damages affecting goods or services for which no established market exists,
but which still provide value to humans. These non-market goods and services, also referred to as non-
market commodities, can generally be thought of as environmental good and services (such as ecosystem
services). Environmental goods can be divided into use values, including direct-use values (for example, the
pharmaceutical value of biodiversity) and indirect use values (such as the values of ecosystem, recreational, and
aesthetic services), and non-use value (including existence, bequest, option, and altruistic values). Another way
to subdivide non-market damages is into tangible damages, which by definition can be valued, and intangible
damages, which by definition are extremely difficult to value given current methods. While economists have
established valuation techniques for tangible damages, the accuracy of these estimates vary by the type of good
and service. For example, use values, particularly direct-use values, are more easily quantified than non-use
values.12

Projected damages to non-market goods from climate change that are included in one or more IAM include
the loss of species and habitat, increases in rates of human mortality and morbidity, and changes in amenity
values (that is, the direct welfare change from a more or less hospitable climate) (Anthoff and Tol 2012; Warren
et al., 2006; Smith et al., 2003). All tangible damages from climate change are not included in IAMs, such as the

6                                                                                            COSTOFCARBON.ORG
medical value of biodiversity. Intangible benefits, including larger societal implications of climate change, have
yet to be meaningfully addressed or incorporated into IAMs (Yohe and Tirpak 2008).

Socially Contingent Damages
Socially contingent damages are damages that result from changes in social dynamics due to climate change.
Warmer temperatures, sea level rise, and changing water availability can affect how societies function. For
example, mass migration will become more likely as some regions become more inhospitable. Similarly,
interpersonal violence and social and political conflict will rise with increased food, water, and resource scarcity.
The values of social dynamics are, in most cases, intangible (that is, unmeasured) given current valuation
methods; it is difficult to quantify the social effect, let alone value it. As a consequence, socially contingent
damages from climate change are almost completely excluded from IAMs.

Catastrophic Impacts
One of the most concerning aspects of climate change is the potential for catastrophic damages. Catastrophic
damages are characterized as low probability-high damage events. These damages come from

    •   tipping points (also known as discontinuities)—“an environmental threshold over which small changes
        in the environmental state can causes rapid, frequently irreversible changes in ecosystem characteristics”
        (EDF, NRDC, Policy Integrity, and UCS comments, 2013);
    •   fat tails—uncertainty in the underlying economic and environmental parameters in IAMs that result in
        underlying “fat-tailed” distributions, which are distributions (often right skewed) characterized by an
        extended and fat tail on the upper end of the distribution relative to the normal (bell curve) distribution;
        and
    •   black swan events—(that is, unknown unknowns) that refer to currently unknown tipping points or
        parameter distributions.

While tipping points, fat tails, and black swan events are distinct concepts, they are overlapping issues; this is
discussed further below. Furthermore, while IAMs often categorize catastrophic damages as a distinct type of
damage from the previous three, they should actually be thought of as damages to market goods, non-market
goods and services, and society via cataclysmic climate events—often thought of in this case as rapid and/or
extreme climate change.

Catastrophic impacts are often cited as a key reason for immediate action on climate change. Using PAGE09,
Hope (2013) demonstrates that tipping point damages, the first of these three types of damages, alone can be as
important as economic damages in determining the social cost of carbon.

TIPPING POINTS. As mentioned above, an ecological tipping point is broadly defined as a threshold beyond which
a small change in conditions causes rapid, often irreversible changes in ecosystem characteristics. Tipping
points are generally more common in intricate systems with many interacting parts, such that even small
changes in the system can potentially have large impacts through a snowball effect.13 A simple but illustrative
example of an ecological tipping point is the effect of deforestation in tropical rainforests. The large trees in
the rainforest depend upon nutrient-rich topsoil to thrive. That topsoil is held in place by the root network
of the plants it supports and can take centuries to accumulate. The removal of trees accelerates the rate of

OMITTED DAMAGES: What’s Missing From the Social Cost of Carbon                                                    7
Crowning fire in spruce forest. Photo: Murphy Karen, U.S. Fish and Wildlife Service
topsoil erosion while topsoil erosion impedes tree survival rates. Deforestation, then, creates a chicken-and-egg
conundrum as reforestation efforts are doomed by a lack of topsoil and topsoil cannot be sustained without an
established root network (Brahic 2009).
Within the context of climate change, a tipping point generally refers to a temperature or CO2 concentration
threshold beyond which (even by small perturbations) the future state of Earth’s climate system is significantly
and irreversibly altered. In other words, a tipping point is an abrupt change in the climate system between
stable climate states at the regional scale (at the subcontinental scale or higher) or global scale (Overpeck and
Cole 2006). Beyond the temperature or CO2 concentration threshold that causes this abrupt change, ecological
changes would be irreversible on human time scales even if temperature could be returned to pre-threshold
levels (Overpeck and Cole 2006; Lemoine and Traeger 2011).
A global tipping point would likely be driven by a series of region-specific or system-specific tipping points
(that is, tipping elements), which, taken collectively, would dramatically reduce the Earth’s natural capacity to
withstand climate change. Lenton et al., (2008) identifies the following tipping elements:
• Arctic sea-ice (decreased areal extent),
• Greenland ice sheet (decreased ice volume),
• West Antarctic ice sheet (decreased ice volume),
• Atlantic thermohaline circulation (decreased overturning),
• El Niño-southern oscillation (increased amplitude),
• Indian summer monsoon (decreased rainfall),
• Sahara/Sahel and West African monsoon (increased vegetation fraction),
• Amazon rainforest (decreased tree fraction), and
• boreal forest (decreased tree fraction).14
The probability and damages of tipping point scenarios are poorly understood (Weitzman 2011). Due to the
considerable uncertainty surrounding these events, some IAMs exclude them altogether. This will be discussed
later.
8 COSTOFCARBON.ORGTipping point damages can be modeled either explicitly or implicitly. If tipping point damages are modeled explicitly, the damages from the crossing of tipping points are modeled using an additional damage function (for example, Hope 2002; Hope 2009; Nordhaus and Boyer 2000; Nordhaus 2008). If tipping point damages are implicitly modeled, tipping points are modeled in IAMs through the choice of climate parameters, specifically the probability distribution functions that represent them, as in Lemoine and Traeger (2011), Weitzman (2009), and Anthoff and Tol (2013a).15 In this case, tipping point damages are implicitly captured through assumed increases in market and non-market damages resulting from higher temperature from crossing climate tipping point. Fat Tails. Fat tails refer to the upper ends (that is, the right sides) of the probability density functions of a range of climate change-related variables. Tail fatness is an indicator of how quickly the probability of an event declines relative to the severity of that event, with fatter tails corresponding to lower rates of decline.16 Martin Weitzman has argued that existing climate models fail to adequately account for the extreme risks of climate change. In Weitzman’s eyes, prevailing “structural uncertainties” (that is, unknown unknowns) abound in the economics of climate change, and existing benefit-cost analyses (BCAs) and IAMs have yet to deal adequately with these uncertainties. While IAM modelers often choose thin tailed distributions (for example, the uniform distribution) and medium-tailed distributions (for example, the normal distribution) to represent uncertain climate variables, Weitzman argues that fat-tailed distributions (for example, Student-t-distribution) are more appropriate due to these structural uncertainties in climate change (that is, unknown unknowns) and the “unlimited” potential for the scale of damages (Weitzman 2011).17 Fat tails arise due to the finite amount of information on catastrophic impacts (due to their rarity in historical record keeping) forcing analysts to specify probability distribution functions of probability distribution functions. In other words, Weitzman believes that existing IAMs and BCAs under account for the potential of extreme, irreversible impacts of climate change by assuming thin-tailed and medium-tailed distribution functions,18 which render the likelihood of extreme damages from climate change small enough to write off (Weitzman 2009; Nordhaus 2012). Weitzman (2011) identifies multiple sources of structural uncertainty in existing climate modeling literature and models; he emphasizes that these sources are not exhaustive, and more likely exist. The five structural uncertainties that he identifies are: (1) the unprecedented rate and scope of increases in atmospheric greenhouse gas (GHG) concentrations, (2) the uncertainty surrounding the response of global temperatures to this dramatic increase in GHG emissions, (3) the potential for positive feedback mechanisms to accelerate the release of GHGs such as methane, (4) uncertainty of the effects (that is, damages) of extreme climate change,19 and (5) the proper discounting of the distant future (Weitzman 2011). At each of these steps in the climate model, parameters are highly uncertain and potentially represented by fat tails. As a consequence of the “cascading” uncertainties at each step in the climate model and the potentiality of fat tails at each step, climate impacts are also likely fat tailed. As Weitzman (2011) emphasizes, this is the fat tail that truly matters to climate economics—not the fat tails of the climate sensitivity parameter and the other parameters—for the Dismal Theorem to arise. As a result of the potential for climate impacts having a fat tail, Weitzman develops a theory now dubbed the Dismal Theorem. According to Weitzman (2009), if IAMs were to model fat-tailed distributions, the expected marginal utility of consumption would “explode.” In other words, the “limiting [willingness to pay] to avoid fat-tailed disasters constitutes all of output (Weitzman, 2011).” As a consequence of this result, traditional BCA collapses as the SCC becomes infinite. While Weitzman (2009) suggests such events can have such large costs as to overwhelm the discount rate, OMITTED DAMAGES: What’s Missing From the Social Cost of Carbon 9
Nordhaus (2009) finds Weitzman’s results are exceptions to the rule. In particular, Nordhaus (2009) find that
the Dismal Theory holds, that is, the expected cost of climate change is infinite, only under limited conditions:
the tails are “very” fat or society is “very” risk adverse. In other words, “[the probability of a catastrophic event]
must not go to zero and [marginal utility of consumption] must be indefinitely large as consumption declines”
towards zero (Nordhaus 2012); Nordhaus argues that the former condition may not hold (particularly if there
is an upper bound on climate parameters), and the latter condition does not hold. Furthermore, using DICE-
2007, Nordhaus (2009) demonstrates that catastrophic outcomes are potentially avoided, even if the climate
sensitivity parameter is high and major tipping points exist, if policymakers can learn about the risks of climate
change before irreversible, catastrophic damages occur and policymaking works correctly. However, Nordhaus’
rebuff of the Dismal Theory (and its implication that BCA does not apply to climate change) should not be
construed as a rejection of fat tails—these he believes are important for inclusion in IAMs (Nordhaus 2012).

In response, Weitzman (2011) argues that the infinite number should not become a distraction, but merely
emphasize the larger willingness to pay to avoid these structural uncertainties discussed above. To produce
a finite SCC for BCA to continue, Weitzman argues for the inclusion of the value of civilization. Like the value
of a statistical life, the value of civilization captures the “rate of substitution between consumption and the
mortality risk of a catastrophic extinction of civilization or the natural world as we know these concepts
(Weitzman 2009).” Crudely calculated, the value of civilization equals the present value of global income in the
year that civilization would end divided by the probability that civilization would end in that year (Weitzman
2009; Weitzman 2011).20

The empirical work on catastrophic damages, that is, the willingness to pay to avoid structural uncertainty,
finds mixed results. On the one hand, Newbold and Daigneault (2009) find large catastrophe risk premiums. In
this case, the use of the value of civilization may be essential. On the other hand, Pindyck (2009) finds only a
modest risk premium. Similarly, Nordhaus (2009) only finds large catastrophic damages when climate policy
fails in the presence of high climate sensitivity and major tipping points. In these cases, the inclusion of a value
of civilization may be unnecessary because benefit-cost analysis does not collapse.

Note that there is some overlap between tipping point events and fat tails. If tipping point damages are modeled
explicitly, the probability of incurring tipping point damages can be modeled using a fat-tailed distribution if
the probability distribution function of the event occurring is unknown. Similarly, the corresponding magnitude
of the damages can be modeled using fat-tailed distributions if this probability distribution function (PDF)
is also uncertain. If tipping point damages are modeled implicitly, that is, climate parameters are used to
model tipping points explicitly, fat-tailed distributions can be used for the corresponding climate parameters’
probability distribution functions. However, tipping points do not require fat-tail distributions if they are known
unknowns. In other words, the use of fat tails to model the probability of tipping points or their damages is not
necessary to the extent that their probability distribution functions are known, and they can be captured by
thin- or medium-tailed distributions. Undoubtedly, some tipping points are unknown unknowns and require
the use of fat tails in that probability and damages of tipping point scenarios are poorly understood (Weitzman
2011).

BLACK SWAN EVENTS. Black swan events refer to unknown catastrophic impacts, via unknown tipping point
events or parameters within unknown probability distribution functions. Currently, black swan events still
go unaddressed by IAMs. Along with the view that omitted climate damages likely outweigh omitted climate
benefits (Mastrandrea 2009), there exists a general opinion that bad surprises are likely to outweigh good
surprises in the case of climate change (Tol 2009b; Mastrandrea 2009).21

10                                                                                               COSTOFCARBON.ORG
Just as tipping points and fat tails are related concepts, so are fat tails and black swan events. Fat tails can
be thought of as a general way to capture unknown unknowns in the SCC. However, the choice of fat-tailed
distributions, that is, the rate that the tail declines, is unknown. In other words, specifying a fat-tailed distribution
is guessing at unknown unknowns. Furthermore, in terms of real practical applications, IAMs that include fat
tails may still omit other unknown unknowns. In this sense, the inclusion of fat-tailed distributions into IAM
models may not fully capture unknown unknowns.

CALIBRATION
Through the choice of damage sectors and the choice of calibration estimates, IAM developers determine what
damages from climate change are included and excluded in the social cost of carbon.22 Using damage estimates
(measured as a percentage change in GDP) for a specified temperature increase (measured as the degree Celsius
increase in regional or global average temperate from the pre-industrial temperature) drawn from the literature,23
IAM developers calibrate damage functions in three ways: sector-region analysis, survey, or meta-analysis.

First, a sector-regional analysis is when studies are found that provide sector-specific damage estimates by
region; extrapolation from observed regional damages to missing regions is often necessary. If an aggregate
damage function is utilized, damages are summed across sectors and regions. Earlier versions of DICE (DICE-
1999 and DICE-2007) fall within this category, as does FUND.24 Second, a survey of the literature is when a
consensus work, like the IPCC studies, is utilized, or when the author uses his discretion to decide on the level
of damages. In either case, though no statistical analysis is performed, the damage estimates are based upon
a survey of particular studies. PAGE relies on this methodology combined with uncertainty analysis.25 Third, a
meta-analysis is when a damage curve is fit to various damage estimates that vary in damage magnitude and
future temperature level. The most recent version of DICE relies on this method. The latter two methods are
problematic in that they make it difficult to determine the actual source behind the damage function, and thus,
to determine what particular climate damages are included and excluded from the model.

In the following section, we discuss how each IAM is calibrated by its developer using the default version of
each of these models.26 This is done to reflect the version of the model that each modeler provides to the public
and documents most thoroughly. Furthermore, the IWG uses the default versions of these IAMs. In the case of
DICE-2013, which has not been utilized by the IWG, the default version is utilized for purposes of consistency.

Calibration of the DICE damage function
Since 2000, William Nordhaus has released four versions of the DICE model: DICE-99, DICE-2007, DICE-2010,
and DICE-2013. Of these four models, DICE-2010 is not considered a major update of the DICE model but rather
an aggregation of the RICE-2010 model, a regionalized version of DICE. Across all versions of DICE, William
Nordhaus calibrates an aggregated global damage function that is quadratic in temperature.27 The sources
used to calibrate the DICE-RICE damage functions have changed over the various versions of the model. For the
quadratic damage functions of the initial models, that is, DICE-99, DICE-2007, and DICE-2010, Nordhaus used
damage estimates by sector drawn from specific sources and studies. For the more recent version of the model,
that is, DICE-2013, Nordhaus utilizes a meta-analysis approach.

OMITTED DAMAGES: What’s Missing From the Social Cost of Carbon                                                        11
EARLY VERSIONS OF DICE. The DICE-99 damage function was calibrated against region-sector damage estimates
for a 2.5 degree and 6 degree Celsius increase in global mean surface temperature above the pre-industrial
level.28 The sectors in the DICE-1999 model are: agriculture; other vulnerable markets—forestry, fisheries,
water transportation, hotels and other lodging places, outdoor recreation, and energy; coastal—sea level rise
and storms; health—malaria, dengue fever, other tropical diseases, and pollution; non-market amenities—
the allocation of time to leisure activities; settlements and ecosystems; and catastrophic impacts. Thus, the
DICE-1999 model includes market, non-market, and catastrophic damages. See Table 4 for sources of damage
estimates and Table 5 for DICE-1999 region-sector specific damage estimates.29 See forthcoming Appendix A for
a full discussion of the calibration of DICE-1999.

Instead of DICE-1999, the 2010 Interagency Working Group utilized DICE-2007 in the estimation of the U.S. Social
Cost of Carbon, as documented in the 2010 Technical Support Document. There are no major changes from DICE-
1999 to DICE-2007. In particular, as with DICE-1999, Nordhaus uses sector-based damage estimates to calibrate
the aggregate DICE-2007 damage function. There is no change in the types of damages.30 See forthcoming
Appendix B.

The 2013 Interagency Working Group utilized DICE-2010 to estimate the U.S. Social Cost of Carbon, as documented
in the 2013 Technical Support Document. The actual calibration method is almost identical to DICE-2007. The
main difference is that for the 2010 version of the model, Nordhaus explicitly specifies the aggregate damage
function as a quadratic function of both sea-level rise and temperature, instead of only temperature (Nordhaus,
2010; Nordhaus and Sztorc, 2013). See forthcoming Appendix C.

Given the similarities between DICE-1999, DICE-2007, and DICE-2010, this paper focuses on the omitted damages
from DICE-1999. Of these three versions of DICE, DICE-1999 is chosen because it is used by Hope as one of the
calibration sources of the PAGE09 damage function.

RECENT VERSION OF DICE. Nordhaus states that DICE-2013 is the first major update of the DICE model since the
2007 version. There are three major updates from 2007 to 2013 in the DICE aggregate damage function. First,
Nordhaus updates the sources of his damage estimates used for calibration. Instead of using Nordhaus and
Boyer (2000) as the basis of this calibration, he uses the damage estimates in Table 1 of Tol (2009), as seen
in Table 7 below and Figure 2 in Nordhaus and Sztorc (2013). Second, he increases these damage estimates
by 25 percent to account for omitted non-monetized benefits, such as “several important factors (biodiversity,
ocean acidification, and political reactions), extreme events (sea-level rise, changes in ocean circulation,
and accelerated climate change), impacts that are inherently difficult to model (catastrophic events and very
long-term warming), and uncertainty (of virtually all components from economic growth to damages).” Last,
Nordhaus no longer utilizes a sector-region analysis to calibrate DICE’s aggregate damage function, but instead
switches to the meta-analysis technique; see forthcoming Appendix D.

Determining what damages are included and excluded from the DICE-2013 damage function is difficult. This
is because Nordhaus switches from a sector-region analysis to calibrate DICE’s aggregate damage function to
the meta-analysis technique, which relies on 13 studies cited in Tol (2009); see Table 7. For several reasons, this
makes determining the damages included in the DICE-2013 model nearly impossible. First, many of the studies
cited in Tol (2009) rely on a multitude of studies to produce their estimates, resulting in the need to go through a
large number of papers in detail to decipher what damages are included and excluded from DICE. Second, when
these studies do not rely on a multitude of cited papers, they utilize author discretion or statistical techniques
to determine damage estimates. Both of these methods make it difficult to determine which sectors are included

12                                                                                              COSTOFCARBON.ORG
in the damage estimates, and the latter estimates, which include cross-national regressions, can often suffer
from statistical inference problems. Last, it is difficult to determine what damages are included in the damage
function because the 13 studies differ in what damages they include and exclude in their analyses. Specifically,
what does it mean to have one of 13 studies include catastrophic damages or three out of 13 studies explicitly
model the effect of climate change on vector-borne diseases? It seems reasonable to argue that the inclusion of
these damages by a minority of studies implies their general exclusion from the DICE-2013 damage function.
However, two studies exclude non-market damages and another two studies exclude market damages. Are non-
market damages and market damages completely accounted for in DICE-2013? The answer to this question is
debatable.

The DICE-2013 damage function was not used by either the 2010 or 2013 Interagency Working Group because the
model was not yet peer-reviewed. It is our view that the IWG should be wary of using DICE-2013 in the future,
given the inherent difficulty in understanding its foundations. Furthermore, if a meta-analysis is used, it should
be conducted at either the sector or region-sector levels where more data are available. This is discussed further
in the conclusion.

Calibration of the FUND 3.6 damage functions
FUND 3.6 is the only model of the three to model damages as functions of physical processes. Specifically,
in FUND, Tol calibrates sector-specific damages functions to a 1 degree Celsius increase in temperature, and
assumes dynamic equations to extrapolate damage estimates to higher temperature levels and different future
states (rate of climate change, CO2 levels, and socio-economic scenarios). These equations depend on various
assumptions about physical and economic processes, and also rely on additional parameter calibration. Unlike
DICE and PAGE, some sector damages, that is, agriculture and ecosystem services, are functions of the rate of
temperature change, in addition to the level of temperature change, sea-level rise, and amount of CO2 in the
atmosphere.

FUND includes market and non-market damages, but fails to explicitly model catastrophic damages. The
model’s damage sectors include: agriculture, energy consumption, forestry, (fresh) water resources, sea level
rise, human health, ecosystem degradation, and extreme weather (Anthoff and Tol, 2012). While FUND does not
explicitly model catastrophic damages, FUND captures catastrophic damages via uncertain parameters.31 Of
the three IAMs utilized by the IWG, FUND 3.6 is the only one to model a socially contingent response to climate
change: migration from sea level rise.

For FUND 3.6, Anthoff and Tol (2012) calibrate multiple damage functions per sector. Tol and Anthoff (2013)
calibrate three agricultural damage functions using agricultural damage estimates derived using a general
equilibrium approach; the three damage functions model the effect of rate of climate change (the cost of
farmer mal-adaptation), level of climate change (effect of temperature level on crop production), and carbon
dioxide fertilization on agricultural production (potential increases in agricultural production due to a rise in
the atmospheric concentration of CO2), respectively. In energy, Anthoff and Tol include the cost to the energy
sector due to increased demand for space cooling and decreased demand for space heating from a rise in
temperature. In forestry, Anthoff and Tol (2012) include the cost of climate change impacts on industrial wood
manufactured products from changes in mean temperature and atmospheric concentrations of carbon dioxide
relative to pre-industrial levels. In water resources, Anthoff and Tol (2012) include the effect of climate change
on fresh water resource. For sea level rise, Tol accounts for losses of dry land and wetland, the coastal protection

OMITTED DAMAGES: What’s Missing From the Social Cost of Carbon                                                   13
and migration costs. In health, Tol accounts for the mortality and morbidity costs of diarrhea, vector-borne
diseases (malaria, schistosomiasis, and dengue fever), and heat and cold related illnesses (cardiovascular and
respiratory disorders) due to a rise in temperature. With respect to ecosystems, Anthoff and Tol (2012) estimate
a value for species loss. Finally, with respect to storms, Tol estimates the economic costs of the destruction and
the value of life lost from tropical storms (hurricanes, typhoons) and extratropical storms (cyclones).

Due to the extensive use of data sources necessary to calibrate the physical processes, this section does not
contain an extensive discussion of data; see forthcoming Appendix E.

Calibration in the PAGE-2009 damage functions                          32

PAGE09 models damage functions for four generalized impact sectors: market, sea-level rise, non-market, and
non-linear (or tipping point) damages. Hope (2011a; 2011b; 2013) specifies a triangular distribution for each of
the parameters in the damage function.

The non-catastrophic damage functions in PAGE09 (market, non-market, and sea-level rise) are calibrated using
various versions of DICE and FUND. Thus, PAGE09 omits similar damages as do these two models. In PAGE09,
Hope calibrates the distribution of economic (that is, market), non-economic (that is, non-market), and sea-
level rise damages as a percentage of GDP for a 3 degree temperature increase (corresponding to a 0.5 meter
sea-level rise) using a range of damage estimates from Warren et al (2006) and the IPCC 4th Assessment Report
(IPCC, 2007). Warren et al (2006) discusses DICE-1999, FUND2.9, PAGE02, and MERGE; PAGE2002 is calibrated
based on DICE-1999 and FUND 2.0.33 Fig 20.3a from AR4 WGII on page 822 (Figure 1 below), which is used to
inform the range (the minimum and maximum combined effect) of market and non-market damages (a range
between 0.3 percent to 1.8 percent GDP decline for a 2.5 degree Celsius increase), cites Nordhaus and Boyer
(2000) – DICE-1999, Tol (2002b) – FUND 2.0, and Mendelsohn et al (2000); this figure is identical to Figure 19.4
in IPCC (2001a, Chapter 19) upon which the PAGE2002 damage estimates were partially based. In other words,
the market, non-market, and sea-level damage functions in the PAGE09 model are “highly” dependent on DICE
and FUND, though Hope uses his discretion to specify a range of estimates to allow for the possibility that these
models have underestimated impacts.

Flooding in downtown Binghamton, New York due to the remnants of Tropical Storm Lee. Photo: National Weather Service, Binghamton

14                                                                                                                    COSTOFCARBON.ORG
Hope (2011) also reduces the magnitude of these damages by including initial climate benefits, which can
result in some regions experiencing positive net benefits from climate change at low temperature increases,
and by placing a limit on climate damages so that they can be no greater than 100 percent of GDP at high
temperature increases. In addition to damages, Hope (2011b) includes an additional terms in each of the three
non-catastrophic impact sectors based on the findings of Tol (2002) to capture initial climate benefits for lower
temperature increases; these initial benefits are set equal to zero for sea-level rise in the default version of the
PAGE09 model.34 These expressions are defined such that these benefits dissipate as temperature increase
until they become zero (that is, do not yield any actual benefits) at some temperature threshold, and then they
become damages (in addition to the previously discussed calibrated damages) for further temperature increases.
Assuming no adaptation, the temperature thresholds for both market and non-market damages are 3 degrees
Celsius.35 Hope (2011) also limits damages to 100 percent of GDP in any given time period. Instead of maintaining
polynomial damage functions across all temperature levels, damage functions shift from polynomial functions
to logistic functions at certain damage levels to constrain damage to 100 percent of GDP. Following Weitzman
(2009), the saturation point (that is, the point where damages as a percentage of consumption starts to become
limited) is characterized by a triangular distribution with range 20 percent to 50 percent, a mean of 33.33 percent,
and a mode of 30 percent (Hope, 2011a; 2011b). Given the modeling assumption of PAGE09, the initial benefit
terms do not yield any actual benefits (that is, are equal to zero) and the damage functions are still polynomial
functions for a 3 degree Celsius increase and a 0.5 meter sea-level rise. In other words, non-catastrophic damages
equal their calibration value of 2.03 percent of GDP at the calibration temperatures increase of 3 degrees Celsius
when there is no adaptation (Hope 2011).

In PAGE09, Hope explicitly models climate tipping points as a singular, discrete event that has a probability
of occurring in each time period. This probability increases in temperature. If this event occurs, a decline of 5
percent to 25 percent of GDP occurs; See Table 9 below.36

PAGE09 calculates climate damages for the European Union, and then scales these damages to other regions.
PAGE09 uses the relative length of coastline to inform the corresponding ranges of scaling factors; Anthoff et
al., (2006) is the data source for the weighting factors. While these scaling factors do no differentiate between
developed and developing countries, Hope includes equity weights in PAGE09 that account for differences in
GDP per capita between European Union and other regions (Hope 2011b). Finally, Hope specifies regional damage
functions in PAGE09, which are functions of regional temperature, not global mean surface temperature. Thus,
PAGE09 captures some regional differences in climate damages using several mechanisms. See forthcoming
Appendix F for further discussion.

Damages generally included in IAMs
From this discussion about how the three latest IAMs are calibrated, we can make some general statements
about what types of damages are accounted for by IAMs. Currently, they cover a number of direct effects of
climate change, that is, a rise in global average surface temperature, on economic (that is, market) activity,
and to a lesser extent the direct effects of climate change on the environment and human settlements. The
three Integrated Assessment Models (IAMs) capture the direct effects of higher temperature levels and higher
CO2 levels (via soil fertility) on agriculture and forestry yields (but excluding climate change effects on pests,
pathogens, and fires), and the effects of trade through general equilibrium effects. The models only capture
the effects of higher temperature on fisheries to a very limited extent, and exclude the effects of habitat loss
(particularly mangroves and coral reefs), ocean acidification, and invasive species all together. The models

OMITTED DAMAGES: What’s Missing From the Social Cost of Carbon                                                   15
also capture some effects of climate change on energy demand and fresh water resources, though these are still
limited in important ways (see discussions on fisheries, energy supply, ecosystem services, and destabilizers
of existing non-climate stressors below). While IAMs capture the effects of heat and cold related illnesses
(cardiovascular and respiratory disorders) to different extents, all three capture some effects of climate on
vector-borne diseases, including malaria and dengue fever. For example, the direct cost of vector-borne diseases
on human life is included, but not the effects of such diseases on labor supply or productivity (as discussed
below). To different extents, all three models capture the effects of increased storm strength on coastal property
values and sea level rise on preventative expenditures, lost property, and lost ecosystems. To the extent possible
with current models, all IAMs consider some effect of climate change on ecosystems and biodiversity—though
improved estimates are needed with respect to both of these damage estimates. Finally, there are a variety
of damages that are captured by only one or two of the IAMs, but not all three: effects of climate change on
morbidity; mortality from storms, pollution, and diarrhea; recreational activities; climate amenities (that is, the
willingness to pay to live in a location with more sunny days); and catastrophic damages.
As is discussed more thoroughly in the conclusion of this report, many of the smaller climate damages are not
considered by the authors of IAMs because they are considered cancelled out by omitted climate benefits. The
views of Tol (2009) and Yohe and Tirpak (2007) are that a better job has to be done with respect to including only
major damage categories: catastrophic damages, socially contingent damages, and weather variability. See the
conclusion of this paper for more of a discussion.

CAUSES OF THE OMISSION OF DAMAGES
In general, the more difficult a climate impact is to estimate in the natural sciences (which measure the physical
impact) and/or value in economics, the more likely that climate impact is to be excluded from IAMs (Yohe
and Tirpak, 2008); see Figure 2. With respect to the natural sciences, damages corresponding to more certain
(that is, known) climate trends (for example, average temperature increases and sea level rise) are included
in IAMs; bounded trends, that is, climate change for which a range and/or distribution is specified, such as
extreme weather events and weather variability (for example, droughts, floods, storms, and so on), are less
likely to be included; and abrupt changes, in general, are the least likely to be included because they are the
effects characterized by the greatest uncertainty. With respect to economics, damages that are easier to value
are more likely to be included, such that many more market damages are included than non-market damages.
Environmental goods and services are more likely to be omitted from IAMs by analysts than market damages
because the former does not have observable market prices and instead must be valued by the analysts. While
the value of some environmental goods and services can be indirectly observed in market data (for example,
housing sales) using revealed preference techniques, other environmental goods and services (for example,
biodiversity) can only be valued using stated preference techniques;37 this latter group of environmental goods
and services are more likely to be omitted. Socially contingent damages (for example, famine, political unrest,
migration, and so on), which are often the result of multiple stressors, are usually omitted because they are
difficult to quantify, predict, and value (Yohe and Tirpak, 2008). Figure 2 below, taken from Yohe and Tirpak
(2008), organizes all types of climate damages into nine categories of damages corresponding to three levels
of scientific uncertainty (that is, three rows) and three levels of economics uncertainty (that is, three columns)
discussed above.

The nine categories of climate of climate benefits and damages in Figure 2 (and discussed in the previous

16                                                                                             COSTOFCARBON.ORG
paragraph) can be further organized into three groups of damages based on their levels of representation in
IAMs:

    •   Group 1: Included damages—market damages from certain climate trends. Area I in Figure 2.
    •   Group 2: Partially included damages—bounded and tipping-point market damages and certain and
        bounded non-market damages. Areas II, III, IV, and V in Figure 2.
    •   Group 3: Excluded damages—socially-contingent damages and non-market tipping point damages.
        Areas VI, VII, VIII, and IX in Figure 2.

Group 1 damages, that is, certain market damages, are included, but can still be improved by accounting for
geographic variability. Other market damages, for all real purposes, are excluded: fisheries, energy supply,
transportation, communication, and recreation and tourism.

Group 2, which includes bounded and tipping-point market damages and certain and bounded non-market
damages, has been less successfully included into IAMs. The three IAMs have included certain and bounded
non-market damages, but in a less than comprehensive manner due to data and method limitations. In other
words, while many of these damages have been included in IAMS (for example, heat stress, loss of wetlands,
biodiversity, and loss of life), the included estimates require significant improvement.38 Similarly, while some
IAMs (earlier versions of DICE and PAGE), have explicitly accounted for catastrophic market damages, Yohe and
Tirpak (2008) argue that these estimates have been less than comprehensive, and most likely omit non-market
and socially contingent consequences of these changes.39 Furthermore, while IAMs have included market
sectors that are affected by climate variability (agriculture, fresh water resources, forestry), little has been done
to account for the damages of increased climate variability in these sectors. It is critical to account for increased
climate variability because average changes mask extreme events, such as droughts, heavy rains, heat waves,
and cold spells.

Group 3, that is, socially contingent damages and non-market tipping point damages, has only recently been
investigated (or has not been investigated at all) by impact papers. As a consequence, they are completely
omitted from IAMs (Yohe and Tirpak, 2008).

With each generation of IAM, a discussion ensues over whether climate damages are accurately captured. While
several studies have identified missing damages in earlier versions of these three IAMs (Warren et al., 2006;
Dietz et al., 2007; Yohe and Tirpak, 2008; Tol, 2009), this report is the first to thoroughly identify and discuss
the various damages omitted from the most recent versions of these three IAMs (specially the default versions):
DICE-2013, FUND 3.6 (which is identical to FUND 3.7 and FUND 3.8 in terms of damage captured), and PAGE09.
By analyzing the calibration methods and data sources of the latest version of the three IAMs, as discussed in
the previous section, this report is able to provide a comprehensive discussion of which important categories
of harm are included and excluded from these IAMs. Please see Appendices A through F for a more thorough
discussion of the calibration of each IAM, and which damages are included and excluded from the default
version of each of these models.

OMITTED DAMAGES: What’s Missing From the Social Cost of Carbon                                                    17
You can also read