Investment Horizons - Schroders
←
→
Page content transcription
If your browser does not render page correctly, please read the page content below

In focus                                         Investment Horizons
                                                              Spring 2019

Research insights at Schroders:
ȂȂ The opening of China’s A-share market
ȂȂ Fintech
ȂȂ eSports and Schumpeter
ȂȂ The 4 M’s of Asian growth
ȂȂ ESG: asking the right questions
ȂȂ Putting a price on a company’s social value
ȂȂ Securitized: Main Street versus Wall Street
Perspectives
on the global
consumer
We are pleased to offer our 10th
edition of Investment Horizons,
our North American perennial
compilation of research articles
inspired by our global client
engagements.

With so much in the news about geopolitical, economic and
late market cycle risks, we wanted to focus this edition on
the underlying drivers of these factors: the global consumer.

Our first article discusses the opening of the China A-share
market and how portfolio construction will undoubtedly
be impacted by the world’s most populous country (and
second-largest economy) where consumer trends will be
quite meaningful for investors to consider. Another article
examines the 4 M’s which define the Chinese and Asian
consumer that we see being the driving force behind the
region’s seismic economic transformation. Here, we find
that private equity can help unlock this unparalleled
growth potential.

Technology is another prolific topic among consumers.
We offer two views on tech, one from a fintech practitioner,
and, one from a credit research perspective.

You cannot talk about consumers and society in general
without touching on the importance of ESG. For this edition,
we offer insights on how we are seeking to quantify the
social and environmental impact companies have on
society, as well as devising a fundamental framework to
ask the right questions about just how important ESG is
from a sustainable investment perspective.

Finally, Main Street vs Wall Street was a common mantra
during the last campaign season. We take a different
view, and provide a perspective on how investors can
find a timely fixed income alternative within the consumer-
driven segments of the asset-backed, or Securitized
credit, markets.

As always, we hope you enjoy reading this edition, and if
there are any other topics of interest to you please contact
your Schroders representative.

Contents

4                                                          25
A new approach to investing in                             The pursuit of sustainable
emerging markets – by Gavin                                growth: are investors asking
Ralston and Kristjan Mee                                   the right questions? –
                                                           by Katherine Davidson
Although the initial weight of A-shares is small, the
decision is an important milestone. In this paper
we present an alternative approach to investing in         All too often investors tend to look at ESG analysis
emerging markets which addresses this issue.               as something that can be distilled into a simplified
                                                           score or conclusion. The ‘inconvenient truth’ is that

12
                                                           incorporating ESG factors within a portfolio is not
                                                           easily achieved through simplistic screens and passive
                                                           approaches. It requires thoughtful and thorough
                                                           analysis that focuses on a company’s genuine
                                                           commitment to ESG rather than mere policy disclosure.
Five fintech trends to watch in                            It takes asking the right questions.

2019 – by Charlotte Wood
From open banking to blockchain, technology is
transforming financial services and the way we
interact with our money in an unprecedented way.           29
                                                           Should investors demand more

14                                                         responsibility from companies?
                                                           – by Andrew Howard and
                                                           Jessica Ground
Are eSports becoming the next
investment creative disruptor? –
by David Knutson, Tom Cha and                              For most of the last few decades, large companies have
                                                           thrived, even as social and environmental challenges
Chris Tams                                                 have intensified. As a result, social pressure and
                                                           government intervention are forcing companies to
                                                           take responsibility. Identifying the true ‘cost’ these
eSports collectively are disrupting the roster of          companies have on, or contribute to, society will be
entertainment options for hundreds of millions of          crucial for investors going forward.
people worldwide. Investors would be wise to take
notice of this multi-billion dollar global industry, as
well as the indirect beneficiaries of online gaming. But

                                                           36
as with all commercial sporting industries, eSports’
success will depend on monetization opportunities.

19                                                         Main Street vs. Wall Street: why
                                                           the consumer is king in Securitized
                                                           credit – by Michelle Russell-Dowe
Miss it, miss out: The opportunity
in Asian Private Equity – by                               and Anthony Breaks
Viswanathan “Param” Parameswar
                                                           With higher volatility, distortions created by QE,
and Duncan Lamont                                          and the dislocations created by regulatory changes
                                                           post-financial crisis, we think the consumer remains
The 21st century belongs to Asia, and China and India      one of the key bright spots in the market. Specifically,
in particular. The region’s economies are undergoing       consumer-driven segments of Securitized credit
a dramatic transformation, powered by the 4-Ms:            (Main Street) that we think offer a much better risk/
millennial, middle-class, metropolitan and mobile-         return profile than traditional Corporates (Wall Street)
enabled. Nowhere else can match the region’s               given the late stage of the current cycle.
combination of scale and growth. Private equity has
the keys to unlock this opportunity.
A new approach to investing
in emerging markets
In recent times, China has been front and
center of investors’ minds. In 2018 MSCI
added China’s onshore stock market
to its suite of global equity benchmark
indices. Although the initial weight of
A-shares is small, the decision is an
important milestone. Investors will now                                Gavin Ralston                                Kristjan Mee
have to decide how to access this part of                              Head of Official Institutions                Strategist

China’s equity universe and how much                                   Figure 1: An emerging market is not necessarily an emerging
to allocate to onshore equities. In this                               economy
paper we present an alternative approach
to investing in emerging markets which                                                             Advanced economies (IMF)
addresses this issue. We believe that
a separate China A-share exposure in                                                   South Korea,
                                                                                     Taiwan, Greece,                              Estonia,

addition to an emerging markets allocation                                            Czech Republic                             Lithuania

is better equipped to capture the potential
                                                                           MSCI Emerging Markets Index                  MSCI FrontierMarkets Index
of China than a purely global emerging                                                 Americas:                                Europe & CIS:

markets strategy.                                                          Brazil, Chile, Colombia, Mexico,
                                                                                    Peru, Argentina*
                                                                                                                       Croatia, Kazakhstan, Romania,
                                                                                                                               Serbia, Slovenia
                                                                                        EMEA:                                      Africa:
                                                                           Egypt, Hungary, Poland, Qatar,                Kenya, Mauritius, Morocco,
                                                                           Russia, South Africa, Turkey, UAE             Nigeria, Tunisia, WAEMU**
Before discussing the China investment opportunity we will
make a few comments about investing in emerging markets                                 Asia:                                   Middle East:
                                                                                    China, India,                          Bahrain, Jordan, Kuwait,
more broadly. The decision to invest in emerging markets is                     Indonesia, Malaysia,                          Lebanon, Oman
usually based on the belief that faster economic growth in these                Pakistan, Philippines,                              Asia:
countries will lead to higher investment returns. The reality is not                  Thailand                              Bangladesh, Sri Lanka,
as straightforward.                                                                                                               Vietnam

First, investors should be careful not to confuse the term
emerging market with the term emerging economy. For                    * Argentina and Saudi Arabia will be promoted to the MSCI EM Index in June 2019.
example, several countries which feature in MSCI’s Emerging            ** The West African Economic and Monetary Union (WAEMU) consists of the
and even Frontier (the stage below emerging) market indices            following countries: Benin, Burkina Faso, Ivory Coast, Guinea-Bissau, Mali, Niger,
could be classified as advanced economies (Figure 1). South            Senegal and Togo.
Korea and Taiwan are obvious examples.                                 Source: IMF, MSCI and Schroders. Data as of January 2019.

The IMF ranks countries based on purely economic criteria,
such as export diversification and the degree of integration
into the global financial system. In contrast, index inclusion is      Although it is obvious that classifying markets in this way results
governed by considerations about market size, liquidity and            in an index consisting of a disparate group of countries, the
accessibility as well as economic status or prospects. Poor            degree of heterogeneity is often underestimated. To illustrate
accessibility, particularly to the onshore market, is a key reason     this, we can look at the level of income across countries. Figure
why Chinese equities have been extremely underrepresented              2 on the next page shows GDP per capita in US dollars of the
in global equity indices.                                              constituents of the MSCI Emerging Markets Index. We have also
                                                                       included the US for comparison.

4     Investment Horizons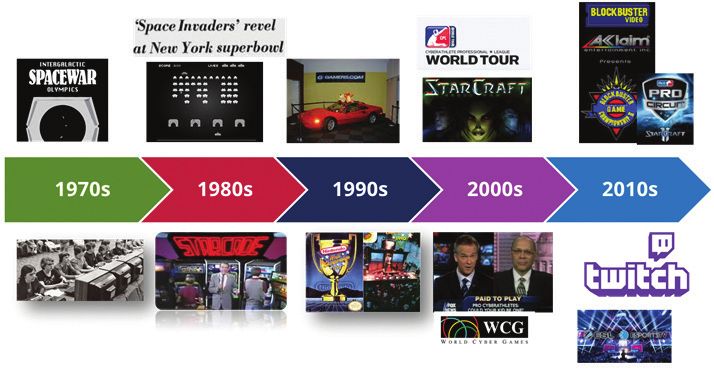
Figure 2: Some emerging market countries are much wealthier than others
GDP per capita in USD, current prices
70,000
60,000
50,000
40,000
30,000
20,000
10,000
0
an
a
a
t
do s
a
ge a
a
ru
nd
a
o
al l
a
ey
ia
nd
ry
ile
e
iA c
a
n
a
AE
SA
ar
i
yp
e
li
az
bi
di
si
ric
in
in
si
ec
bi
re
ic
a
ss
ga
at
Sa pub
Pe
in
rk
Ch
st
iw
U
U
la
la
So ne
ay
ex
m
In
nt
Ch
ra
Eg
Ko
Br
re
Af
Ru
Q
pp
Tu
ki
ai
Po
un
Ta
lo
M
G
Pa
Re
Th
h
h
ili
M
Co
H
ud
ut
Ar
ut
In
Ph
h
So
ec
Cz
Source: World Bank, Schroders. Data as of December 31, 2017
Clearly, the dispersion in income is extremely large. At the achieved convergence, moving closer to, or in the case of Japan
bottom of the pack, Pakistan has a GDP per capita of $1,548. at times exceeding, the living standard of the US. Most other
At the other end of scale, Qatar’s GDP per capita of $63,506 is countries have failed to make sustained gains, highlighted by the
higher than the US. Obviously, Pakistan and Qatar have little in relative share that has fluctuated but has not risen above 20%. As
common. This illustrates how different emerging markets are at we wrote in a recent paper1, the countries that have managed to
different stages of development and are, in reality, not all on the pull off convergence have had a few characteristics in common.
same development path. Specifically, they:
However, for a moment let’s overlook the fact that these are very ȂȂ started the process by becoming export power houses
different countries and markets. At least, with a few exceptions,
ȂȂ have had high saving rates and weak currencies
most countries in the index share one thing in common. Due to
their low GDP per capita they will benefit from catch-up growth, ȂȂ have maintained a compliant and low return banking system
as measured by the level of prosperity, or so the theory goes. that funnels funds for investment
But does this theory stand up to scrutiny? Historically, only a ȂȂ had enough coordination between government and the
few countries have managed this convergence. Figure 3 shows private sector to push exports and investment
GDP per capita relative to the US of six major emerging market
countries plus Japan, a former emerging market. ȂȂ have imposed capital controls and have not been reliant on
short-term foreign capital.
In 1960, all seven countries had a GDP per capita of less than
20% of the US. Since then, only Japan and South Korea have 1 Nicholas Field, “The convergence question”, Schroders, November 2018
Figure 3: GDP per capita relative to the US
160%
140%
120%
100%
80%
60%
40%
20%
0%
1960 1965 1970 1975 1980 1985 1990 1995 2000 2005 2010 2015
Japan Korea China India Brazil Mexico South Africa
Source: World Bank, Schroders. Data as of December 31, 2017.
Investment Horizons 5
This list of prerequisites can explain why convergence has been                         Figure 4: GDP growth and earnings growth are different
so elusive in emerging markets. Most countries have failed to                           things
meet one or more criteria. In the last 30 years, China has passed
most of these tests and has been a rare success story, going                            Flow from GDP to EPS
from 2% of the US GDP per capita in early 1990s to 15% in 2017.
Looking ahead, China’s growth rate is unlikely to match it’s 1990s                                                              GDP
record high, as its population ages. Nonetheless, continued                                                                  Data quality
strong productivity growth and a higher labor force participation
rate should keep China on the convergence path. South Korea                                                       Aggregate corporate profits
provides a good blueprint on how to continuously adjust the                                                      Share in GDP and external sector
growth model when some of the traditional sources of growth
are exhausted. For a detailed analysis of China’s potential growth                                                     Profits of listed firms
rate, see Does it matter if China gets old before it gets rich?2                                          Sectoral structure of economy vs. stock market

We should add that the general lack of convergence does not
                                                                                                                                 EPS
mean that investors should avoid emerging markets. Figure 3                                                             Share issuance/IPOs
illustrated just how growth rates fluctuate over time. An active
investment approach allows investors to move in and out of
                                                                                        MSCI Mexico: car manufacturing missing
countries tactically and potentially generate returns, even if there
is only slow progress in the long term.

The third hurdle emerging market investors face is that the
link between GDP and earnings growth is tenuous. As a result,
buoyant economic growth in some emerging markets might not
translate into equally fast earnings per share (EPS) growth. And
the latter is ultimately what matters for investors.

Figure 4 shows the linkage between GDP and EPS. There are
possible distortions at every stage of this process. At the level
of the economy itself, the reported GDP figure may suffer from
measurement issues, while the share of corporate profits in an
economy can change over time. In addition, the foreign exposure
of economies and stock markets can vary hugely and there can
be substantial differences between the industry make-up of the                               Energy              Consumer Staples
stock market and the economy. Even though Mexico is the 4th                                  Financials          Telecommunication Services
largest car exporter in the world, there are no car manufacturers
                                                                                             Materials           Utilities
listed in Mexico’s stock market.

Finally, IPOs and new share issuance can further dilute the                             Source: Schroders, MSCI. Data as of June 2017.
growth mix. As a result, the EPS growth that investors eventually
receive can have little correlation with GDP growth of the host                         Investors should consider a satellite allocation to China
country. See GDP and earnings growth in emerging markets – a                            A-shares
loose connection3 for more details.
                                                                                        The preceding section has attempted to explain why investing in
                                                                                        emerging market equities requires a hands-on, active approach,
2   Craig Botham, “Does it matter if China gets old before it gets rich?”, Schroders,   rather than a static, passive exposure. Furthermore, investors
    March 2019                                                                          need to understand how the investment universe is changing in
3   Kristjan Mee, “GDP and earnings growth in emerging markets – a loose                order to position their portfolios strategically.
    connection“ Schroders, March 2018
                                                                                        As China’s domestic A-share market is likely to take a central role
                                                                                        in the investment landscape, investors will have to decide how to
                                                                                        access this important part of the market. We believe the size of
                                                                                        the A-share market and the potential alpha opportunity available
                                                                                        makes it too important to leave the decision on the size of an
                                                                                        investor’s China equity allocation to the index providers.

                                                                                        The emergence of China is not unique in a historical context, as
                                                                                        global equity indices’ country weights have changed drastically
                                                                                        over time. That is why an approach that is heavily influenced
                                                                                        by index construction carries the risk of allocating too much to
                                                                                        countries with declining importance, and by implication too little
                                                                                        to countries with increasing in importance.

6      Investment Horizons
Figure 5: Large index constituents have not all                               Figure 6: China’s share in the global economy and
been winners                                                                  stock market

MSCI ACWI in 1987                                                             20%

                                                                              15%

                                                                              10%

                                                                               5%

                                                                               0%
                                                                                2002      2004    2006     2008     2010     2012     2014     2016     2018
                                                                                                 % of world GDP        % weight in MSCI ACWI

                                                                              Source: World Bank, Schroders. GDP data as of December 31, 2017. Index data as of
     Japan               Europe                Australia                      December 31, 2018
     USA                 Canada                Other DM
                                                                              However, there is a good reason to believe that this discrepancy,
     EM
                                                                              if unlikely to disappear, will at least diminish in the coming
                                                                              years. The boxed section, overleaf, explains how China A-shares,
MSCI ACWI in 2018                                                             the largest part of China equity universe, are now entering
                                                                              benchmark indices and investment portfolios. Consequently,
                                                                              China’s weight in benchmark indices will likely increase
                                                                              significantly, matching more closely its economic size. Note that
                                                                              the rise of China differs from the fall of Japan in the sense that in
                                                                              Japan, valuation multiple contraction rather than changing index
                                                                              inclusion factor, played the central role in moving the weight.

                                                                              Importantly, the inclusion of A-shares will be a drawn-out
                                                                              process. They currently make up only 0.8% of the MSCI Emerging
                                                                              Markets Index. It is clear that the weight of A-shares will increase
                                                                              over time. MSCI has announced that the weight will quadruple
                                                                              over the course of 2019. Nonetheless, there is no clarity on
                                                                              when or if they will be fully included. We believe that rather
                                                                              than waiting for index providers to raise the weighting,
     USA                 China                 Switzerland                    investors should consider a satellite A-share allocation in
     Japan               France                Germany                        addition to a global emerging markets mandate. Such an
     UK                  Canada                Other                          allocation would allow investors to access a much larger
                                                                              portion of the A-share market, as measured by the number
Source: MSCI. MSCI ACWI 1987 percentage weightings as of December 31, 1987.   of stocks and their market capitalization. The broader
MSCI ACWI 2019 percentage weightings as of December 31, 2018.                 opportunity set is necessary to reap the benefits of the
                                                                              compelling characteristics of the A-share market.
Many investors will remember that in 1987 Japan was 39% of the
MSCI All Country World Index (ACWI) (Figure 5, top chart). Japan’s
share peaked at 44% in 1988 and after a steady decline over 30
years, it currently stands at only 7.5% (Figure 5, bottom pie chart).

The US is by far the largest constituent of the MSCI ACWI Index
with 54% share. This is more than double the US economy’s
share of world GDP (24%), reflecting the strength and profitability
of the listed corporate sector in the USA. At the same time,
China’s share in the MSCI ACWI Index is 3.7% (just over double
the weight of Apple). As China accounts for 15% of world GDP,
it is underrepresented in the index relative to its size (Figure 6).
Since 2008, the gap has increased, as the part of the stock market
included in the ACWI has not kept up with the rapidly expanding
economy. The IMF predicts that China’s share of world GDP will
further rise to 18% by 2023.

                                                                                                                                    Investment Horizons           7
The shift to onshore investing                                                Opportunity in the A-share market
    Most institutional investors currently invest in Chinese                      The characteristics of the A-share market differentiate it from
    equities through a broad emerging markets benchmark, such                     most global peers. Historically, despite its relatively large size,
    as the MSCI Emerging Markets Index. Even though China has                     the stock market has not played a big role in China’s economy.
    a 31% weight in the index, the exposure that index investors                  For example, equity issuance has accounted for less than 5% of
    actually get is limited. The MSCI China Index, the sub-index                  total corporate fundraising5. Importantly, the market has been
    of the MSCI Emerging Markets Index, is often referred                         dominated by retail investors, who in 2018 accounted for 86%
    as the offshore index. It consists of H-shares (mainland                      of the total trading volume. This has made the A-share market
    Chinese stocks listed in Hong Kong), Red Chips (state-owned                   volatile and susceptible to wild swings in sentiment.
    enterprises incorporated outside of mainland and listed in
                                                                                  This issue was most acute in 2014/15. Figure 7 shows how, in
    Hong Kong), P-chips (private enterprises incorporated outside
                                                                                  late 2014, the CSI 300 Index (the dark blue line) started to rise
    of mainland and listed in Hong Kong) and ADRs (Chinese
                                                                                  fast after staying range-bound for years. Hoping to jump on the
    stocks listed in the US).
                                                                                  bandwagon, retail investors began opening new stock trading
    The MSCI China Index, with its 459 constituents and $1.6                      accounts. As stock prices exploded higher, more and more
    trillion market capitalization is only about 16% of the                       people wanted to participate. At one point in 2015, more than
    $10 trillion China equity universe. Before 2018, the index                    4 million new accounts were opened every week (Figure 7, the
    completely excluded A-shares, mainland stocks listed in                       light blue line). Consequently, stock prices became detached
    Shanghai or Shenzhen, the part of the market known as                         from fundamentals, driven by speculation. Inevitably, the
    onshore. The total market capitalization of A-shares is almost                bubble burst in June 2015 and the index fell close to 50%
    $7 trillion, making it the third largest stock market in the                  over the following months.
    world after the New York Stock Exchange and the Nasdaq.
                                                                                  Figure 7: Retail buying of A-shares exaggerates volatility
    For years, foreign investors had limited access to the A-share
                                                                                  6,000                                                                         5,000
    market due to restrictions on capital flows. This has prevented
    A-shares from becoming a part of institutional investors’                     5,500                                                                         4,500
    portfolios. A major change happened in 2014 with the                          5,000                                                                         4,000
    introduction of the Shanghai-Hong Kong stock connect,                         4,500                                                                         3,500
    which allows qualified foreign investors to trade eligible                    4,000                                                                         3,000
    A-shares without the need for a local Chinese license. The                    3,500                                                                         2,500
    Shenzhen-Hong Kong stock connect followed suit in 2016.                       3,000                                                                         2,000
    For the first time, investors could access the onshore market                                                                                               1,500
                                                                                  2,500
    without major restrictions.
                                                                                  2,000                                                                         1,000
    Index providers have taken notice of this liberalization. In                  1,500                                                                         500
    2018, MSCI announced that it would add China A-shares to                      1,000                                                                         0
    its suite of global benchmark indices. Inclusion is taking                       01/2011      01/2012       01/2013      01/2014       01/2015      01/2016
    place on a phased basis: as of February 2019, 5% of the                                    CSI 300 Index       New A-share trading accounts (’000s) (rhs)
    full market capitalization of eligible large-cap A-shares is
    included in the indices.                                                      Source: Schroders, Thomson Reuters Datastream. Data from January 2011 to
                                                                                  February 2016.
    The 5% inclusion factor will increase to 20% over the course
    of 2019. MSCI is also considering including A-shares of
                                                                                  Past performance is not a guide to future performance
    mid-cap companies under the same terms as large-cap
                                                                                  and may not be repeated.
    A-shares, as well as stocks listed on the technology-focused
    ChiNext market.                                                               Although retail investors will remain an important influence on
                                                                                  the market, institutional participation in the A-share market is
    After full A-share inclusion, if it ever happens, the weight of
                                                                                  likely to rise. Research shows that non-professional investors are
    China in the MSCI ACWI Index would be around 7%, matching
                                                                                  highly affected by past performance in their purchase decisions
    the size of Japan. Please see Weightlifting China – how big will it
                                                                                  and exhibit emotional bias by selling winning investments
    get?4 for more details.
                                                                                  and holding on to losing investments6. This behavior should
                                                                                  provide institutional investors who operate rigorous investment
    4   Duncan Lamont, “Weightlifting China - how big will it get?”, Schroders,   processes significant opportunities to add value in A-shares.
        February 2019

                                                                                  5   Arthur R. Kroeber, “Making sense of China’s stock market”, The Brookings
                                                                                      Institute, July 2015
                                                                                  6   Brad M. Barber and Terrance Odean, “The Behaviour of Individual Investors”,
                                                                                      September 2017

8       Investment Horizons
We have recently observed that some key fundamental factors, Besides the high share of retail investors, another hallmark
such as return on equity (ROE) and dividend yield, as well as of the A-share market has been low corporate governance
valuation multiples, are becoming more important drivers of standards. This has contributed to market volatility and posed
returns. Figure 8 shows the total return of the MSCI China A heightened corporate governance risk for investors. Low
Index, broken down into quintiles based on ROE (upper chart) governance standards can be broadly explained by the fact
and P/E ratios (lower chart) of individual stocks. Before 2015, that conventional checks and balances have been weaker than
there was little differentiation in the performance, highlighted in other global markets.
by the clustering of returns. This means that investors were not
rewarded for buying cheap stocks or stocks with high ROE. The presence of independent directors on the boards of A-share
companies is limited compared to other countries (Figure 9).
In the last three years, there has been a visible shift – return Moreover, independent directors usually get paid relatively little.
dispersion has increased significantly. The stocks with a high So there is less oversight of executive management by company
ROE have outperformed the stocks with a low ROE. In the same boards. Externally, companies can get away with questionable
vein, cheap stocks have outperformed expensive ones. The accounting practices. Auditing standards in China are still poor
efforts of fundamental investors are now being rewarded by compared to the rest of the world, highlighted by generally low
the market, as valuations and corporate profitability are gaining auditing fees. Finally, as state owned enterprises (SOEs) account
a greater influence on returns. This development is similar to for 30% of the market capitalization of the A-share market, there
what happened in South Korea and Taiwan 20 years ago as the is potential conflict between the interest of company’s minority
two markets matured. shareholders and the interests of the state.
Figure 8: A-share stock returns are now more driven Figure 9: Percentage of independent directors is still
by fundamental factors relatively low compared to other markets
MSCI China A Index % of independent directors on the board
Return on equity (ROE) (Q1 = highest ROE, Q5 = lowest ROE) 90
400 80 79% 78%
350
70
300
60 59%
250 53% 55%
50
200
40 40% 38%
150
100 30 28%
50 20
0
10
-50
01/2009 01/2011 01/2013 01/2015 01/2017 0
S
y
K
ce
a
ng
a
n
Q1 Q2 Q3 Q4 Q5
an
U
re
in
U
pa
an
Ko
Ch
Ko
m
Ja
Fr
er
g
h
on
G
ut
Price-to-earnings ratio (P/E) (Q1 = lowest P/E , Q5 = highest P/E)
H
So
Source: Schroders, Thomson Reuters Datastream. Data as at February 2019.
350
300 The good news is that the governance standards have started to
improve, driven by the institutionalization of the A-share market.
250
Institutional investors are emerging as a group powerful enough
200 to steer the practice of corporations. Furthermore, more and
more companies are now audited by recognized international
150 auditing firms.
100
The A-share market, for the reasons discussed above, has been
50 a fertile ground for active managers. Figure 10, overleaf, shows
that over the last 5 years, the median China A-share manager has
0
been able to earn an annualized excess return of 6.3% after fees.
-50 This is an exceptionally high level by global standards. Median
01/2009 01/2011 01/2013 01/2015 01/2017 excess returns have been close to zero or negative in most global
equity categories over the same timeframe.
Q1 Q2 Q3 Q4 Q5
Source: Schroders, FactSet. Data as at December 31 2018
Past performance is not a guide to future performance
and may not be repeated.
Investment Horizons 9
Figure 10: Significant alpha in the A-share market
5-year annualized excess return versus benchmark
12%

10%

 8%

 6%

 4%

 2%

 0%

 -2%
           US            Global        Global            China       US Small-      Europe ex-          UK            Japan        Asia-Pacific       India          China
        Large-Cap        Large-       Emerging          Equity         Cap          UK Large-        Flex-Cap       Flex-Cap        ex-Japan         Equity        Equity -
          Blend         Cap Blend      Markets        - Offshore                       Cap                           Equity                                        A Shares
                                                        Peer Group 25th Percentile            Peer Group Median

Source: Schroders, Morningstar. Includes open-ended EAA equity funds. Returns are shown net of fees. Data as of December 31, 2018.
Past performance is not a guide to future performance and may not be repeated.

Passive approaches, conversely, have lagged the benchmark,                               It is the largest A-shares ETF tracking the CSI 300 Index that is
as shown by the ETF performance in Figure 11. Most developed                             available for offshore investors. Over the last three and five years,
market ETFs have underperformed the indices by the amount                                it has underperformed the CSI 300 Index by -1.3% and -0.9%
implied by the management fee. In rare cases, some ETFs have                             respectively. Moreover, the underperformance is greater than
actually outperformed their benchmarks. For China A-shares, we                           what would be implied by the expense ratio (0.7%), pointing at
are showing the performance of ChinaAMC CSI 300 Index ETF.                               the high cost of passive replication of the A-share market.

Figure 11: Passive has not delivered in A-shares

    Asia ex Japan

  China A Shares

 China Offshore

             GEM

           Global

            India

            Japan

       Pan-Europe

               UK

               US

                -1.4%               -1.2%              -1.0%              -0.8%              -0.6%              -0.4%              -0.2%               0.0%               0.2%

                                                         5y Excess Return (Annualized)         3y Excess Return (Annualized)

Source: Schroders, Bloomberg, ETF providers. Passive returns taken from representative fund. Representative Passive Funds: Asia ex Japan – Lyxor MSCI AC Asia-Pacific ex Japan
ETF, China A-shares – ChinaAMC CSI 300 Index ETF, China Offshore – iShares MSCI China ETF, GEM – iShares MSCI Emerging Markets ETF, Global – iShares Core MSCI World ETF,
India – iShares MSCI India ETF, Japan – Lyxor Japan (Topix) DR ETF, Pan Europe – iShares MSCI Europe ETF, South Africa – iShares MSCI South Africa ETF, UK – SPDR FTSE UK All
Share ETF, US – Vanguard 500 Index Fund. Data as of December 31, 2018.
Past performance is not a guide to future performance and may not be repeated.

    10       Investment Horizons
A-shares in global equity portfolios
A-shares would be an important addition to global equity As the share of A-shares is gradually increasing in global
portfolios due to their high diversification benefit. Figure 12 benchmarks, the diversification benefit will decline over
shows that the MSCI China A-share Index has half the correlation time as A-shares become more integrated with the global
with global equities than the MSCI China index. investing universe.
Figure 12: Onshore China equities have a low correlation with global markets
MSCI MSCI Asia MSCI EM MSCI China
MSCI World MSCI EM MSCI ACWI MSCI China
Emerging Asia ex-Japan ex-China A-Share
MSCI World 1.00
MSCI EM 0.85 1.00
MSCI ACWI 1.00 0.88 1.00
MSCI
0.80 0.97 0.83 1.00
Emerging Asia
MSCI Asia
0.82 0.97 0.85 0.99 1.00
ex-Japan
MSCI EM
0.85 0.99 0.88 0.95 095 1.00
ex-China
MSCI China 0.70 0.83 0.73 0.84 0.85 0.77 1.00
MSCI China
0.35 0.43 0.37 0.45 0.46 0.38 0.56 1.00
A-Share
Source: Schroders, Thomson Reuters Datastream. Monthly correlations: January 2001 – January 2019. Investors cannot invest directly in any index. Actual results would differ.
Conclusion
China’s growing importance in the global economy, together with efforts to open up Chinese financial markets to foreign
capital, make the decision on the size and composition of an allocation to China equities too important to be left to index
providers. As China takes a larger share in portfolios, investors should consider a more proactive approach, especially in the
light of the unrivaled alpha opportunities in China A-shares. We believe the most efficient way to gain a desired exposure is
via a separate satellite A-share allocation on top of an existing global emerging markets mandate.
Investment Horizons 11Five fintech trends to watch in 2019
Technology is transforming financial services and the way we
interact with our money.
These are the trends we’re actively monitoring. There’s no
shortage of stories on how tech breakthroughs will transform
financial services, from changing the way we interact
with our personal finances to threatening entire banking
Charlotte Wood
institutions with disruption. Head of Innovation and
Fintech Alliances, Schroders
It can be difficult to predict exactly what this landscape will look Although awareness is considered low, and people are rightly
like in the next few years, but most seem to agree that the pace cautious about sharing their financial data, the number of people
of change, with rapid creation and adoption of tech solutions, taking advantage of it is increasing. This year we should see
will not be letting up. Part of my role involves identifying key banks and fintechs (financial technology start-ups) collaborate
innovations which are set to change the financial industry. better, and communicate the benefits more effectively, hopefully
Here are five trends I’ll be keeping an eye on in 2019: resulting in more people buying into how open banking can
help them.
1. The death of blockchain vanity projects
Blockchain is the technology sitting behind Bitcoin, the “digital
3. The ethics of artificial intelligence (AI)
currency” that is separate from any central bank. While
cryptocurrencies like Bitcoin have had a lukewarm (at best) AI is expected to infiltrate almost every aspect of modern life
response from most banks, the underlying technology has within a generation. For now development of AI has probably
generated much more interest across the industry. Blockchain been most widely visible to consumers in the form of ‘smart’
allows the transfer of digital ownership through a constantly assistants and chatbots, while in the background important
growing chain of time-stamped records called blocks, and the questions are being raised on how to ensure we don’t stray into
proclaimed impacts of this technology seem endless, being ethically dubious territory.
touted as disrupting existing banks in areas such as payments,
loans and trading. In addition to the oft-cited concern of the ‘next industrial
revolution’ on employment prospects, a key ethical issue of AI
Consensus has been gradually emerging that blockchain is an is how we ensure the right parameters are set and data is used
interesting technology that opens up new possibilities. However, so that the machine behaves in the way humans would agree
it is neither the solution to every challenge nor a replacement to is ‘right’. Just one of the areas this has implications for is financial
every existing utility, and there are hurdles to implementation, inclusion, where we need to be able to show why people get
including technical, regulatory and even behavioral barriers. turned down for products such as personal loans, mortgages
or insurance. An issue being discovered in testing is biases
This year there will be more sophisticated conversations about contained in the data so that machines in some cases are
these limitations. We’ll see fewer experimental proofs of concept essentially trained to be racist, sexist or otherwise discriminatory
(some of which could never become reality at scale and are little in this decision making.
more than vanity or PR projects), and more solid examples of
how it can help businesses and individuals like you and me. In Europe, the European Parliament Committee on
Industry, Research and Energy backed plans in January for a
comprehensive policy framework on AI and robotics, weeks
2. Open banking having an impact after a slow start in 2018 after ethical concerns in the field were highlighted in an EU
Have you heard of open banking? If not, that is not hugely report. So we’re likely to see more commentary emerging on
surprising. It’s been described in the Financial Times as “the quiet these topics, a new area for most organizations to consider.
digital revolution.”
4. Biometric advances – paying with your face
Many people will be aware of some new apps designed to access
and aggregate their financial information - this is a result of the Starting with fingerprint and facial recognition on smartphones,
open banking launch just over a year ago, a UK government- biometric innovations are now real, and for many people simply
backed initiative which means banks must share customers’ normal. Banks in particular are increasingly using voice and
information with other authorized providers on request. Banks imaging technology to verify their customers’ identities, for
will only share this data if given explicit permission, and it’s up example KFC in China and the retail giant Alibaba have both
to customers if they wish to do so, to gain new insights into tested letting people pay by smiling. Apple has even patented a
their finances or to get a better deal on financial products. The vein recognition ID scan.
objective is to make banking fairer and more transparent and
encourage new product development, but it’s taking longer
than expected to take off.
12 Investment HorizonsThere is potential for this technology to help combat fraud Crowdfunding platforms such as Crowdcube and Funding Circle
and it’s an area that is rapidly developing, however, there are also offer alternative investment opportunities, where people
still concerns that fake videos can easily be created. This can purchase equity in small companies, social movements and
has implications for banking security as well as the potential creative projects.
danger of attacks to people’s reputations and use in
disinformation campaigns. These will become ever more sophisticated and increasingly give
people access to new asset classes, based on their interests and
values as well as on their desire to invest their cash.
5. Continued lowering of the barriers to investing
As a couple of examples, Royalty Exchange offers an online
Robo advisers in one form or another, like Nutmeg, WealthFront
marketplace for investors to buy royalties from music artists
and Acorns, have been around for a while now and have opened
via auctions, while YieldStreet enables investors to build
up the route to simple investing for many people through
portfolios across multiple asset classes including real estate
technology. (For full disclosure, Schroders currently has a
and marine assets.
stake in Nutmeg).
Good for the little guy
This accelerating change is hard to keep up with but it’s not a bad time to be a consumer. These advancements (and many
more we haven’t covered) favor customers by giving them more power, better financial services security, and increasing
transparency of services.
In JP Morgan’s 2018 annual CEO Letter to Shareholders, technological advancement was a prominent theme across their
business. Acknowledging the ‘customer’ was another. This is not a coincidence. Banks are being forced to innovate in order to
give their clients better, more differentiated services. In addition, bank CEOs are being held to much stricter standards with
regard to assessing the ethical and societal implications of the operational and technological advancements being made.
Investment Horizons 13Are eSports becoming
the next investment creative disruptor?
eSports collectively are disrupting the
roster of entertainment options for
hundreds of millions of people worldwide.
Investors would be wise to take notice
of this multi-billion dollar global industry,
as well as the indirect beneficiaries of David Knutson, CFA Tom Cha Chris Tams
online gaming. But as with all commercial Head of Credit
Research, Americas
Credit Analyst,
Fixed Income
Associate
Product Manager,
sporting industries, eSports’ success will Research Fixed Income
depend on monetization opportunities.
In this paper we examine the evolution
and economics, ESG considerations
and monetization opportunities of eSports.
We also outline where we see the
potential opportunities and the threats
to existing companies and sectors.
“Sport” comes from the French word meaning leisure and it has Although it may not be well known among middle-aged
been a part of human civilization for thousands of years dating investors, 40 million people currently play Overwatch, compared
back to ancient China.1 Through the years, sports have changed to an estimated 65 million people that play baseball.2 Not only
dramatically: how they are played, regional popularity, and the are children and young adults spending an increasing amount of
intensity of the outcome. leisure time playing video games, the games themselves, as well
as how they are played, are also evolving. Through our thematic
research process we have identified investment opportunities
and threats across a variety of sectors that are exposed to this
prolific trend. This article will examine the history, economics,
ESG considerations and monetization opportunities of eSports.
With technology and interconnectedness having rapidly
improved since the days of single-player console games, video
games have evolved from individual entertainment to multi-
player experiences. This was the catalyst that led to competitive
gaming or eSports. At its heart, eSports collectively is a form
To this point, while many will recognize the depiction of the of competition that uses video games as its platform. Having
Roman gladiator in the Jean-Leon Gerome painting Pollice Verso been around in one form or another for the last 40 years, the
(below left), guess what sport the image on the right represents? phenomenon is not new. However in recent years eSports
have become more mainstream due to team and individual
achievements, social acceptance and immersive factors.
1 https://www.theworldofchinese.com/2013/08/sport-in-ancient-china/
2 https://www.nerdmuch.com/games/35460/how-many-people-play-overwatch/
and https://www.pledgesports.org/2017/06/top-10-most-popular-sports-in-the-
world-by-participation/
14 Investment HorizonsWhile on the surface, the popularity of video games appears to Popularity aside, there is significant monetary value behind this
be the driving force behind the eSports phenomenon, we have trend. eSports revenues have been growing rapidly and are
identified several other key ingredients that have brought the expected
To updateto the
topdata$1on billion in 2019.3 The largest portion of this
this chart:
- Click on the selection tool (black arrow), then select the chart, right click on the selected chart
activity to the fore in recent years: comes- Go to ‘Data’, click on the data box advertising.
from sponsorship and These
and type in the new data two sources
of revenue
NOTE: Youhavecannotgrown byinto
type data double digits
the cells, in recent
the data years.
you type will Our
appear
ȂȂ Professional status view inis the white dialogue box above the cells, not in the actual cell like it does in xls.
that
When yourevenues
type new data will
hitcontinue to over
enter or arrow grow at a similar pace as
or down
ȂȂ Multi-player experience advertisers direct
- Once all data their spending
is updated click the checkbudget to eSports
box to update the chartin order
- Once the chart is update close the data box by hiting the ‘x’ button
to reach gamers and their audiences, which have reached 400
ȂȂ Physical or virtual connectivity million globally.
BE SURE to update It isthealso worthThese
data labels. noting
do notthat the demographics
automatically update in illustrator.
ȂȂ Organized tournaments of these
BE SURE gamers
to add %are to thethe highly
‘Cash’ sought-after
data labels. young,
These do not gender-
automatically update in illustrator.
BE SURE the swatches, graphic styles and paragraph style to update fonts and lines quickly
balanced demographics that don’t watch traditional television.4
The first video game tournament was held at Stanford University WhileMAKEeSports
SURE thatcollectively
the image is don’t have
linked to theatsame
InDesign status
98% ( i.e. as other
in InDesign,
after the link is updated, you may have to make 98% and reposition)
in 1972 when students participated in an “Intergalactic Spacewar spectator sports such as golf, we believe that it has the potential
Olympics”. The prize was a humble subscription to Rolling Stone to reach that status as the negative stigma of video games
magazine. As video games grew in accessibility and popularity fades and the monetization opportunities of the targeted
through the 80s, 90s and 00s, competitive gaming spread demographics emerge.
beyond computer science devotees.
2018 eSports revenue No
Although the first spark occurred in Silicon Valley, South Korea
took multi-player gaming to the next level. The 1990s saw
Game publisher
explosive growth in the popularity of eSports in South Korea Media rights 18%
fees 13%
fueled by their government’s strategic policy to promote
technology and media. Significant infrastructure investments in Merchandise
$906M
& tickets 10%
mobile and broadband created the technological infrastructure
for eSports. Corporations also had an interest in the promotion +38.2% YoY
of eSports, and Samsung actively sought to generate interest in
it. In the early 2000s they operated a small internet café called Advertising 19%
Web2Zone in the Cooper Union area in New York City as a
Sponsorship 40%
means to import eSports to the US. Over the last decade there
have been a couple of notable attempts to bring eSports to
the masses, but early efforts were hampered by the economic eSports audience (mil)
downturn in the late 2000s. However, more recently there has
been a resurgence of interest in the US with X Games adding 600
eSports to their roster of athletic sports.
500
400
300
200
100
0
2016 2017 2018 2021
Occasional viewers eSports enthusiasts
eSports revenues ($mil)
For illustration only. Any logos shown are the property of their respective entity and
do not in any way reflect endorsement by, nor affiliation with, Schroders. 1,800
1,600
1,400
The days of local area network (or “LAN”) parties, whereby
1,200
competitors carried their computers to school gyms and
community centers to physically connect to each other, are more 1,000
or less extinct. These days, tournaments are more upscale and 800
held at venues like the Staples Center in Los Angeles and the 600
Barclays Center in New York City. In 2018, the Overwatch League 400
(the first major global eSports league with city-based games)
200
sold more than 20,000 tickets for the league’s Grand Finals at
the Barclays Center. In comparison, the average game for the -
Brooklyn Nets, a local NBA team who play at the Barclays Center, 2016 2017 2018 2021
attracted 15,376 spectators for their 2017 season, while the New Total revenues Brand investment revenues*
York Islanders, a professional NHL team, pulled in 12,002 at the
same venue. *Media rights, advertising, sponsorship
Source: Newzoo, December 2018.
3 Newzoo Global eSports Market Report
4 Entertainment Software Association – Essential Facts About the Computer and Video
Game Industry (2018)
Investment Horizons 15As part of our thematic discussion on how eSports will disrupt approvals have been halted with many believing the intention
the economics around traditional sports industries, we worked is to reduce the money and time spent on online games.7
with our Sustainable Investment team to identify longer term, While there is no clear regulatory direction, the topic seems
ESG-related5 threats and opportunities related to eSports. likely to stay on their agendas as usage spreads. Our overall
Apart from the analysis of governance, which is a standard ESG assessment of eSports centers on our belief that eSports’
research lens, we identified social concerns related to inactivity, evolving structure and competitive environment promotes
social isolation, violent content and gambling, which could social connections physically and virtually. In general, we are
prompt user or regulator responses, leading to tempered encouraged to see the video game industry’s by-and-large
growth. While there is also an environmental component proactive self-regulation regarding usage and content.
(due to the heavy cost of infrastructure, electricity and data
processing equipment), for purposes of this article we will not The portfolio construction challenge
provide a deep dive into this area.
As with all commercial sporting industries, eSports’ success will
We recognize that leisure activities run the gamut, from depend on monetization opportunities. We believe there are five
sedentary to very active, with competitive gaming being potential monetization opportunities. In the following section we
generally less physically active than traditional sports. A current will discuss the first two opportunities.
and future engagement topic is how companies can foster
responsible usage by monitoring or creating governors on
player activity.
Advertising and sponsorship revenues
Media rights revenues
Subscription revenues
Licensing/merchandising revenues and event ticket sales
Regarding social isolation concerns, we believe the current
vintage of interactive games actually offers the potential to Sports gambling
increase social interaction. As discussed above, earlier versions
of video games were often played individually against a system
compared to the multi-player gaming environments of the more At times commercial opportunities can be at odds with the
popular games today. We also note that multi-player games interests of gamers who have shown fickleness to commercial
are expanding beyond the traditional male demographic and opportunism. Because of that, there needs to be a gradual
towards co-ed participation, particularly in the competitive approach by the industry in building out the monetization
realm. This may also be explained by some of the changes made model while being careful not to alienate gamers with excessive
to historically violent content, with self-regulating industry advertisements. That is why we, as credit analysts, find this area
standards aimed at toning down offensive content in order to of research so fascinating.
attract increased participation and a wider audience.
We believe the debate around eSports6 and gambling will
become more impactful in the near future. Regulators have 7 https://www.forbes.com/sites/ywang/2018/12/10/as-chinas-regulatory-freeze-
started regulating betting on eSports and large markets appear drags-on-its-gaming-industry-searches-for-an-answer/#6ae2189a653c
to be at odds with how to manage the future. For example, last
year in the US, the Supreme Court struck down the Professional
and Amateur Sports Protection Act (PASPA), which outlawed
sports betting in most US states. While in China, the world’s
largest gaming market with $38 billion in sales, new game
5 ESG refers to environmental, social and governance factors, which may include
both financial and non-financial factors.
6 https://www.lexology.com/library/detail.aspx?g=dc292793-0d2a-402d-85bd-
5761dea3d5c2
16 Investment HorizonsAdvertising & sponsorship Advertising and sponsorship via platforms such as YouTube or
Right now, eSports annual revenue per fan remains at less than Twitch already account for a significant portion of revenues. The
$6.50, whereas with traditional sports that number is around threat to this opportunity is an economic slowdown as noted by
$40 to $80.8 The below graphs give an indication of audience the abrupt reduction of sponsorship during the 2008 financial
sizes for eSports and professional sports as well as an indication crisis. Another limiting factor is the so-called “geek culture” that
of the size of revenue that has been achieved in the world of exists within video games and eSports, which limits potential
professional sports. This demonstrates the monetization gap advertisers to companies that have products that appeal to
between the two. We believe that over time, eSports should “geeks”, although companies such as Mastercard are starting
be able to close the revenue gap especially given the favorable to get involved, which is indicative of the video game culture’s
demographics of the eSport cohort. broader acceptance.
eSports audience vs. major sports audience (millions) Professional sports league revenues ($billions)
League of Legends European Football
NFL
BCS National Championship
MLB
MLB 2016 World Series
NBA
NBA 2016 Finals
NHL
NCAA 2016 Final Four eSports
0 10 20 30 40 50 0 10 20 30 40
Source: Newzoo, Schroders
Media rights – one of the reasons that eSports took off early in Korea was
The second area that we believe will drive the monetization because of the involvement by the broadcast media. ESPN’s core
model is media rights. The first media broadcast was via ESPN strength is not just the viewership and reach but also its ability to
in 2015 showing a 5x5 game between UC Berkley and Arizona tell a story, like they have traditionally done in “real” sports.
State. The game being played was Heroes of the Storm and the
The graphs below demonstrate the growing viewership rate of
prize was a four-year, full scholarship which was awarded to UC
eSports versus traditional sports. As you can see the increasing
Berkley. Previously a critic of eSports, John Skipper, President of
trend in eSports viewership has been dramatic compared to
ESPN is now a believer in the phenomenon. We think that ESPN’s
the profile of traditional sports, which have plateaued or even
embrace of eSports represents a big move in the eSports industry
decreased in some cases.
NFL regular season viewership (mil) NBA regular season average viewership (mil)
100.0 12.0
90.0
10.0
80.0
70.0 8.0
60.0
50.0 6.0
40.0
30.0 4.0
20.0
2.0
10.0
- -
2004 2005 2006 2007 2008 2009 2010 2011 2012 2013 2014 2015 2016 2017 '07-'08 '08-'09 '09-'10 '10-'11 '11-'12 '12-'13 '13-'14 '14-'15 '15-'16 '16-'17 '17-'18
World Series average viewership (mil) eSports audience (mil)
50.0 350
45.0
300
40.0
35.0 250
30.0 200
25.0
150
20.0
15.0 100
10.0 50
5.0
0
-
2016 2017 2018 2021
1978
1980
1982
1984
1986
1988
1990
1992
1994
1996
1998
2000
2002
2004
2006
2008
2010
2012
2014
2016
Occasional viewers eSports enthusiasts
Source: SNL, Sports Business Journal, ESPN, USA Today, NCAA, JP Morgan 8 Estimated based on data compiled from SNL, Sports Business Journal, ESPN, USA
Today, NCAA, JP Morgan, Nielsen
Investment Horizons 17Assessing the winners and losers of eSports One final thought on eSports: are we witnessing the next big
eSports has the potential to fundamentally alter the roster creative destruction?
of entertainment options for millions of people. However, The economics of the eSports ecosystem is being driven by
eSports still remains a niche industry, and the amount of capital the graying of traditional sports players and fans, and the
invested remains orders of magnitudes less than the traditional emergence of the 15-35 year-old eSports core demographic. In
entertainment industry. We think there will be companies who 2018, the biggest eSports game, League of Legends, achieved
will embrace and whose businesses will thrive as a result of more than 100 million viewers for their finals match. This was
eSports, and some which will likely be disrupted given the about the same number of Americans who watched the Super
frenetic pace at which online gaming innovates and penetrates Bowl, which has traditionally had an older demographic. We
the marketplace. Not only will game manufacturers themselves think this is more than an aberration.
be subject to this disruption, second- and even third-order
industries will be impacted. The revenues from eSports-driven media rights, advertising
and sponsorship will exceed $1billion for the first time this year,
Presently there are very few pure-play ways to gain exposure to although this is still less than $6.50 per fan according to the
the emergence of eSports, other than through private market, consultancy Newzoo. Regardless, if you correctly identified the
direct investments or through one of the very few eSports- Overwatch image at the beginning, we have one last image to
focused venture capital funds that exist. Investors therefore can quiz you on9 which we think sums up the essence of the article!
also look to public debt and equity markets to assess where the
impact of eSports might reside. Because eSports are already
changing the way that advertisers can reach their audiences,
we believe that traditional media and entertainment companies
are likely to be negatively impacted over time as advertising
spending migrates from traditional platforms to eSports viewing
platforms such as Twitch or YouTube that are digital and where
marketing budget is increasingly being allocated.
9 One of the most influential economists of the 20th century, Joseph Schumpeter
popularized the term “creative destruction” in economics.
Conclusion
Companies that have interests primarily in traditional film and television are likely to lose viewership to the emerging
eSports phenomenon. Conversely, publicly-traded names that may benefit from the growth in popularity include Amazon,
which has spent the last several years investing in an eSports ecosystem acquiring games studios and broadcasters over the
years. Furthermore hardware manufacturers, computer peripherals and chipmakers such as Dell, Logitech, Nvidia, AMD and
Intel may stand to benefit from increasing demand for their products driven by the increasing number of gamers. While it is
relatively easy for investors to gain exposure to these types of companies, it is worth bearing in mind that eSports currently
comprise a relatively small percentage of these publicly-traded companies’ business mixes and investments such as these
would likely have a low performance contribution from the growth of eSports, at least in the very near-term.
Our view is that early pure-play venture capital or direct lenders are likely to reap the highest returns from eSports, but over
the coming years there will be a greater spectrum of investment opportunities for a variety of risk appetites in eSports as it
becomes more accepted by the general public, proof-of-concept has been delivered to early investors (and eSports begin to
represent a larger share of publicly-traded companies’ business models). Game on!
18 Investment HorizonsYou can also read