Water Using water markets and impact investment to drive sustainability
←
→
Page content transcription
If your browser does not render page correctly, please read the page content below
Water
Share
Using water markets and impact investment
          to drive sustainability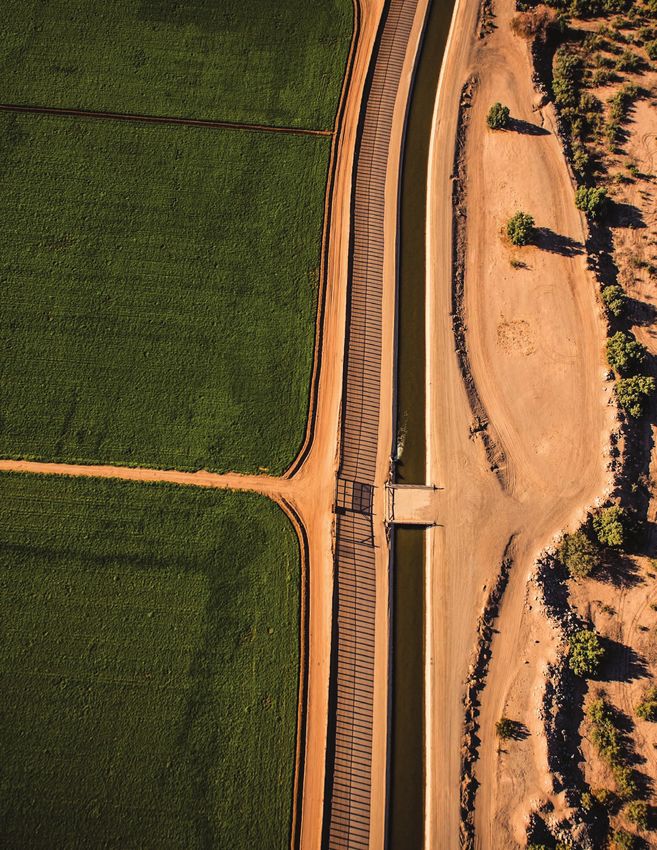
Water scarcity
                      is a major issue for nearly half of
                            the world’s population

Colorado River Delta, Mexico. © Nick Hall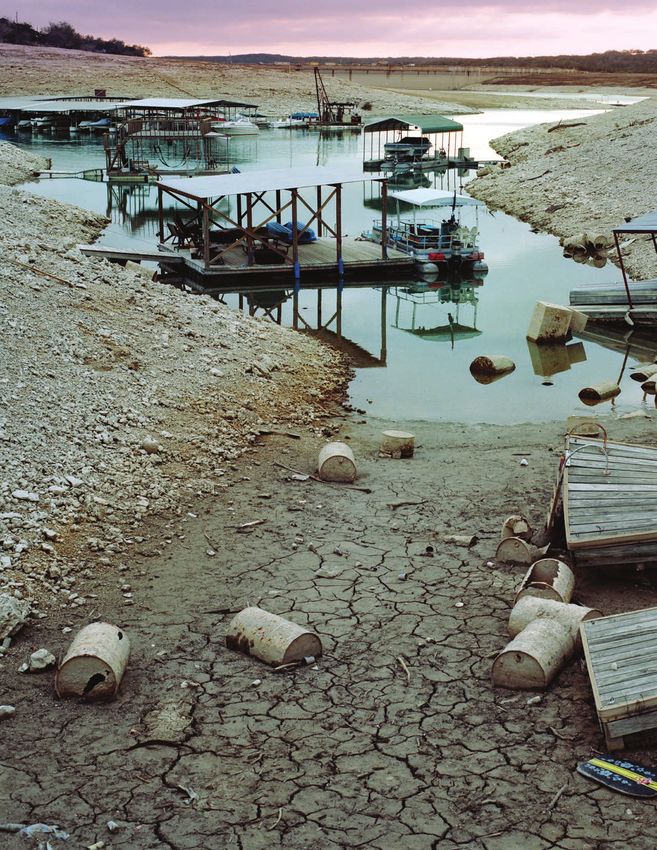
Acknowledgements
Lead author                                                    Reviewers
Brian Richter                                                  The following people served as report reviewers. Their
                                                               contributions helped strengthen the report. The content
                                                               and positions expressed in this paper, however, are those of
Primary contributors
                                                               The Nature Conservancy and do not necessarily reflect the
Giulio Boccaletti, Lauren Ferstandig, Emily Powell and         perspectives of those who provided input: Adam Conner, Lyn
Charles Wight                                                  Clancy, Peter Debaere, Amy Dickie, Taryn Goodman, Laura
                                                               Huffman, Charlotte Kaiser, Eloise Kendy, Alex Martinez,
Institutions or individuals contributing                       Stuart Orr, Chris Perry, George Wente and Michael Young
data and/or analyses
Austin Water: Jill Mayfield                                    Designer
California Environmental Associates: Amy Dickie                Paul Gormont, Apertures Inc.
CDP: Cate Lamb
                                                               Editors
Conservation International: Ian Harrison
                                                               Andrew Myers and Meghan Snow
Culp & Kelly LLP: Peter Culp
International Union for Conservation of Nature: Will Darwall   Funding support
Lower Colorado River Authority: Lyn Clancy                     This report would not have been possible without the
                                                               generous support of The Rockefeller Foundation and Lyda
San Antonio Water System: Adam Conner                          Hill Foundation.
San Diego County Water Authority: Tim Bombardier and
Stuart Williams
Texas Commission on Environmental Quality: Joe Nicosia
The Nature Conservancy: Jonathan Higgins, Dale Turner and
Emily Chapin                                                   Please cite this document as: Richter, B. 2016.
                                                               Water Share: Using water markets and impact investment to
The Rockefeller Foundation: Fred Boltz and Alex Martinez       drive sustainability. The Nature Conservancy:
University of Colorado and Colorado River Research Group:      Washington, D.C.
Douglas Kenney                                                 ©2016 The Nature Conservancy
University of Kassel: Martina Floerke and Christof Schneider   Printed on recycled paper.
University of Massachusetts Amherst: Casey Brown
University of Minnesota: Kate Brauman
University of Virginia: Peter Debaere, John Harbin, Amelia
Syvrud, Hannah Backman, Briana Bergstrom, James D.
Brown, Rachel DiBenedetto, Adrianna Gorsky, Emily
Keenan, Jason Knickmeyer, Chantal Madray, Martha Morris,
Benjamin Pickus, Devin Rowell, Susan Ryu, Laura Szczyrba
and Xiaoxia Xiang

                                                                                            Acknowledgements / Water Share / 3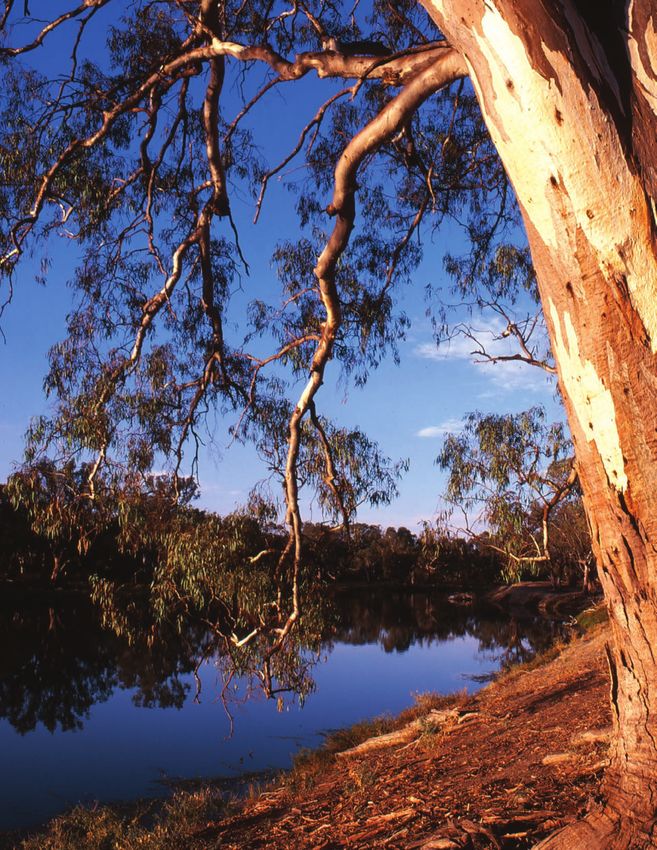
Sabie River, South Africa. © Brian Richter

                                             Table of Contents
                                             Acknowledgements                                                                                                                                                                                                   3

                                             Foreword                                                                                                                                                                                                           7

                                             Executive Summary                                                                                                                                                                                                  9

                                                  Water scarcity is a top risk to global prosperity and ecological integrity__________________________________________________________________________________________ 9
                                                  It is time for new approaches in water management__________________________________________________________________________________________________________________________ 10
                                                  The promise of water markets__________________________________________________________________________________________________________________________________________________________________ 10
                                                  Conclusions and recommendations for action_______________________________________________________________________________________________________________________________________12

                                             CHAPTER 1: Running Out of Water                                                                                                                                                                                  17

                                                  Introduction___________________________________________________________________________________________________________________________________________________________________________________________________17
                                                  Taking stock of scarcity in the world today____________________________________________________________________________________________________________________________________________ 22
                                                  Increasing the risk of water shortage______________________________________________________________________________________________________________________________________________________24
                                                  The consequences of scarcity for nature________________________________________________________________________________________________________________________________________________28

                                             CHAPTER 2: It is Time for New Approaches in Water Management                                                                                                                                                    33
                                                  Surplus water is hard to find_____________________________________________________________________________________________________________________________________________________________________ 33
                                                  The renewable water supply is declining_______________________________________________________________________________________________________________________________________________34
                                                  The costs to secure more water are too high________________________________________________________________________________________________________________________________________ 37

                                             CHAPTER 3: The Promise of Water Markets                                                                                                                                                                          41

                                                  Water markets as instruments of efficient allocation between nature and people______________________________________________________________________ 41
                                                  Reaping the benefits of water markets__________________________________________________________________________________________________________________________________________________ 44
                                                  Water market opportunities already exist in many countries___________________________________________________________________________________________________________ 44

                                                  Water markets can enable restoration of water flows for nature____________________________________________________________________________________________________ 46
                                                  Opportunities for private investment in water markets_____________________________________________________________________________________________________________________ 48
                                                  A private initiative to restore nature – Water Sharing Investment Partnerships__________________________________________________________________________ 48
                                                  The world’s first Water Sharing Investment Partnership: Murray-Darling Basin, Australia________________________________________________________ 52

                                             4 / Water Share / Table of Contents
CHAPTER 4: Conclusions and Recommendations for Action                                                                                                                                                       55

   One solution will not fit all situations, custom-tailoring will be essential_______________________________________________________________________________________ 55
           Strategy C1 – Facilitate long-term (permanent) water trades within farming communities______________________________________________56
           Strategy C2 – Facilitate long-term (permanent) trades between farmers and cities___________________________________________________________56
           Strategy E1 – Facilitate short-term (temporary) trades within farming communities__________________________________________________________ 57
           Strategy E2 – Facilitate short-term (temporary) exchanges between farmers and cities___________________________________________________ 57
   These solutions are within reach, but we must act now_____________________________________________________________________________________________________________________58
           Non-governmental (NGO) community_________________________________________________________________________________________________________________________________________59
           Irrigation farming communities_______________________________________________________________________________________________________________________________________________________59
           Political leaders__________________________________________________________________________________________________________________________________________________________________________________ 60
           Private investors, fund managers and financial consultants____________________________________________________________________________________________________ 60
           Urban water managers_______________________________________________________________________________________________________________________________________________________________________61
   The path forward__________________________________________________________________________________________________________________________________________________________________________________________61

APPENDIX I: Water Market Case Studies                                                                                                                                                                       63

   San Diego, California (United States)_____________________________________________________________________________________________________________________________________________________63
           Background__________________________________________________________________________________________________________________________________________________________________________________________63
           The role of water market transfers_________________________________________________________________________________________________________________________________________________63
           Environmental outcomes_________________________________________________________________________________________________________________________________________________________________ 64
           Economic outcomes__________________________________________________________________________________________________________________________________________________________________________ 64
           Potential role for Water Sharing Investment Partnerships_______________________________________________________________________________________________________ 64
   Austin, Texas (United States)___________________________________________________________________________________________________________________________________________________________________66
           Background__________________________________________________________________________________________________________________________________________________________________________________________66
           The role of water transfers_______________________________________________________________________________________________________________________________________________________________66
           Environmental outcomes__________________________________________________________________________________________________________________________________________________________________ 67
           Economic outcomes___________________________________________________________________________________________________________________________________________________________________________68
           Potential role for a Water Sharing Investment Partnership_______________________________________________________________________________________________________68
   San Antonio, Texas (United States)_________________________________________________________________________________________________________________________________________________________70
           Background__________________________________________________________________________________________________________________________________________________________________________________________70
           The role of water transfers_______________________________________________________________________________________________________________________________________________________________70
           Environmental outcomes___________________________________________________________________________________________________________________________________________________________________71
           Economic outcomes___________________________________________________________________________________________________________________________________________________________________________ 72
           Potential role for a Water Sharing Investment Partnership_______________________________________________________________________________________________________ 72
   Murray-Darling Basin, Australia_______________________________________________________________________________________________________________________________________________________________ 74
           Background__________________________________________________________________________________________________________________________________________________________________________________________ 74
           The role of water transfers_______________________________________________________________________________________________________________________________________________________________ 74
           Environmental outcomes__________________________________________________________________________________________________________________________________________________________________ 76
           Economic outcomes___________________________________________________________________________________________________________________________________________________________________________ 76
           Potential role for a Water Sharing Investment Partnership_______________________________________________________________________________________________________ 77

APPENDIX II: Methodology For Global Economic Projections                                                                                                                                                    78

GLOSSARY                                                                                                                                                                                                     81

ENDNOTES                                                                                                                                                                                                    83

                                                                                                                                                          Table of Contents / Water Share / 5
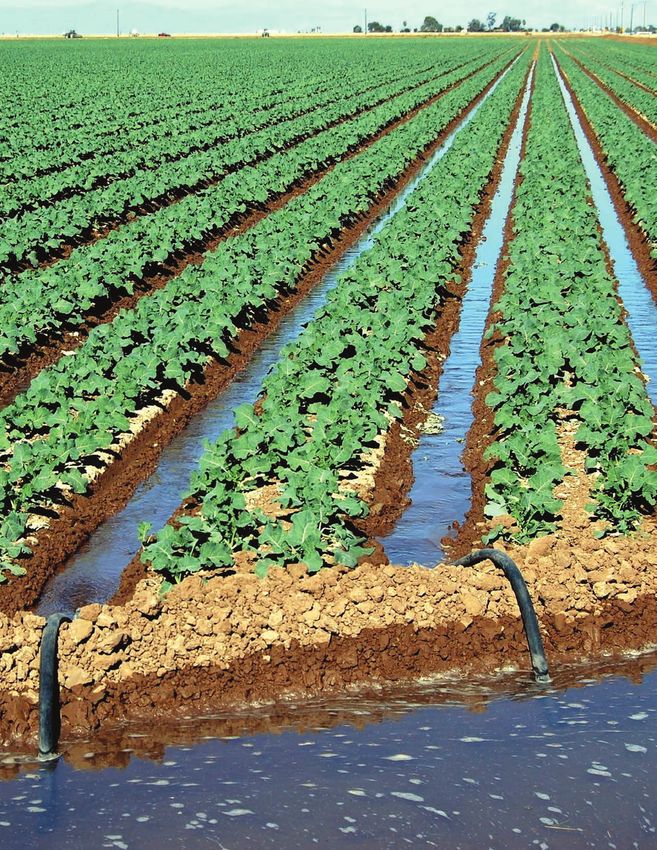
More than 50%
     of the world’s cities and 75% of all
  irrigated farms are experiencing water
       shortages on a recurring basis

Medina Lake, Texas, United States. © Blake Gordon
Foreword
This report addresses the fundamental question of how to share water when there is not enough to satisfy all needs for
people and nature. Water scarcity touches the lives of nearly half the people on this planet. Half of all large cities and
three-quarters of all irrigated farms are already experiencing recurring water shortages. Today, more than 90 percent
of water consumption in water-scarce regions goes to irrigated agriculture, and – from Pakistan to Kenya, from the
United States to China – a changing climate and increasing demands from a growing global population are testing the
limits of what scarce water supplies remain. For many communities suffering from water scarcity, the option of building
additional, often expensive, supply infrastructure is not available. And while we face the consequences of increasingly
limited resources, water diverted for cities, industry and crops often comes at the imperilment of freshwater ecosystems.

The fundamental challenge is to do more with less – to efficiently allocate water to the most productive uses. Water
markets are institutions designed to do just that. If constructed and regulated well, they can help increase the efficiency of
water allocation, and by revealing the value of water to different users, drive greater efficiency. Of course, water markets
are not a solution to all scarcity situations, but they are a powerful regulatory construct to manage limited resources.

While they offer a way of mediating scarcity for commercial and public uses of water, their inability to account for
environmental needs is often perceived as a critical flaw of these constructs. This report shows that through new
approaches to water markets, we have an opportunity to shift water back to the environment while increasing the
productivity of irrigated agriculture and meeting the needs of cities. In many regions, a well-functioning water market
can provide the institutional framework for users willing to consume less to be rewarded by those needing more or
wanting to return water to the environment.

Recognizing the potential for water markets to alleviate water scarcity around the world, including the needs of
nature, The Nature Conservancy launched a new model called Water Sharing Investment Partnerships. WSIPs rely on
investment capital to acquire a pool of water-use rights within existing markets. Those rights can be used to reallocate
water to the environment, provide ongoing water security through lease agreements to users in the community and
generate financial returns to investors.

Today, at least 37 countries in water-scarce regions have established water allocation systems based on the issuance
of water rights. These countries are potential candidates for WSIPs. The research described in this report shows that if
fully scaled, WSIPs – or other creative financing solutions to water scarcity – could mobilize USD$13.4 billion per year in
transaction value to reallocate water, corresponding to an underlying assets value of USD$331 billion. Therefore, models
such as WSIPs, when enabled by high-functioning water markets, can help provide a more water-secure future for cities,
agriculture, industries and essential ecosystems.

Doing this will not be easy. Unleashing the full potential of the water market solutions discussed in this report will require
policy and regulatory reforms, mobilization of unprecedented levels of public and private investment and inspired leadership
from both non-governmental organizations and political decision-makers. It will require transforming the way we think about
water management in the 21st century. By working together, farmers, lawmakers, investors, conservation groups and water
managers can set a path to more responsible water management that meets the needs of both people and nature.

Giulio Boccaletti, PhD
Global Managing Director, Water
The Nature Conservancy

                                                                                                     Foreword / Water Share / 7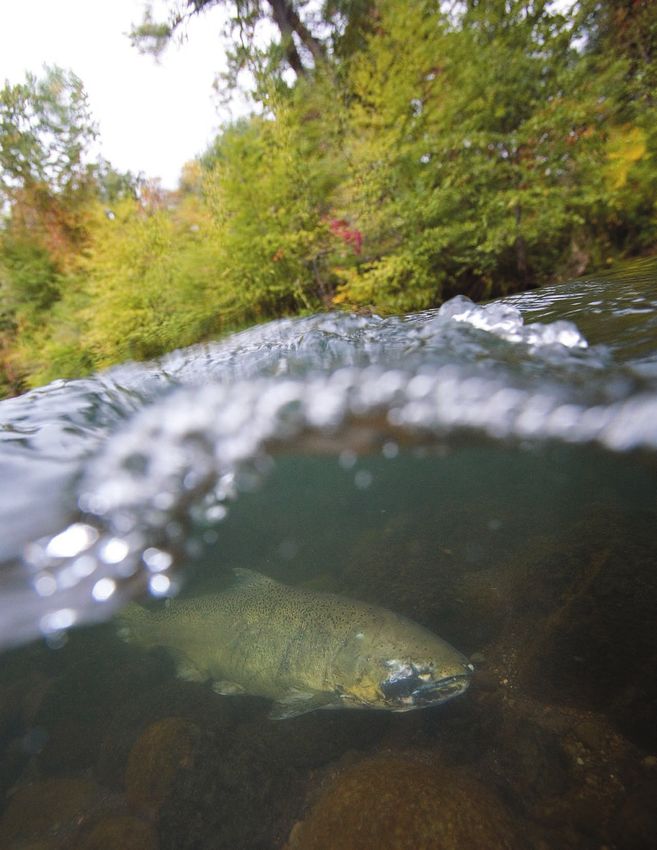
More than 30%
            of the rivers, lakes and aquifers on
           our planet are being heavily tapped
                 for their water resources

Murray River, Australia. © Mark Schapper
Executive Summary
Water scarcity is a top risk to global prosperity and ecological integrity
Water scarcity is a consequence of allowing too much water to be consumed relative to the renewable, affordable
supply of water. When human consumption of water begins to approach the limits of the available supply,
communities, businesses and ecosystems face great risk of water shortages with damaging consequences.

The problem of water scarcity is planetary in scale: today, at least one-third of the rivers, lakes and aquifers on our
planet are being heavily tapped for their water resources. More than 90 percent of water consumption in water-
scarce regions goes to irrigated agriculture. Globally, irrigation consumes 10 times more water than all other uses
combined. There are few places in the world where water scarcity can be alleviated without substantially reducing
the volume of water being consumptively used in agriculture. Given concerns over food security in many regions,
and the importance of protecting the social fabric of rural communities, this must be accomplished in ways that
sustain agricultural production and livelihoods.

Figure ES-1. Global water depletion

                                   DEPLETION LEVELS

                                     >100%       75–100%       Seasonal     Dry Year     50–75%       25–50%        5–25%         100 percent), seasonally, or
during dry years (adapted from Brauman and others, 20165).

                                                                                                                               Executive Summary / Water Share / 9
Water scarcity presents enormous challenges for the growth of cities and industries. Cities are reaching far
and wide into distant water basins to bolster their supplies and investing in other costly and energy-intensive
strategies, such as desalination, to secure additional water. Water scarcity also threatens our food supply. More
than three-quarters of all irrigated farmlands are vulnerable to water shortages, and one-fifth of all irrigated crops
are being produced with nonrenewable groundwater abstraction.1

Nature is the silent and unseen victim of water scarcity. The excessive removal of water from freshwater
ecosystems is a leading cause of imperilment for freshwater species. According to the Living Planet Report,
freshwater species populations declined by an estimated 76 percent globally between 1970 and 2010.2

It is time for new approaches in water management
Historically, communities and governments have focused heavily on infrastructure solutions – such as building
water storage reservoirs or importing water from other places – to ensure that their water supply kept pace with
growing water demands.

However, it is now highly unlikely that these supply-side approaches will be able to arrest or reduce water scarcity
at its current levels, nor prevent further expansion and intensification of water scarcity, for three major reasons:
1) There is no more surplus water to be found in most water-scarce regions; 2) The renewable water supply
is declining in many regions as the climate changes; and 3) The costs to secure more water are too high for
communities to bear.

The promise of water markets
Many cities, farms and industries have in recent decades begun to give much greater attention to water
conservation and other forms of demand management, enabling levels of water use to stabilize in many regions.
Sustainable water management in the 21st century will require more than just stopping scarcity from worsening,
however. The volume of consumptive use must be lowered below current levels to alleviate water scarcity. This
will require that governments, or communal water systems such as irrigation districts, set firm limits or ‘caps’ on
consumptive water use to avoid exhausting the available water supply, and to ensure that sufficient water remains
available in freshwater and estuarine ecosystems to sustain their health and productivity.

A common misconception is that any reduction in consumptive water use in irrigated agriculture would
necessarily result in a loss of agricultural productivity or revenue generation. To the contrary, there are many
practical and cost-effective ways to reduce non-beneficial water consumption in irrigated agriculture without
compromising economic returns or crop production, including investments in improving irrigation efficiency
(i.e., regulated deficit irrigation), improving soil management, reducing water losses in delivery systems,
shifting to less water-intensive crops, temporarily fallowing certain crops, reducing farm-to-market crop
losses and other proven measures.

Water use remains highly inefficient in many places, and far too much water is being used for low-value
or wasteful purposes, dampening the water productivity and economic prosperity of many regions. Given
pressing needs to feed and clothe a growing global population, the productivity of water – meaning the
production of crops or others goods, or the economic returns gained per unit of water use – will need to rise
sharply in coming decades.

Lowering existing levels of consumptive water use, while at the same time increasing water’s productivity, will
require both strong governmental leadership as well as game-changing innovation in the private sector. The
establishment of high-functioning and well-governed water markets3 – in which a cap on total use is set; rights to
use water are legally defined, monitored, and enforced; and in which rights can be exchanged among water users
– can provide a powerful integration of public and private efforts to alleviate water scarcity. A well-functioning
water market can provide financial incentives for improving water’s productivity by enabling those willing to use
less water to be compensated by those needing more water, or wanting to return water to the environment. By
so doing, water markets open up pathways for entities wanting to access more water to do so in a highly cost-
effective manner that is far less environmentally damaging than building new infrastructure.

10 / Water Share / Executive Summary
The necessary governance (enabling) conditions to support high-functioning water markets exist in only a few
countries presently, and problematic impediments to water trading can be found in all existing water markets. The
intent of this report is therefore aspirational: to make the case that water markets offer a powerful mechanism for
alleviating water scarcity, restoring ecosystems and driving sustainable water management.

There are six noteworthy benefits of water markets:

1. Stimulating water savings – By establishing a monetary value for water, water markets can provide strong
   stimulus for reducing consumptive water use because a water-saving entity can be rewarded financially by
   selling or leasing the portion of their water rights that is no longer needed. When water is appropriately priced it
   also discourages waste.

2. Increasing water availability – By accessing additional water through a market, a community or
   government can avoid expensive, time-consuming and environmentally-damaging alternatives for
   increasing their water supplies.

3. Improving community flexibility – By enabling the transfer of water between users, individuals and communities
   can adapt more quickly to changing conditions, personal preferences and needs. This includes providing farmers
   with new, revenue-generating opportunities and options for averting irrigation shortages during droughts.

4. Improving water’s productivity and allocation efficiency – By discouraging wasteful or low-value uses of water,
   the trading of water facilitates reallocation of water rights to more productive uses, commonly resulting in more
   revenue generation in local economies.

5. Returning water to nature – Markets offer opportunities for conservation interests and government agencies to
   restore water flows in depleted freshwater and estuarine ecosystems by purchasing water in the market and
   then dedicating its use to environmental purposes.

6. Improving accounting for water use and availability – When water is appropriately priced and water assets are being
   traded, water users are more willing to participate in transparent water measurement and reporting practices.

There are four case studies in Appendix I of this report demonstrating many of the economic, social and
environmental benefits to be gained through water market trading. These case studies illustrate not only the
potential for reducing consumptive water use on irrigated farms, but also for transferring the rights to the saved
water to other farmers or uses, including the environment.

• The San Diego County Water Authority in California (United States) negotiated an agreement with a large
  irrigation district that pays farmers to reduce their consumptive water use. The water saved is transferred to the
  metropolitan area, providing more than one-third of its water supply each year.

• Austin Water in Texas (United States) purchases up to 40 percent of its water each year from a river authority
  that has been bolstering the volume and reliability of its own water supplies through acquisition of water rights
  from irrigation districts.

• More than half of water deliveries by the San Antonio Water System in Texas (United States) have come from
  water rights purchased from farmers or through water-lease agreements with other water providers.

• Farmers in the Murray-Darling Basin of Australia have prospered from an active water market in which more than
  40 percent of water use comes from trades in annual water allocations. This water trading has provided a new
  revenue stream for farmers and helped them manage the impacts of irrigation shortages during severe droughts.

The Nature Conservancy is now advancing an innovative new concept based upon the strategic trading of water-
use rights within select river and lake basins, called a “Water Sharing Investment Partnership.” These institutions
operate with investor capital within existing water markets for the purpose of redistributing water use in a manner
that enables water productivity to increase and economic benefits to grow, while returning water to nature.

                                                                                      Executive Summary / Water Share / 11
The Nature Conservancy launched its first Water Sharing Investment Partnership in Australia in 2015. As of May 2016, approximately AUD$27 million has been invested in the Murray-Darling Basin Balanced Water Fund, with a goal of scaling to AUD$100 million within the next four years. The Nature Conservancy is now building off of this success in Australia, as well as its existing track record of using philanthropic dollars to purchase water on behalf of the environment in North America, to craft WSIPs and a variety of other water transactions and investment mechanisms to help rebalance water use in stressed basins. Conclusions and recommendations for action The potential benefits that could be realized from the establishment of high-functioning, well-governed water markets are significant. At least 37 countries in water-scarce regions have already established water-allocation systems based on the issuance of water rights – an essential precursor for water markets – and more than half of these countries already allow re-allocation of water through trade. If additional countries adopt water rights systems and other important enabling conditions, and allow trading of water-use rights, they too would be able to realize the benefits of water markets elaborated in this report. Those benefits include overall GDP growth with greatly-lessened water constraints, helping all water users better adjust to and manage economic shocks associated with water shortfalls, and reducing social and ecological disruption during droughts and water shortages. This report concludes with four major market-based strategies for alleviating water scarcity that would be applicable in at least two-thirds of all water-scarce basins, presuming that appropriate governance frameworks were in place. These strategies are tailored to four of the six scarcity conditions found in water-stressed basins, as illustrated in Figures ES-2 and ES-3. • Strategy C1 – Facilitate long-term (permanent) water trades within farming communities by establishing ‘farmers’ water markets.’ This strategy is tailored to basins experiencing chronic scarcity, with irrigation water use dominating. Whereas both permanent and temporary water trades will be very useful in these basins, the exchange of permanent rights will be particularly important in reducing long-term, chronic scarcity. A good model is the Murray-Darling Basin, where in recent years nearly 10 percent of all water entitlements, worth nearly AUD$2 billion, have been exchanged each year on average. • Strategy C2 – Facilitate long-term (permanent) trades between farmers and cities. This strategy is designed for basins experiencing chronic scarcity with mixed uses of water. The intent would be to facilitate rural-to-urban water exchanges, either through regional water markets or through bilateral transactions between cities and farming communities. Three urban case studies in Appendix I (San Diego, Austin and San Antonio) document that rural-to-urban water market transfers have spurred GDP growth of 3 to 6 percent per annum in these water-challenged cities over the past decade. • Strategy E-1 – Facilitate short-term (temporary) trades within farming communities. This strategy will be particularly helpful in basins presently experiencing only episodic (dry-year) scarcity with heavy dominance of irrigation water use. During dry years or droughts, mechanisms are needed to substantially reduce or curtail water use on lower-value or annual crops on farms that will not suffer long-term damage from temporary fallowing or deficit irrigation. With proper compensation given to those water users or producers who are able to reduce their water use, this strategy will encourage higher-value crops to be produced. A case study of the Murray-Darling Basin of Australia in Appendix I documents that short-term market trades averted losses in the gross value of agricultural production of 20 to 25 percent in the worst two years of the Millennium Drought. In recent years, approximately 44 percent of all water use has come from trading of annual water allocations, helping to realize gains in agricultural revenues estimated at AUD$2.6 billion each year.4 • Strategy E-2 – Facilitate short-term exchanges between farmers and cities. In basins with episodic scarcity caused by mixed water uses, carefully designed drought management plans will be essential in averting drinking water or electricity shortages, or economic damage due to lost industrial production. Opportunities for short-term lease options with irrigation farmers to free up water supply should not be overlooked as the cost-effectiveness of paying farmers to curtail water use during drought years may look even better than urban conservation strategies. 12 / Water Share / Executive Summary
Figure ES-2. Water scarcity conditions and dominant categories of consumptive water use

                                                                       Water Scarcity Condition Categories

                                         CI - chronic depletion, irrigation dominant                      EI - episodic depletion, irrigation dominant
                                         C2 - chronic depletion, mixed uses                               E2 - episodic depletion, mixed uses
                                         C3 - chronic depletion, urban dominant                           E3 - episodic depletion, livestock dominant
Chronic Depletion

                               C1                                                             C2                                                           C3
                          irrigation                                                         mixed                                                        urban
                          dominant                                                           uses                                                        dominant
Episodic Depletion

                               E1                                                             E2                                                             E3
                          irrigation                                                         mixed                                                       livestock
                          dominant                                                           uses                                                        dominant

                                            Domestic            Manufacturing          Electric            Irrigation           Livestock

 The map above indicates the global distribution of the six water scarcity condition categories described in this report. The pie charts above indicate the proportion of total
 consumptive water use going to each sector, for each of the six scarcity categories. Relative proportions of sectoral water consumption are averaged across all basins within each
 scarcity category. (Source: model outputs from WaterGAP3)

                                                                                                                                  Executive Summary / Water Share / 13
Drying Peppers, Chilean Matorral ecoregion, Chile. © Tom Crowley
Figure ES-3. Market strategies for addressing water scarcity
Scarcity Condition Proposed Strategy Water Market Opportunity
Chronic scarcity, Facilitate long-term
C1 with irrigation water C1 (permanent) water trades
use dominating within farming communities
Chronic scarcity, Facilitate long-term
C2 with mixed uses C2 (permanent) trades
between farmers and cities
Water Sharing Investment
Chronic scarcity, Partnerships or other
C3 with predominantly water transactions or
urban water uses investment strategies
Episodic (dry-year) Facilitate short-term
E1 scarcity, irrigation water E1 (temporary) trades within
use dominating farming communities
Episodic scarcity, Facilitate short-term
E2 with mixed water uses E2 (temporary) exchanges
between farmers and cities
Livestock watering
E3 and subsistence water
uses dominating
Four water market strategies are offered in this report, addressing four of the scarcity conditions found in water-stressed basins around the globe. Market strategies are not
offered for scarcity conditions C3 and E3, for reasons explained in the text.
14 / Water Share / Executive SummaryIf all four of these strategies could be fully implemented – in just the countries with existing water-rights systems
and some evidence of water trading already taking place – they could collectively generate total annual water sales
of USD$13.4 billion per year, equating to market assets of USD$331 billion (Table ES-1).
Unleashing the benefits of water markets will require bold leadership and concerted action on the part of non-
governmental organizations (NGOs), irrigation farmers, political leaders, private investors and urban water
managers. Specific recommendations are offered for each group.
Table ES-1. Potential water sales and market asset values of four water market strategies
Strategy Potential Annual Water Sales (USD$ billions) Potential Market Value (USD$ billions)
C1 3.8 37.7
C2 1.0 6.7
E1 0.6 18.7
E2 8.0 268.2
TOTAL 13.4 331.3
Executive Summary / Water Share / 15More than 30% of the water
sources on our planet are being
over-exploited
Colorado River Delta, Mexico. © Nick HallChapter One
Running Out of Water
Introduction
It has been said that necessity is the mother of invention. This is perhaps nowhere more evident than in our
relentless pursuit of water to serve a rapidly growing human population.
From the moment early nomadic tribes began to settle into sedentary, agriculturally-based lifestyles more than
10,000 years ago, the prosperity of human communities has been tightly connected to the presence and reliability
of their water sources.
The annual flooding of the Tigris and Euphrates Rivers – which saturated and spread nutrient-rich sediments
across a vast floodplain – set the stage for the rise of a farming-based society in the Fertile Crescent. At the mouth
of the Nile, ancient Egyptians diverted the river’s water onto crops using earthen dykes. Far upriver, in what is now
known as the Sudan region, the Nubians invented a waterwheel-like device called a sakia to lift the river’s water
onto their farms. In China, some of the earliest known hydraulic engineers transformed a vast area of the Chengdu
Plain along the Min River into the Dujiangyan irrigation system. It is still in use today to grow crops across more
than 5,300 square kilometers.
Nairobi, Kenya. © Nick Hall
Chapter One / Water Share / 17As the human population grew and spread around the globe, so too did the practice of diverting rivers and other
water sources to irrigate crops. Many smaller rivers and shallow groundwater aquifers were fully drained for
irrigation use by the early 20th century (Figure 1), but when engineers gained the ability to construct large dams
beginning in the 1930s, they harnessed some of the largest rivers on the planet and diverted the water onto farms
(see “Aral Sea” sidebar). Similarly, the use of groundwater – which began with shallow hand-dug wells in ancient
times but rapidly intensified with the invention of industrial-scale pumps in the mid-20th century – has extended
the reach of agricultural irrigation into aquifers thousands of feet beneath the Earth’s surface.
Today, with the world’s population exceeding 7 billion and growing, irrigated agriculture remains essential to our
well-being, supplying nearly 40 percent of the global crop harvest. Our food security and our global economic
prosperity are now at serious risk because one-third of the water sources on our planet are being over-exploited
– to near exhaustion – and additional water supplies are beyond affordable reach in many of those basins.5 In
thousands of rivers, lakes and aquifers around the globe, more than three-quarters of the water that naturally
replenishes their hydrologic systems is being consumed for human use, damaging the planet’s freshwater and
estuarine ecosystems and leaving many farms, cities and industries at serious risk of water shortages during
droughts. More than 90 percent of water consumption in water-scarce regions takes place on irrigated farms, and
20 percent of that irrigation is supplied with non-renewable groundwater.6
Figure 1. Global water depletion
Figure 1a. Year 1900, Irrigation only Figure 1b. Year 1950, Irrigation only
Figure 1c. Year 2005, Irrigation only Figure 1d. Year 2005, All water users
DEPLETION LEVELS
>100% 75–100% Seasonal Dry Year 50–75% 25–50% 5–25% 100 percent) indicate the level to
which consumptive water use is depleting the annual renewable water supply. ‘Seasonal depletion’ means that heavy depletion (>75 percent) occurs primarily in certain months
of the year, and ‘Dry year depletion’ occurs only during drier years or droughts. As evidenced by Figure 1a, water scarcity has been a challenge for human societies for a very long
time. Farmers in the Middle East, Asia and western North America were exhausting many of their local water supplies by the turn of the 20th century, a condition that spread and
worsened over the past century. The first three maps (Figures 1a, 1b and 1c) show depletion attributable solely to irrigation. Figure 1d is based on all water uses in 2005. As can be
seen by comparing the two maps for 2005, much of the water depletion globally is attributable to irrigation (adapted from Brauman et al. 20165 and Siebert and others, 20157).
18 / Water Share / Chapter OneThe Aral Sea: Turning a Lake into Cotton
A century ago, the Aral Sea of Central Asia was one of the four largest freshwater lakes in the world (Figure 2), covering more
than 67,000 square kilometers. Its name means “sea of islands,” referring to the more than 1,100 islands that historically could
be found in the lake. For thousands of years, with no outflow from the lake, water levels fluctuated from year to year in response
to the inflow of water from two rivers – the Amu Darya and the Syr Darya – and the loss of water to evaporation. Those natural
variations changed dramatically when the former Soviet Union began diverting both rivers for farming.
In the 1920s, under the Soviet leadership of Joseph Stalin, a decision was made to grow cotton in the area. This decision was,
in part, predicated on the belief that the Aral Sea was a “useless evaporator” and a “mistake of nature.”8 The Soviets would
instead produce “white gold” (cotton) by diverting the rivers flowing into the lake. By 1988, Uzbekistan had become the world’s
largest exporter of cotton.
The irrigation canals built in the region until 1960 diminished the lake only slightly, but the Soviets then embarked on an
ambitious expansion of the cotton farms. By the early 1980s, the waters of the Amu Darya and Syr Darya no longer reached
the Aral Sea. By 1987, the water level in the lake had lowered so much that the lake split into a northern and a much larger
southern portion (see Figure 3a). By 2002, the southern portion had split apart into an eastern and western half. In July 2014,
the eastern half of the southern portion dried up entirely (see Figure 3b).
The shrinking of the Aral Sea has been called “one of the planet’s worst environmental disasters.”9 The region’s once-
prosperous fishing industry supporting 60,000 jobs and harvesting up to 50,000 tons of fish each year has been destroyed,
bringing severe economic hardship.10 The salinity concentration of the sea has increased ten-fold, and now provides habitat
suitable only for brine shrimp, whereas 84 fish species once inhabited the lake and its tributary rivers. As the lake began to dry
up, toxic levels of sodium chloride and pesticides began swirling into dust storms, affecting every level of the lake’s food chain,
including human residents of the area. Local communities now suffer from esophageal cancer at a rate 25 times higher than the
rest of the world due to inhalation of toxic wind-blown dust lifted from the now-dry lake bed.
Figure 2. Aral Sea
Legend
Location of Aral Sea
Figure 3. Declining water levels in the Aral Sea
Figure 3a. Aral Sea, Year 2000 Figure 3b. Aral Sea, Year 2014 Aral Sea extent 1960
The Aral Sea has been shrinking since the 1960s
due to diversion of the rivers flowing into the
lake for use in irrigating cotton and other crops.
The lake’s extent in 1960 is shown with hashed
shading in Figure 2 and in black outline in
Figure 3. (Photos: NASA Earth Observatory)
Chapter One / Water Share / 19The fact that irrigation is the dominant consumptive user of water explains why the strategies for alleviating
water scarcity presented in this report are so heavily focused on reducing water consumption on farms. There
are many good reasons for saving water in every type of water use. For example, any use of water has the
potential to reduce its quality and temperature before the water is returned to a freshwater source, thereby
reducing the suitability of the water for subsequent uses or for ecosystem support. It also takes a great deal of
energy to move water around, or to treat it to an acceptable water quality after use, so all reductions in water
use can lessen energy requirements or pollution. But – as explained further in later chapters of this report –
there are few places in the world where water scarcity can be alleviated without substantially reducing the
volume of water being consumptively used in agriculture.11
Accounting for Water: Withdrawals versus Consumptive Use
The ultimate physical cause of water scarcity is easy to understand: just as with a bank account, when more money or water is
being removed than is being deposited, the account will eventually go dry.
This simple reality has been obscured by the way water use has been accounted for in most countries and water-use reports.
The most commonly reported water-use statistic is water withdrawals – the volume of water that is withdrawn (extracted)
from freshwater sources. However, a large proportion of the withdrawn water is returned to the original freshwater source
after use, meaning it is redeposited in the water account and doesn’t permanently deplete the source – it remains available for
other users. In the United States, for example, more than half of all water withdrawn from rivers, lakes and aquifers is returned
to these water sources after use (see Table 1). The water that is not returned to the original source after use is referred to as
“consumptive use” (i.e., the water that is lost from the original source after use). When trying to understand the causes of water
scarcity, and designing strategies for alleviating scarcity, it is the consumptive use of water that matters most. If the rate of
consumptive use approaches or exceeds the rate of water replenishment, water shortages can be expected.
Unfortunately, the volumes of consumptive use are rarely accounted for, or reported, for most of the world’s water basins.
This has generated widespread misunderstanding of the root causes of water scarcity, and has often diverted attention away
from the types of water use that consume the greatest volumes of water. For example, in the United States, the largest volume
of water withdrawal goes to electricity production at power plants, accounting for nearly 50 percent of all water withdrawn
from freshwater sources (Table 1). However, less than 10 percent of water used in these power plants is consumptively used,
meaning that this type of water use is seldom a major cause of water scarcity.12 By comparison, irrigation water use on farms
in the United States consumptively uses twice the volume of water consumed for all other purposes. Globally, irrigation
consumes 10 times more water than all other uses combined.
Table 1. A comparison of annual water withdrawals and consumptive water use in the United States
Percent of total Volume of Percent of total
Volume of withdrawals*
withdrawals consumptive use* consumptive use
Domestic use 57 BCM 10 percent 10 BCM 6 percent
Industrial and mining use 57 BCM 10 percent 10 BCM 6 percent
Thermoelectric use 278 BCM 49 percent 5 BCM 3 percent
Irrigation and livestock use 176 BCM 31 percent 141 BCM 85 percent
TOTALS 568 BCM 100 percent 166 BCM 100 percent
Global Water Use
Domestic use 380 BCM 10 percent 42 BCM 4 percent
Industrial and mining use** 780 BCM 21 percent 38 BCM 4 percent
Irrigation and livestock use 2,600 BCM 69 percent 945 BCM 92 percent
TOTALS 3,760 BCM 100 percent 1,025 BCM 100 percent
*Reported in BCM = billion cubic meters
**Includes thermoelectric use
(Source: Chasing Water: A Guide for Moving from Scarcity to Sustainability, by Brian Richter, 2014. Island Press, Washington, D.C.)
20 / Water Share / Chapter OneAs illustrated by the time series of maps in Figure 1 (see page 18), water scarcity tends to accumulate gradually
and insidiously, as more water is consumptively used each decade, until water-user communities are confronted
with the limits of their renewable water supplies and begin to experience harmful water shortages. Ultimately,
water shortages and the over-extraction of water from freshwater ecosystems represent a failure of governance
– whether formal or communal – to control cumulative water demands within the limits of renewable supply. As
the authors of the United Nations’ 2015 report, “Water for a Sustainable World,” wrote: “Over-abstraction is often
the result of outdated models of natural resource use and governance, where the use of resources for economic
growth is under-regulated and undertaken without appropriate controls.”13
The graphs of historical water supply and use in Figure 4 illustrate this problem. Typical of most water-stressed
basins around the world, the volume of consumptive water use gradually increased over time in both the
Murray-Darling Basin of Australia and the Colorado River of the western United States, largely without restraints.
Governments and private interests constructed extensive systems of pipelines and canals to deliver water to
farms, cities and industries. Large water storage reservoirs were also built in both river basins to capture and more
fully utilize the water flowing through these river systems.
As the recent decades have shown in both of these basins, there is great risk in allowing water consumption to grow too
close to the limits of water availability. In drier times, the result is serious economic and ecological consequences.
Figures 4. Historical water supply and use
Figure 4a. Water availability and use in the Murray-Darling Basin of Australia
35
30
Water available,
Volume of Water (BCM)
25 3-year moving average
Millennium
20 Drought
15
10
5
Water use
0
1920 1925 1930 1935 1940 1945 1950 1955 1960 1965 1970 1975 1980 1985 1990 1995 2000 2005
Figure 4b. Water availability and use in the Colorado River Basin of the United States
25
Water available,
Volume of Water (BCM)
20 10-year moving average
15
10
5
Water use
0
1923 1933 1943 1953 1963 1973 1983 1993 2003 2013
Typical of rivers and aquifers in water-scarce regions around the globe, consumptive water use in the Murray-Darling Basin of Australia (upper graph) and the Colorado River
Basin in the western United States (lower graph) increased gradually over time, eventually reaching the limits of water availability. Note that in the Colorado River Basin, the use
of stored water in large reservoirs, along with overdraft of groundwater aquifers in the basin, has enabled consumptive water use to exceed the river’s supply in recent years.
(Sources: Murray-Darling Basin Authority, U.S. Bureau of Reclamation, Colorado River Research Group)
Chapter One / Water Share / 21Taking stock of scarcity in the world today
The balance of water supply and demand within each of the world’s water basins has been assessed by numerous
research groups, using a variety of global hydrology models. Model outputs from the newest version of “Water
– A Global Assessment and Prognosis” (referred to as the WaterGAP314 model) have been used in this report as
the basis for understanding where water scarcity exists around the globe and how water is being used in each
water basin. This information is also used in formulating recommendations for action that will be discussed in the
concluding chapter of this report.
WaterGAP3 calculates water balance outputs for 143,653 individual water basins globally. Following the
approach taken in Brauman and others15 (2016) for data reliability reasons, only the 15,091 of these water
basins larger than 1,000 square kilometers, constituting 90 percent of total land area, are used in developing
conclusions and recommendations.16
Renewable water flows are being heavily depleted in nearly one-third (approximately 4,800) of the water basins
assessed (Figure 5). Among these depleted basins:
• Approximately 1,700 basins (35 percent) are chronically depleted, meaning that more than 75 percent of the
renewable water replenishment is consumptively used on either an annual or seasonal basis.
» The consumptive water use in two-thirds of these chronically-depleted basins is dominated by irrigated
agriculture (condition category C1).
» A blend of irrigation and other uses, including municipal and industrial, can be found in one-fifth of these
basins (condition category C2).
» Irrigated agriculture is nearly or fully absent in nearly one-fifth of these basins, and urban (municipal and
industrial) water uses are dominant (condition category C3).
• Approximately 3,100 basins (65 percent) are episodically depleted, meaning that consumptive use exceeds 75
percent of the renewable water replenishment only during drier years or droughts.
» Irrigated agriculture is dominant in one-quarter of these episodically-depleted basins (condition category E1).
» A blend of irrigation and other uses can be found in one-quarter of these basins (condition category E2).
» In nearly half of these episodically-depleted basins, annual rainfall is relatively low, and livestock grazing and
subsistence uses of water account for the majority of water use (condition category E3).
Smallholder farmers, India. © Brian Richter
22 / Water Share / Chapter OneFigure 5. Water scarcity conditions and dominant categories of consumptive water use
Water Scarcity Condition Categories
CI - chronic depletion, irrigation dominant EI - episodic depletion, irrigation dominant
C2 - chronic depletion, mixed uses E2 - episodic depletion, mixed uses
C3 - chronic depletion, urban dominant E3 - episodic depletion, livestock dominant
Chronic Depletion
C1 C2 C3
irrigation mixed urban
dominant uses dominant
Episodic Depletion
E1 E2 E3
irrigation mixed livestock
dominant uses dominant
Domestic Manufacturing Electric Irrigation Livestock
The map above indicates the global distribution of the six water scarcity condition categories described in the text. The pie charts above indicate the proportion of total
consumptive water use going to each sector, for each of the six scarcity categories. The relative proportions of sectoral water consumption are averaged across all basins within
each scarcity category. (Source: model outputs from WaterGAP3)
Chapter One / Water Share / 23Increasing the risk of water shortage
The World Economic Forum has recognized water shortages as being among the greatest risks to the global
economy17 – and for good reason. The map in Figure 6 highlights 112 recent water shortage events compiled by
The Nature Conservancy and CDP.18 While droughts are commonly blamed as being the cause of water shortages,
Figure 7 documents the fact that the likelihood of water shortages is much greater in regions where existing levels
of consumptive use are nearing or exceeding the limits of their renewable water supplies. While the onset of a
drought certainly reduces available water supplies, droughts only create shortages for people and the environment
when the water source is already being too heavily exploited on a regular basis.
Some recent examples of water shortage events include:
• Agriculture: Water shortages in the Badin District of Pakistan in 2013 left 27,000 hectares of rice farms without
water, impacting 100,000 farmers and causing an economic loss of PKR1.3 billion (USD$12.4 million).
• Manufacturing: Water shortages in the Yellow River basin in 2000-2007 caused industrial losses in Gansu
Province of over CNY 1.8 billion (USD$278 million).
• Mining: Water shortages in 2014 at the Los Bronces mine in Chile caused loss of 30,000 tons of copper production.
• Electricity generation: Water shortages in the Tana River basin of Kenya in 1999-2000 led to the loss of
hydropower generation and associated industrial production, resulting in losses of over USD$2 billion.
• Urban water supply: Water shortages in Cameroon in 2011 left household water taps dry, forcing the city’s
residents to line up for hours at groundwater wells and carry their water to their homes.
• Fisheries: Insufficient freshwater inflows to Florida’s Apalachicola Bay (United States) in 2013 led to a 60 percent
decline in oyster populations, resulting in revenue losses of 44 percent in the shellfish industry.
• Tourism: Low water levels in Lake Mead on the Colorado River in the United States during 1999-2003 led to
900,000 fewer tourist visits, 680 lost jobs, a USD$28 million loss in visitor spending and USD$9.6 million loss
in personal income.
Figure 6. Location of 112 water shortage events
Agriculture Urban drinking water Environmental Corporate (from CDP)
(Sources: The Nature Conservancy, University of Virginia and CDP)
24 / Water Share / Chapter OneFigure 7. Water shortage impacts
4
Impact Occurences per Unit Area
3.5
(Impacts per million km2)
3
2.5
2
1.5
1
0.5
0
75%
Water water
The likelihood of experiencing water shortage impacts is much greater when renewable Depletion
suppliesCategory
are being depleted by 75 percent or more on a regular basis, as indicated
by the ‘Dry-Year,’ ‘Seasonal’ and ‘>75 percent’ annual depletion categories. One-third of all water basins evaluated fall into these heavily-depleted categories. All other water basins
areYou can also read