Water disruption: investment risk from multiple angles - OCTOBER 2020 WATER DISRUPTION
←
→
Page content transcription
If your browser does not render page correctly, please read the page content below

OCTOBER 2020

Water disruption:
investment risk
from multiple angles
 FRANKLIN TEMPLETON THINKSTM   WATER DISRUPTION

In this issue
3      Before the well runs dry: the time for investors to understand water risk is now
       Julie Moret, Global Head of ESG, Franklin Templeton

8      Water-related risks in equities: pricing in risk
       Donald Graham, CFA, ESG Specialist, Templeton Global Equity Group

13     Directly engaging to understand water risk
       Gail Counihan, ESG Analyst, Franklin Templeton Fixed Income

17     The future is here: municipal bond risk and a shrinking river
       Greg Danielian, Research Analyst, Franklin Templeton Fixed Income

23     Water markets are key to properly valuing water
       Greg Wilkinson, CFA, Institutional Portfolio Manager, Franklin Real Asset Advisors

27     From drought to deluge: when too much water is the problem
       Jonathan Malawer, CFA, Head of insurance linked securities, commodities and environmental strategies, K2 Advisors

Acknowledgement
The authors wish to thank Dr. Dustin Garrick, Co-Director of the Smith School
Water Programme and Co-Convener of the Oxford Water Network at Green
Templeton College, University of Oxford. His insights and initial conversations
on this concept were invaluable.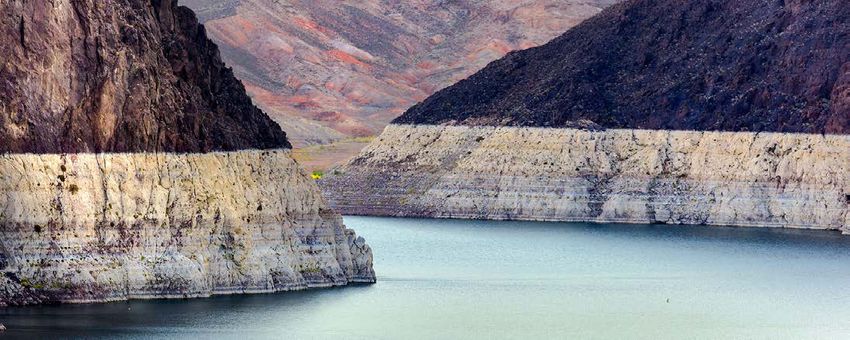
Julie Moret
                   Global Head of ESG
                                            Before the well runs dry:
                                            the time for investors
                   Franklin Templeton

                                            to understand water risk
                                            is now

‘‘    When the well is dry, we know the worth of water.”
      Benjamin Franklin, 1746

There is a lot of talk about how regulatory reforms connected
to climate change will impact financial markets. However, we
                                                                  With all the charts, examples and best practices we outline in
                                                                  this piece, ultimately, we are trying to help end investors
                                                                  understand that water itself isn’t just an economic policy
                                                                  issue and risk arising from population growth and climate
                                                                  change. Water is impacting the day-to-day operations of
                                                                  investee companies and how they are thinking through their
firmly believe the leading issue, at the end of the day, is
                                                                  own business models and business risk.
that we have been entrusted to look after our clients’ assets
and are responsible for returning those assets in better condi-
tion than when we received them. Therefore, we have a duty
                                                                  The macro view: our water future
to understand the full spectrum of business relevant risks that   By 2030, the global population will reach nine billion and the
can reshape a company’s or sector’s competitive positioning       world will require 40% more water than it does today.1
in the marketplace and impact its operational resiliency.         However, the global supply of accessible fresh water accounts
                                                                  for less than 1% of water supplies and will not grow with
Riffing on Benjamin Franklin’s observation in the context of      population. This limited supply is threatened by overuse,
the current landscape of understanding the importance of          contamination, and over-demand. The World Economic Forum
water to financial markets: if we don’t know how much water       (WEF) has identified “Water Crisis” as one of the top five
there is in the well, we won’t know until the well goes dry.      global risks in terms of impact in nine out of its last 10 Global
Meaning: unknown and undisclosed risks are likely to be           Risks Reports, including 2020.2 The WEF classifies water
mispriced and put assets at risk. Therefore, companies and        crisis as a “Societal” risk; it’s easily argued that a water crisis
sectors lacking understanding of their water sources and          would envelop the totality of the WEF’s risk categories:
footprints, lagging in disclosure of water risk, and/or post-     economic, environmental, geopolitical and technological.
poning adjustments to the regulatory reforms touched upon         Critical investments in purification, reuse, efficiency and
later in this piece all present long-term risks to investors.     delivery infrastructure are required on a global scale—
                                                                  including in first world countries such as the United States.

                                                                             Water disruption: investment risk from multiple angles   3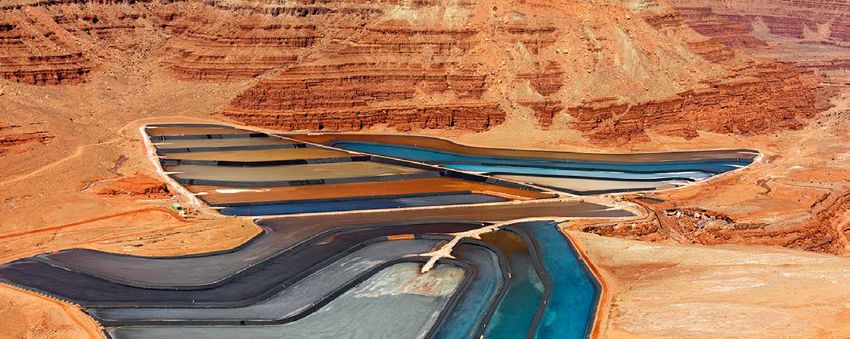
WATER SCARCITY WILL IMPACT GDP                                                               Then, there’s climate change. Projections of 2°C increases in
Exhibit 1: Economic impacts of climate change-induced water                                  global temperature from climate change, expected by
scarcity by world region, 2050                                                               2050, will accelerate water scarcity in many regions of the
As of 2016
                                                                                             world. As seen in Exhibit 1, the World Bank estimated
Range of variation in GDP
                                                                                             that water scarcity exacerbated by climate change will cost
 15%
                            11.50
                                                                                             some regions 6% in gross domestic product (GDP)—
 10%                                                                                         without policy change, declines may reach 14%.3 These
    5%                                        3.32                                           declines are not limited to frontier and emerging markets; they
                                                       1.46
                  -0.82              0.38                       0.00     -0.01     0.09      impact every continent and economy, as seen in Exhibit 2.
     0                                                                   -0.02               The San Francisco Bay Area—home of Franklin Templeton’s
                                                                -0.02             -0.49
          -6.02                                        -1.98
 -5%                                                                                         headquarters—is in one of these water stressed regions.
                                    -7.08     -7.05
-10%                                                                                         This may seem counterintuitive to some. California is
                  -11.70 -10.72
                                                                                             perceived to be a land of abundance; home to two of the
-15%     -14.00
                                                                                             world’s most fertile and water intensive valleys—the “Central”
         Middle   Sahel Central Central       East    South North Western World              and “Silicon”—one growing almonds and the other cooling
          East           Asia Africa          Asia     East America Europe                   data servers. In reality, it’s in one of the most drought-
                                                       Asia
                                                                                             prone and high water risk regions in the world. And, without
Source: World Bank. “High and Dry: Climate Change, Water, and the Economy,” World
                                                                                             early 20th century water wars (have you seen the movie
Bank, Washington, DC. 2016. Note: The range of impacts, as determined by the type
of policies implemented to cope with water scarcity, is from a business-as-usual             Chinatown?), multi-billion-dollar infrastructure investments,
policy (–14%) to a policy seeking to reallocate water to the most productive uses (–6%).     and a system of the most complex and litigated intrastate and
There is no assurance that any estimate, forecast or projection will be realized.

WATER STRESS IMPACTS ALL MARKETS
Exhibit 2: Country-level water stress in 2040 under business-as-usual scenario

Ratio of withdrawals to supply
    Low (80%)

Source: World Resources Institute, August 2015. Note: Projections are based on a business-as-usual scenario where global socioeconomic and emission trends continue on their
current trajectories.

4        Water disruption: investment risk from multiple angles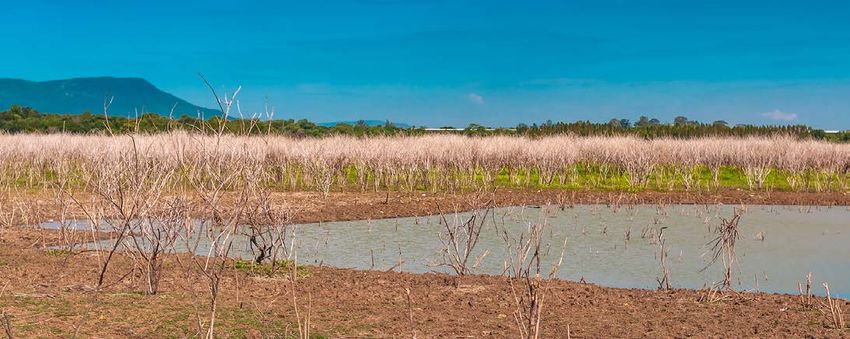
binational water agreements on the planet, the world’s fifth
 largest economy would have run out of water decades ago.               WATER ACCOUNTING 101
 Think about that in the context of risk to an investor.
                                                                        As you will see throughout this piece, water accounting is highly
 Finally, California is often cited as a microcosm for an               complex and often misunderstood. Again, it is where mispricing
 impending global water crisis driven by population growth and          happens. Much of this has to do with how water is measured
 climate change.4 Referring to the highly complex nature of             and where it is in the system—whether it is groundwater or
 water in California combined with climate change, Dr. Peter            surface water, in a river or a lake.
 Gleick—a MacArthur Genius Fellow who many refer to as the
                                                                        How much water am I looking at here?
 foremost expert on world water—points to California as a
                                                                        One of the biggest challenges in understanding water data is
“laboratory for all of peak water’s concerns.”5 Peak water is
                                                                        how it is measured. Gallons? Liters? Acre-feet? Liters per
 an idea he coined akin to peak oil. Meaning, all the water
                                                                        minute? Hectares? cfs/acre? If you're storing it, it is one thing;
 (or oil) on the planet is already here. As we use it, and pollute
                                                                        if it is moving, it is another. If it is falling out of the sky,
 it in the case of water, it will never be replaced. Again, take
                                                                        it is another thing altogether. If you are irrigating with it, it is
 a minute to think about that in the context of risk to an
                                                                        something different. And if you are generating power from it,
 investor. Yet very few asset managers are talking about water
                                                                        then it gets more complicated. And then these calculations
 risk as an investment concern. Why is that?
                                                                        must be converted if you are moving across an international
                                                                        border where one country uses imperial measurement and the
 Why we’re thinking about water…                                        other uses metric (e.g., China-Myanmar; US-México).
 The projected declines in water availability, and corresponding
                                                                        Use it, use it again, use it one more time…try using it
 dips in GDP, present across-the-board risk for investors.
                                                                        again…use the last drop
 And these risks extend to all asset classes and encompass a
                                                                        Water can be used multiple times. One liter of water may
 broad range of sectors—from those with logical connections,
                                                                        be in a river and be used to generate hydropower as it moves
 like agriculture and utilities, to those that may not be so
                                                                        through a dam. Downstream, it can be pumped out by a
 apparent, like packaging and semiconductors. In already
                                                                        community for municipal use, used, then treated again and
 water-stressed emerging and growth markets, like China and
                                                                        discharged back into the river. Further downstream, it can
 India, climate change models project that stress to grow.
                                                                        be diverted for irrigation of crops. It is important to understand,
 This significantly impacts sectors where many investors are            typically, the more water is used it depletes the quality of
 now seeing growth opportunities, such as: apparel, textiles,           that water. For example, in the United States, every drop of
 metals, mining and materials. These sectors are essentially            water in the Colorado River is said to be used 17 times.6
“building blocks” for other sectors. Therefore, the water               By the time it reaches its end, the water must be desalinated
 risk in these sectors does not stop once they are grown or             before it can be used yet again.
 extracted; they carry forward to the complex web of sectors            Is it surface water or groundwater? Yes…?
 that transform the building blocks into products—think                 Groundwater, once pumped and discharged, becomes surface
 of everything from lithium-ion batteries in your smartphone,           water and surface water that does not evaporate can seep into
 to the shirt you’re wearing.                                           the ground. And over time, surface water becomes groundwater
                                                                        again. In many countries, both are regulated differently.
 As stewards of our clients’ assets, we believe water risk must
 be accounted for in portfolios today, not in 2030 or 2050.
 But how can this be done? Water is not only a misunderstood
 commodity but also a basic human right recognized by the            These are all important questions. And we admit we don’t
 United Nations (UN) in 2010. As sustainability-informed             have all the answers. But we are thinking about these
 investors using environmental, social and governance (ESG)          questions on a daily basis and aspire to grow our knowledge
 metrics as key performance indicators (KPIs), how do we             base and capabilities. It is our duty as active managers and
 address the dual-bottom line of adding value to clients’            stewards of our clients’ assets to find solutions that address
 portfolios while also contributing to positive outcomes? How        information gaps and benefit clients’ portfolios. It is within
 do we translate macro-scale risks into a focused investment         these information gaps that mispricing happens. Where
 lens? And, finally, what is our role as investors and what more     mispricing happens, an active manager can find opportunity.
 can we do to move the dial?

                                                                                 Water disruption: investment risk from multiple angles        5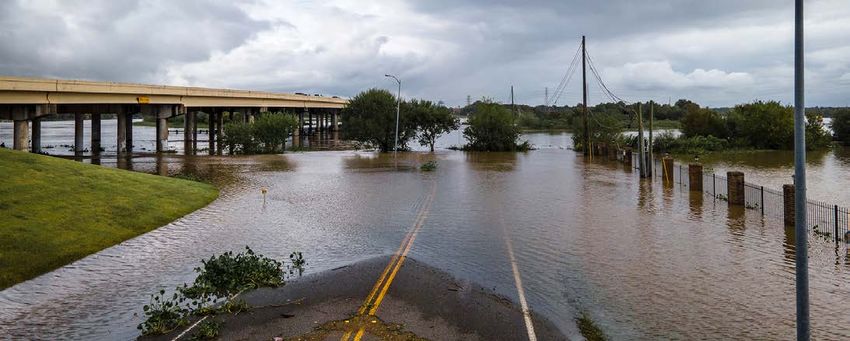
In the case of water, we see three main areas contributing to      Bottom line: water risk imperils clients’ assets
information gaps: pricing, risk and markets. The subsequent        Our fundamental position is guided by three main principles.
chapters of this piece explore each of these ideas through the     First and foremost, our stewardship and fiduciary responsi-
lens of equity, fixed income and alternative investments.          bility to our clients. We must make better-informed decisions
                                                                   because we have a duty to our clients.
The signals
                                                                   Second, the time to identify water risk is now, not the future.
Before we dive in, it is important to quickly discuss the
                                                                   Water risk is a material risk. We must recognize that broader
underpinnings of our strategy related to water. First, we
                                                                   environmental risks are beginning to pose business-relevant
believe ESG factors can have a material impact on the long-
                                                                   vulnerabilities today. These vulnerabilities translate into
term performance of the investments we make. And, as
                                                                   asset value destruction through asset impairment via valua-
ESG-informed investors, we analyze ESG factors alongside
                                                                   tion. We are always trying to connect the dots on how
traditional financial and economic measures, to promote a
                                                                   these broad issues translate into asset impairment by identi-
more comprehensive view of the value, risk and return
                                                                   fying the channels of financial impact that macro-factors
potential of an investment. The analysis includes looking at
                                                                   could have on a company and how our analysts price in this
current and upcoming “signals” that are going to shift the
                                                                   impact—whether pricing through a readjustment to a financial
landscape for all investors. We don’t want to go into great
                                                                   model or through an adjustment to a company’s financial
detail about these regulatory issues but feel it is important to
                                                                   forecast. For example, if a company operating in a water-
touch on them briefly.
                                                                   stressed region does not have good governance and/or broad
Current signals include the UN Sustainable Development             oversight of its water supply, these problems will trickle
Goals (SDGs) and the corresponding targets set for 2030.           down to the bottom line through higher operating costs or a
These will drive companies’ bottom lines, consumer and             lack of supply chain optimization.
investor behavior, and the long-term viability of some indus-
                                                                   Third, as active managers, ultimately, our goals are to be
tries. Looking forward, we are confident major regulatory
                                                                   better informed managers generating sustainable risk-adjusted
reforms focused on directing investor capital toward carbon
                                                                   returns for our clients. We must be able to identify companies
neutrality, such as the implementation of the 2019
                                                                   and sectors, through their management of these issues,
Sustainable Finance Disclosure Regulation (SFDR) and
                                                                   that differentiate themselves as better run businesses.
the 2021 European Union (EU) framework for a common
                                                                   We must identify companies where latent risks become much
classification for sustainable activities (aka, the “Taxonomy
                                                                   more business relevant, and in quicker time frames than
Regulation”), are going to drive assets toward companies
                                                                   anticipated. We are also seeking to identify companies
implementing best practices for sustainability and disclosure.
                                                                   providing solutions to deal with water scarcity, water sanitation
As we highlight throughout this piece, disclosure is key
                                                                   and water efficiency.
to understanding risk and is lacking in many industries.
In our view, companies and sectors currently leading on            We anticipate these issues are going to take on much more
disclosure of water risk and its impacts on operating costs will   prominence in the asset management industry and the client
have a leg up on competitors who are trailing or resistant.        landscape. Issues related to climate change—water scarcity,
                                                                   sea level rise, more severe storms and wildfires—can no
                                                                   longer be ignored or be considered latent risks just because
                                                                   many believe they are priced too far out or they will not
                                                                   impact portfolios until a point in the distant future. As a fidu-
                                                                   ciary for our clients’ assets, we must be positioning our
                                                                   portfolios for climate change today, not in 2030 or 2050.

6    Water disruption: investment risk from multiple angles
Water-food-                                                   As alluded to previously, water is an essential component of most sectors of the
                                                              economy. It is the intersection of water, food and energy—commonly referred

energy nexus                                                  to as the “nexus”—where the interdependencies and complexities peak. These
                                                              interactions rank among the most complex global challenges today and will
                                                              only grow over the coming decades. Food and energy production cannot happen
                                                              without water. As investors, our goal is to seek to understand the effect of these
                                                              complex interactions on companies and industries.

                                                              Agriculture accounts for 70% of global freshwater use. Due to urbanization, popula-
                                                              tion growth, climate change, and increased adoption in developing markets of
                                                              high caloric diets now common in developed markets, the World Bank estimates
                                                              global agricultural production will need to expand 70% by 2050 in order to
                                                              meet demand.7 Northeast China, northwest India, and the southwestern US are the
                                                              global agriculture regions facing the greatest water risk in the coming decades.
                                                              Without action to address this risk, these three hotspots will suffer shocks that will
                                                              impact global financial markets, trade and food security.8

                                                              Energy production accounts for 75% of global industrial water use. And power
                                                              plant cooling is responsible for over 40% of freshwater withdrawal in Europe and
                                                              nearly 50% of that in the United States.9 Global withdrawals are expected to
                                                              increase 20% by 2040, and countries like China and India may see even higher
                                                              demand as they build more power generation capacity to meet growing urban
                                                              demands.10 You are likely looking at these figures and questioning the math based
                                                              on what you read in the previous paragraph regarding agriculture usage.

CAN’T HAVE ONE WITHOUT THE OTHERS
Exhibit 3: Water-food-energy nexus

                                                           Land use decisions                              Water is needed to
                                                           impact water quality                            grow food crops and
                                                           and availability.                               support livestock.
WATER                                                                                                                                                            FOOD
40% increase in water                                                                                                                                            50% increase in food
demand by 2030                                                                                                                                                   demand by 2030

                                                                                  ENERGY
                                                                                  50% increase in energy
                              Energy is needed to                                 demand by 2030                                       Energy is needed
                              extract, treat and                                                                                       for crop irrigation and
                              distribute drinking water.                                                                               food processing.

                                                           Water is needed to                               Agricultural land is
                                                           cool power plants.                               needed to grow energy
                                                                                                            crops, such as biofuels.

Source: Franklin Templeton and UN. For illustrative purposes only.

                                                              In this piece, we will focus on water, but our next two Big Ideas pieces on
                                                              environmental disruption will delve into food and energy. It is this trifecta where we
                                                              see the most potential for risk, price disruption and overall market impacts as
                                                              we move into the next years and decades. And, as we’ve already pointed out, these
                                                              issues will be substantially impacted by climate change and be key drivers of
                                                              shocks to markets.

                                                                                                                Water disruption: Investment risk from multiple angles                  7
Donald Graham, CFA
ESG Specialist
Water-related risks in
equities: pricing in risk
Templeton Global
Equity Group
Water risk impacts investors’ equity holdings in two simple, that must be properly treated and stored to avoid harmful
yet key, ways: decreased revenues and increased costs. releases of toxic waste into the surrounding environment.
These risks manifest operationally, potentially impacting or Therefore, the two main water-related risks impacting the
preventing a company’s day-to-day operations, and through mining industry are:
the company’s understanding and management of risk
1. Equitable water access—What are the community, environ-
via its water and wastewater management plans. Risk in these
mental and capital considerations related to water
plans surfaces through supply and demand needs, proper
access and are they being addressed in ways that are both
treatment and storage of wastewater, and the company’s inter-
responsible and sustainable?
actions with local stakeholders and communities. If not
properly managed, these risks can lead to regulatory and 2. Responsible wastewater management—The bulk of water
reputational issues in addition to a negative impact on used for mineral processing is retained in tailings disposal
water sources required for operations. And, if not properly facilities, where the non-valuable parts of ore are stored
understood and priced, these risks can negatively impact after separating the valuable fraction. The safety of these
clients’ assets. facilities for the environment and surrounding communities
is of paramount importance and represents a material risk
A closer look at mining and minerals that requires close scrutiny.
To illustrate these issues, we’d like to focus on the mining and We’ll explore both through case studies and how our research
minerals industry, where water risks feature prominently process is designed to understand a company’s true water
and can significantly impact business valuations. While many footprint rather than relying on single points of data.
mining firms report water-related metrics and various
service providers attempt to aggregate and standardize the
Equitable water access
data, available information remains incomplete and often
Water access in the metals and mining industry varies signifi-
inconsistent. We believe active investors practicing in-depth
cantly by location. Water access can be a relatively small
fundamental analysis will have a competitive advantage
portion of costs in some areas, but much more significant in
in an environment where such material information is not
areas experiencing water scarcity due to droughts, climate
easily attainable.
change or resource competition. This can lead to not only
Mining and processing raw materials requires large amounts higher prices, but also to production disruptions or—in the
of water and results in a considerable amount of wastewater worst case—a full decommissioning of the mine and material
8 Water disruption: investment risk from multiple anglesasset write-downs. HSBC estimated that if mining companies We also seek information on disruptions due to water short-
had to pay water prices more in line with societal demands ages, disputes with local communities, increasing water
and needs in locations with higher population densities and costs, and related capital expenditures, as well as information
that are exposed to water stress, operating profits would on asset write-downs or penalties and compliance costs.
decline by 9% on average, ranging from 2% to 26%, and net We hope to see a high level of transparency along with a
debt to operating profits would increase by 40% on average, strong management strategy and effective oversight.
ranging from 2% to 102%.11
Though disclosures have been improving, gathering relevant
In water-stressed regions, mines viewed as excessive water information can be a challenging manual task. We attempt
consumers may face conflict or discontent, and many mining to leverage water-related information from external data
companies find it necessary to go beyond regulatory compli- providers, but we find large gaps and inconsistent data even
ance, particularly when government capacity is limited.12 for the most basic statistics. For example, as of June 2020,
To avoid competing with other users, mines may invest in MSCI ESG Manager had water consumption data for only
infrastructure to source water or increase efficiency. Mines 14% of our global equity holdings, and CDP (formerly known
often build desalination and water treatment plants to as the Carbon Disclosure Project) had it for only 19%
supply operations and local communities with clean drinking of our holdings, reflecting the percentage of holdings that
water, which may be a requirement for the approval to respond to CDP’s annual water questionnaire. For the
operate a mine. Operators are sometimes able to use uncon- metals and mining industry, MSCI data feeds did not have
ventional and lower quality water—such as seawater, high consumption data for any companies, while CDP had it for
saline groundwater and wastewater—for various processes. only 25%. However, when reviewing company reports, we
found all of our industry holdings reported this data, albeit not
The water needs of a mining operation can be significant.
always in a consistent and comparable manner.
For example, to produce 1 metric ton of copper concentrate
ready to be refined into metal, a typical copper mine would Challenges in obtaining comparable data for risk assessment
need to mine 154 metric tons of rock and use 65 metric tons underscore the need for more robust reporting standards,
of water, resulting in 114 metric tons of slurry tailings (some such as the Water Accounting Framework (WAF) used by the
of which can be recycled).13 To assess a company’s overall International Council on Mining and Metals (ICMM). The
water access risk, we want to know how much fresh water is ICMM requires members to report to at least one of the
withdrawn and consumed, what portion comes from water- main disclosures systems, for example: CDP Water, CEO Water
stressed regions and alternative water sources, the percent Mandate or Global Reporting Initiative. While these are
recycled/reused, corporate efficiency targets, and any record considered good systems, the ICMM has developed more
of past breaches of permits, standards, and regulations. comprehensive guidelines to help investors understand
the industry’s material water practices, nuances and risks.14
Water access at Anglo American
London-based miner Anglo American plc has high water
access risk, with 75% of sites located in water-stressed areas,
...to produce 1 metric ton according to the World Resources Institute’s Aqueduct tool.
of copper concentrate ready In 2019, restricted water availability due to drought conditions
decreased copper production by 5%, and the firm’s reputation
to be refined into metal, a as an industry leader on ESG issues was impacted by a
lawsuit relating to water shortages at a Colombian coal mine
typical copper mine would in which it owns a minority stake.15 Determined to maintain
leadership in resource stewardship, the company’s ambitious
need to mine 154 metric tons water strategy includes a goal to achieve a 50% net
of rock and use 65 metric reduction in freshwater extraction from 2020 to 2030. It set
a target for a 75% recycling rate for 2020, and water with-
tons of water, resulting in 114 drawals were down 8% in 2019 compared to 2018.16 Some of
its water reduction efforts include technological innovation to
metric tons of slurry tailings.
Water disruption: investment risk from multiple angles 9significantly reduce the amount of mineral ore having to be water from its tailings storage facility when shortages occur.
processed, dry tailings disposal, dry separation, and waterless Given water scarcity in the area, SMM has been providing
processing. A key part of its water strategy is switching to local residents with high-quality drinking water since the
lower quality water to reduce costs and make more water beginning of the plant construction and is working with the
available to communities in which it operates. All of this does local government to evaluate the possibility of installing
not come cheap—costs for water risk mitigation represented water facilities that draw drinking water from nearby rivers.
over 70% of its capital expenditure in 2018.17
Responsible wastewater management
THE NUANCE IS IN THE NUMBERS
Water used in extraction and processing usually contains toxic
Exhibit 4: Comparing Anglo American and Sumitomo Metal
Mining (SMM) water footprints metals and pollutants, which—if not managed properly—
Anglo American SMM can contaminate the environment, potentially resulting in
large fines, cleanup costs and loss of water access rights or
Water consumption (m3) 141,075,000 11,419,000
license to operate. While some of this wastewater can be
Water consumption intensity 4,723 1,423
(m3 / US$1 million sales) purified, the process is often prohibitively expensive, and
CDP water score & A– (Leadership) B (Management) much of the unwanted byproduct ends up in a purpose-built
stewardship level tailings reservoir.18
Water reduction target 50% by 2030 N/A
Tailings are a slurry-like byproduct of extracting minerals and
(6.7% per annum)
metals from mined ore. There are different ways to store
Source: MSCI, CDP. As of September 2020.
tailings that are suitable for different topographies and
climates. The waste in tailings ponds is contained by a dam
Water access at Sumitomo metal mining that must be able to withstand flood risk and seismic activity,
In contrast, Japanese miner and refiner Sumitomo Metal with monitoring and regular maintenance to ensure it
Mining (SMM) has relatively low water access risk and less remains stable. Operations with poor waste treatment prac-
ambitious management targets. The company uses seawater tices and storage facilities could experience catastrophic
for 82% of its water withdrawal needs, and 94% of water failures, resulting in huge cleanup costs, legal damages and
withdrawals are returned to the environment. However, its the potential loss of license to operate. Of the 48% of mining
smelting business uses a large amount of fresh water and companies reporting to CDP, water-related financial losses
includes facilities in the Philippines, where there are water totaled US$11.8 billion over the last five years, in large
shortages in the dry season. To address this, the firm recycles part caused by flooding and severe weather events resulting
in production disruptions, fines and asset write-downs.19
ANATOMY OF TAILINGS
Exhibit 5: Step-by-step process of building a tailing
2 3
1 4
Dam
1. 2. 3. 4.
Rock containing minerals and metals are The mined rock is finely ground Once the desired minerals or metals This slurry can be processed to a
mined from the earth and processed and mixed with water and sometimes are extracted from the finely ground rock, sand-like material and transported to a
to separate the minerals and metals. chemicals to separate minerals fines*, the waste that remains is in dry stack, or pumped in its wet state
and metals. the form of a slurry, known as tailings. into a reservoir with a dam.
Source: Franklin Templeton. For Illustrative Purposes Only. *Fines are solid particles with diameters less than 44 microns and are comprised mostly of clay and silt material.
10 Water disruption: investment risk from multiple anglesWhile tailings dam collapses remain rare, the impact of a MANY TAILINGS DAM FAILURES ARE PREVENTABLE
failure can be catastrophic, as was the case with a tailings Exhibit 7: Causes of tailings dam failures
storage facility at Vale’s Córrego do Feijão mine in 1915–2016
Brumadinho, Brazil, in January 2019. The dam collapsed, 60
releasing 11.7 million cubic meters—roughly a 10-meter 52
50
high wave—of mining waste on the town and surrounding 44
countryside, resulting in over 10 kilometers of destruction,
40
the contamination of the Paraopeba River, 259 people
confirmed dead and 11 missing (as of January 2020).20 Vale’s 30
30 27
stock price fell 24% in response to the disaster, a loss
of US$19 billion in market capitalization. Its debt was down- 20 16 17
15
graded, there were direct costs of over US$5 billion
and the former chief executive officer faces murder charges.21 10 7
1
LOWER-GRADE ORE INCREASES WASTE
Slope instability
Foundation
Structural
Overtopping
Mine subsidence
Seepage
External erosion
Earthquake
Unknown
Exhibit 6: Copper grade, copper metal production and ore
production by decade
1928–2017
M tones of ore processed Copper grade %
40,000 2.0 Source: UNEP and GRID-Arendal 2017, ICOLD 2001, Chambers 2017.
35,000
Slope instability—static failure / 30
30,000 1.5 A constant load that causes deformation, to the point at which a dam partially or
25,000 completely fails. Often caused by partial saturation of areas of the dam that are
designed to remain dry.
20,000 1.0
Foundation—structural and foundation conditions, foundations with insufficient
15,000 investigations / 15
10,000 0.5 Failure related to building the dam on a surface that does not support for the weight
of the dam. An example is a layer of clay under a dam.
5,000
Structural—structural inadequacies, inadequate or failed decants / 16
1928– 1938– 1948– 1958– 1968– 1978– 1988– 1998– 2008– Design errors or failure of a designed component to function as designed. Failed decants
37 47 57 67 77 87 97 07 17 (which drain water from the impoundments) are a common cause.
Copper ore production (LHS) Expon. (Copper ore production) (LHS) Overtopping / 44
Copper metal production (LHS) Expon. (Copper metal production (LHS) Water flowing over the top of a dam. Tailings dams are made of erodible material,
Copper grade (RHS) Expon. (Copper grade (RHS) and overtopping will cause erosion.
Source: World Mine Tailings Failures Organization, as of March 2019.
Mine subsidence / 1
If the dam or impoundment is built above an underground mine, collapse of the
underground mine workings can lead to release of the impoundment tailings.
The risk of dam failures may be increasing. This is partly
due to higher water and waste ratios resulting from the Seepage and internal erosion / 17
Erosion of dam material due to water passing through areas of the dam that are
increased use of lower-grade ore as high-grade ore is used up, designed to remain dry.
as illustrated in Exhibit 6. Climate change is also increasing
External erosion / 7
the risk of dam collapse through more frequent flooding
Simple erosion of a dam face, typically due to precipitation run-off that is not repaired.
and extreme weather events. In our view, tailings dam failures
can be avoided with strong independent oversight and Earthquake—Seismic instability / 27
Dams are designed to withstand earthquakes, but if the earthquake is larger than
strict regulatory enforcement. State-owned companies or that which was anticipated, the structure can be destroyed by the shaking.
mines operating in countries plagued by corruption or limited
Unknown / 52
government capacity may be exposed to greater risk, Many of the older dam failures that were not sufficiently documented may fall into
requiring reliable third-party auditors and extreme vigilance this category.
on the part of investors.
Water disruption: investment risk from multiple angles 11Following the Brumadinho disaster, a group of institutional NEW TOOLS TO UNDERSTAND RISK
investors led by the Church of England and Swedish National Exhibit 8: Global tailings portal data comparing Vale and
Pension Funds (now representing more than US$13 trillion SMM tailings facilities side by side
As of September 2020
assets under management) have written to 726 extractive
Vale SMM
companies seeking information on the management of tailings
storage facilities (“TSF”), as part of the Investor Mining & # Tailings storage facilities 86 45
Tailings Safety Initiative.22 Most of the largest mining compa- # With approved design 82 45
nies responded with disclosures on tailings dams/facilities, # With extreme weather assessment 86 45
details of which have been organized in the Global Tailings # With past stability concern 24 2
Portal, launched in January 2020.23 This free database Total active TSF 41 2
has information on mine tailings dams around the world, and Tailings volume (m3) 1,826,600,000 73,100,000
the next phase of the project will test satellite monitoring and Maximum height (meters) 163 89
aim to increase the number of dams monitored in its data- Tailings intensity 48,476 338,000
(m3 / US$ million sales)
base. The Investor Mining & Tailings Safety Initiative, along
% Tailings with extreme, 91% 0%*
with the ICMM, the United Nations Environment Programme very high, high risk
(UNEP) and the Principles for Responsible Investment
Source: Global Tailings Portal. *Note: TSFs not categorized based on consequence
(PRI) also conducted a global tailings review to create a Global of failure.
Industry Standard on Tailings Management in order to
establish robust requirements for the safer management of incidents with remaining uncertainty around total costs,
both existing and new tailings facilities globally. investors would be prudent to factor in ongoing environmental
damages into their forecasts for Vale. SMM, on the other
Comparing Vale and SMM tailings storage facilities
hand, appears to have relatively low risk of catastrophic fail-
We’ve already begun to use the new Global Tailings Portal to
ures or damages.
understand tailings dam failures and their potential risks
to equity investors. Turning back to SMM for a comparison,
we find that the company has relatively low risk of tailings
In-depth analysis required
dam failures compared to Vale and other companies in more Water issues impacting corporations are first and foremost
flood-prone regions with weaker regulatory controls. SMM’s a matter of community equity and environmental stewardship.
main tailings risk is from earthquakes. The examples explored here are some of the clearest to
explain, but every industry has its nuances when it comes to
The company has no active tailings facilities in Japan, but water. Companies and governments that do not recognize
given its hundreds of years of history, it has many inactive them as such, or cut corners or ignore regulations, bear
sites with large volumes of tailings that require responsible significantly higher risk of value-destructive consequences
oversight and maintenance. All inactive facilities have over a long-term horizon. Companies must prioritize water
been closed for at least 45 years. Following the Great East access and disposal issues when assessing and managing
Japan Earthquake in 2011, the government significantly projects in order to conduct accurate cost analyses and
tightened regulations for tailings storage facilities, and SMM manage associated risks. Water disclosures at the corporate
identified 11 that needed reinforcement against a large- level are improving, but are still inadequate, in our
scale earthquake. Improvements were completed in 2018. assessment, and have not yet been standardized in a widely
accepted scoring methodology. We believe in-depth
By comparison, Vale reports 91% of facilities are categorized
fundamental investors are well-positioned to gauge the true
as high to extreme risk of failure, and 24 facilities have
risks stemming from water issues on a case-by-case
reported past stability concerns. Many of the facilities are also
basis, and to accurately reflect those risks in their company
very high volume, suggesting greater environmental impact
models and investment theses. This ability to uncover and
from any failure. Brazilian authorities have ordered Vale to
assess difficult-to-interpret information can be a meaningful
close several operations, affecting approximately 10% of
source of alpha for active managers.
production. The cause of the recent dam failure was likely due
to deteriorating quality and poor oversight. Given the prior
12 Water disruption: investment risk from multiple anglesGail Counihan
ESG Analyst
Directly engaging to
understand water risk
Franklin Templeton
Fixed Income
We’ll now focus on risk and use fixed income investing as us to understand how the companies we invest in are posi-
our lens. Firms with water intensive business operations and tioned to deal with these risks. In practice, this means that we
those operating in areas of water stress—where water try to understand any mitigation attempts by companies,
withdrawals are high relative to supply—face the risk of having investment into preparing for these risks, best practice within
to pay higher water prices or losing access to water supply. the sector and the realities faced by certain geographies
These risks are likely to rise in the future: water scarcity or sectors.
is rising due to population growth, over-use, and ecosystem
Our first port of call is existing data—disclosures that have
degradation, plus more frequent and severe droughts.
been made that will assist us, metrics that are universally
Where water scarcity has been severe enough to have an oper-
comparable, or processes and frameworks that exist to
ational impact, several bond issuers have had their credit
manage risk. We then use MSCI data for further company
ratings downgraded in the past, as illustrated in Exhibit 9.
specific information, and our final port of call in gathering
Water risk is most severe at the intersection of two variables— data is a short questionnaire that is sent to each company we
lack of investment in resilient infrastructure and occurrence engage with. Our first objective is to learn more about how
of severe drought. Since droughts are outside our control, we these risks are managed, and once we have established a
engage with companies to collect information that will allow good benchmark, we will continue engagement in cases where
we think this risk management can be improved.
WATER SCARCITY’S OPERATIONAL IMPACTS
Exhibit 9: Examples of recent water-related impacts on company bond ratings
As of October 2020
Year Company Event Impact
2013 Barrick Gold One of its mines was ordered to close to ensure the physical and chemical stability of the water sources S&P cut rating to BBB from BBB+
affected by the project.
2017 K&S Lower-than-expected water levels on German rivers disrupted K&S’s operations, leading to higher- S&P cut rating to BB from BB+
than-expected logistics costs.
2018 Multiple Of the 9,000 corporate research updates published between July 2015 and August 2017, 717 involved Update to corporate research
environmental and climate factors. Of these, water factors were an important consideration in
197 cases.*
2019 EDF Forced to cut output from multiple plants due to historically low levels of the Rhine, Rhone and Garonne Output cuts
rivers in 2019 (water required for reactor cooling).
Source: Franklin Templeton based on our research of water-related downgrades. *S&P Global Ratings, COP24 Special Edition: Shining A Light on Climate Finance. December 2018.
Water disruption: investment risk from multiple angles 13Our engagement process
We follow an internal process to identify companies that are at
higher risk of being impacted by water scarcity, as measured
by MSCI. Using water risk as an example, some of the factors
Water is critical to thermal
that we consider in identifying these companies include: and nuclear power
• Water intensity relative to peers generators—which currently
• The portion of company assets in lines of business that are
typically water intensive account for around 60%
• The portion of company assets in geographies that typi-
of power generated in
cally experience moderate to high levels of water stress
• Presence and nature of water-related controversies Europe and over 40%
We then review these companies in more detail, and where we of freshwater withdrawal.
require more information, we will engage the company to
provide us with some extra detail around the following areas:
• Further information around the firm’s approach to esti-
mating water scarcity We recently engaged seven energy utilities operating in the
• Water efficiency targets over the next five to 10 years EU. Here are some of our key findings based on our survey:
• Any initiatives to work with the company’s supply chain
• When it comes to expectations regarding increases or
on water scarcity strategy
decreases in water efficiency, an almost unanimous
• Investment into water efficiency forecast is that the organization is expected to become up
• Targets and investment around recycling levels and to 25% more water efficient. The key driver of this
returning wastewater to the environment safely improvement is an industry-wide movement away from a
• Accountability for management and delivery of water high-water intensity energy (high thermal capacity)
management strategy and KPIs toward less water-intensive renewables. The spending to
achieve improved efficiency is cited as being a defined
To better illustrate our process, we’ll focus on some key percentage budgeted in annual or forecasted research and
findings from recent engagements in Europe with energy utili- development (R&D) budgets—almost half of companies
ties and cement manufactures—two sectors we believe chose this—or “ad hoc” spending.
highlight how water stress is key to valuing and understanding
• With respect to accountability and organization gover-
risk in corporate bonds.
nance, there was consistency among responses.
Energy utilities All the companies have an executive committee member
A typical power company is a large user of water—most are responsible for management and delivery of water
cooled by river water—but a negligible consumer, as much management strategy and oversight of water KPIs.
of the water is returned to the source after it is used and In terms of the KPIs that are tracked, there was divergence
treated. Most of the loss, or consumption, occurs through in responses—ranging from baseline KPIs such as
steam. Water is critical to thermal and nuclear power genera- those that are obtained from a water supplier, to more
tors—which currently account for around 60% of power granular metrics such as recycling rate, consumption
generated in Europe and over 40% of freshwater withdrawal.24 and discharge by source, water use in megaliters per
Global withdrawals are expected to increase 20% by 2040.25 gigawatt hour (ML/GWh), and water use/overall sales—
Given the high withdrawal rates, if the source is a static the latter providing investors with the most easily compa-
body or a river, there is a risk that the company will be denied rable metrics from one company to the next. We will
access in times of drought. continue engagement where required in order to source
these comparable metrics.
14 Water disruption: investment risk from multiple angles• Water recycling is not cited consistently as a target, and electricity producers. A mitigating action here is conversion to
where it is pursued, we observed only marginal savings in a mostly renewable generation base, and in this light we can
thermal processes. For example, the installation of a view decreasing water risk as an unintended consequence
system for the recovery and use of rainwater at a thermal of the European Emissions Trading System (EU ETS)—
power plant may be expected to save 2% in annual the scheme provides economic incentive for utilities to move
withdrawals or treating wastewater from power plants and toward less water-intensive power generation, thus decreasing
might result in a 1% saving. It is useful to compare their water risk.
these marginal improvements to the fundamentally
Cement
lower water intensity that is associated with renewable
Next we’ll focus on cement production—also an activity
power generation.
covered by the EU ETS. Not only because it is the most used
Overall, we were encouraged by the granularity and oversight construction material in the world—you’ll find it on every
of water risk in our respondents. We will continue engagement continent and in every market from frontier to developed—but
with some issuers where we think disclosure and internal also with global growth, concrete production is increasing
processes can be improved. substantially and is projected to grow more. The industry has
made strides to measure energy consumption and CO2
EU ETS—boosting climate resilience of energy infrastructure
emissions but has lagged on understanding and reporting on
Across Europe, the frequency of extreme weather has been on
its water footprint. As seen in Exhibit 10, a 2018 report
the rise—ranging from falling river levels to an increased
from the International Energy Agency (IEA) and the World
number of droughts or heat waves. Warmer temperatures are
Business Council for Sustainable Development (WBCSD)
fueling peak demand loads on the continent’s energy grid, and
Cement Sustainability Initiative (CSI) projects cement produc-
the requirement for cooling water in thermo-electric power
tion to increase 12%–23% globally. Of that growth, 75% is
plants is an important climate risk that is growing for
projected to occur in water-stressed regions.26
PROJECTING CEMENT THROUGH 2050
Exhibit 10: Cement production by region projected through 2050, with world high- and low-variable projections (in megatons/year)
As of 2018
Mt cement/yr
6,000
5,000
4,000
3,000
2,000
1,000
2014 2020 2025 2030 2035 2040 2045 2050
China India Other Asia Pacific America Europe Eurasia Middle East Africa
World high-variability case World low-variability case
Source: IEA, WBCSD, CSI, 2018. Base year cement production data 2014 Minerals Yearbook: Cement, United States Geological Survey data release, 2016. There is no assurance that
any estimate, forecast or projection will be realized.
Water disruption: investment risk from multiple angles 15Having a clearly articulated water management strategy in place,
having a view of the extent to which operations will become
more efficient over the short to medium term, and working
directly with suppliers to understand their water strategy
together form the baseline of good operational management.
As we did with energy utilities, we created a direct engage- • There was consistency across the board with respect to
ment process and survey with three of the larger European accountability for water management and efficiency
cement manufacturers. The feedback received has helped us programs—this is something that has become standard
to start building a picture of what good forecasting and practice rather than indicative of strong governance. While
operational management looks like. we think the level of risk management and oversight
in our respondents varied widely, we also think the base-
• When it came to understanding water sources, responses
line level of oversight was stronger than global peers,
that were common included leveraging more than one
due to regulation in the European region.
source of water availability assessment tools—such as the
GEMI Local Water Tool, Aqueduct or the Water Risk Active engagement helps us gather information that improves
Atlas. Having a clearly articulated water management our understanding of how companies are managing these
strategy in place, having a view of the extent to which evolving risks. With varying disclosure requirements globally, it
operations will become more efficient over the short to is still challenging to compare companies across regions,
medium term, and working directly with suppliers to under- and some of our next steps in our cement engagement will
stand their water strategy together form the baseline of include establishing a real-world baseline and sourcing
good operational management. comparable and up-to-date data.
• Regarding investment, there is no clear trend with regard
to spending to achieve greater efficiency. Approaches Complexity necessitates engagement
ranged from ad hoc spending to the investment being a These engagement examples are just scratching the surface,
defined percentage of the R&D budget—the latter would and we immediately saw the need for further engagement.
ordinarily be associated with a dedicated strategy to Additionally, analysis of results from multiple data sources
target water efficiency and would represent the best prac- combined with company responses is quite complex. The lack
tice among responses. of standardization not only within sectors, but also across
• With respect to KPIs for recycling and returned wastewater, sectors, enhances the complexity. It is important for us to
we couldn’t obtain a clear picture of best practice. Metrics understand these complexities and continue to engage
were either reported as absolute numbers or percent- companies to move toward standardization and a better base-
ages—rendering both as non-comparable. This will be an line. The time to do this is now—complexity will only
area that we continue to engage on. An internal price grow with the growing demand and competition for water.
for water is something that is being used by most of our
respondents—an indicator of good water governance.
16 Water disruption: investment risk from multiple anglesGreg Danielian
Research Analyst
The future is here:
municipal bond risk and
Franklin Templeton
Fixed Income
a shrinking river
Climate change is often discussed as something occurring in a Since the megadrought began in the late 1990s, available
distant future—an event we have time to prepare for and water supply in the river has declined over 15%, and due
perhaps even prevent if we course correct. The future is to climate change the river is projected to experience between
already here in western North America. Over the last two 20%–30% less flow by 2050 and 35%–55% less by 2100.30
decades, climate change and a megadrought have wrought Based on 2014 dollars and economic activity, those reduc-
havoc on the region’s most vital water supply, the Colorado tions would cut economic production and labor income in the
River. As municipal bond (“muni bond”) investors in utilities, region by over US$576 billion and US$1.1 trillion respectively,
we are watching these events unfold while we continue to as seen in Exhibit 11. Just over half of the economic loss
monitor municipal bond opportunities in the region. We will occur in California, the fifth largest economy in the world.
believe muni bond investors play an important role in
providing capital to these utilities in funding their capital EVERY DROP COUNTS
needs to promote a reliable water supply in the face of Exhibit 11: Extrapolated estimates of total economic impacts
mounting water supply stress. of different amounts of Colorado River water loss for the entire
basin region
Often referred to as the “World’s Hardest Working River”— Percent decline in Gross state Employment Labor income
availability of product Millions job $Billions 2014
each drop of water is used 17 times in its journey from the Colorado River water $Billions 2014 in years
headwaters to the terminus—the Colorado River in the United
10% 143.4 1.6 87.1
States provides municipal water to over 40 million people, irri-
15% 215.1 2.4 130.7
gates over 5.5 million acres of agricultural land, and generates
25% 358.5 4.0 217.9
over US$1.4 trillion in annual GDP and 16 million jobs.27 The
50% 717.1 8.0 435.7
total economic impact of the river is higher, but not as well
documented, when you include México’s 1.5 million acre feet Source: James, et al., The Economic Importance of the Colorado River to the Basin Region.
Tempe: Arizona State University, December 18, 2014. There is no assurance that any
(MAF)28 allocation irrigating over US$2.9 billion of crops in estimate, forecast or projection will be realized.
the Mexicali Valley and supporting the Mexicali region’s glob-
ally linked US$2.4 billion manufacturing economy.29
Water disruption: investment risk from multiple angles 17The Lower Colorado River Basin, which is made up of US in the near to medium term. However, near-term investing
states Arizona, California and Nevada, along with the country can’t ignore long-term impact and, as discussed in the intro-
of México, is experiencing the full brunt of shrinking water duction to this piece, we have a fiduciary responsibility to
supplies. The region is the lab for dealing with the impacts of our clients’ assets to understand these risks and how they will
climate change in real time—so much so that the Lower Basin grow over time. As active managers, holistically understanding
has a doomsday clock, of sorts. However, the “clock” does not the risks allows us to both take advantage of gaps in informa-
measure time, but rather the level of Lake Mead, the largest tion by more appropriately pricing risk and to move out of
storage reservoir in the Lower Basin. And, instead of striking positions that are deteriorating in credit quality either from a
midnight, the magical number is 1,075 feet. This spot marks supply risk standpoint or a financial standpoint.
the water level of Lake Mead at which there will be an auto-
matic shortage declaration. You’re probably wondering, what is When the clock strikes 1,075 feet
a shortage declaration and who is impacted? How close could
As seen in Exhibit 12, which indicates the level of the lake on
it be? And, what are the chances of it occurring? Finally, you
December 31, 2019, the water level was at 1,090 feet.
may be wondering what this all has to do with muni bonds and
That is pretty good compared to recent history. As recently
what are we doing as muni bond investors to understand the
as 2018, the lake hovered within inches of 1,075 feet.
implications. We’ll quickly explain them one by one.
In 2015, the lake dipped below the level for several months—
First, it is important that we point out that we don’t expect hitting a historical low of 1,071 feet—but creeped back
the Colorado River water supply to impact major water utilities over the line when the final measurement of the water year
was recorded.31
THE COLORADO RIVER’S DOOMSDAY CLOCK
Exhibit 12: Mean end-of-December elevation of Lake Mead and August 2020 CRSS
As of August 2020
Elevation (feet msl)
1,250 Surplus condition
1,225
1,200 Adoption of the Adoption of the
2007 Interim Guidelines Drought Contingency Plan
1,175
1,150
Normal or ICS surplus condition
1,125
1,100
1,075 Level 1 shortage condition
1,050 Level 2 shortage condition
1,025 Level 3 shortage condition
2000 2005 2010 2015 2020 2025
Historical and median projected pool elevation 10th to 90th percentile of full range
Historical elevation Full hydrology Stress test hydrology Full hydrology Stress test hydrology
Source: US Bureau of Reclamation, as of August 2020. There is no assurance that any estimate, forecast or projection will be realized. Note: The colored region, or cloud, for each
alternative hydrology scenario represents the 10th to 90th percentile range of the projected reservoir elevations. Solid lines represent historical elevations (black), and median projected
elevations for each alternative hydrology scenario (teal, yellow). Dashed gray lines represent important elevations for operations, and vertical lines mark the adoption of the 2007
Interim Guidelines and 2019 Drought Contingency Plans that lay out cuts in water deliveries to Arizona, California, and Nevada when elevations are reached. The method used to
generate future inflows in the current projections includes resampling the historical natural flow record (1906-2018) using the Index Sequential Method (ISM), referred to here as “Full”
hydrology. One alternative to the Full hydrology scenario applies ISM to a shortened period of the natural flow record, 1988-2018, and is referred to as “Stress Test” hydrology.
The Stress Test hydrology scenario removes the earlier portion of the natural flow record and focuses on the recent (approximately 30 years) hydrology, which has a 11% drier average
flow than the Full hydrology. Use of the Stress Test scenario is supported by multiple research studies that identified a shifting temperature trend in the Colorado River Basin in the late
1980s that affected runoff efficiency and resulted in lower average flows for the same amount of precipitation (McCabe et al. 2017, Udall and Overpeck 2017, Woodhouse et al. 2016).
18 Water disruption: investment risk from multiple anglesYou can also read