2018 Real Estate Outlook - The Australian Perspective February 2018 - Active Consulting
←
→
Page content transcription
If your browser does not render page correctly, please read the page content below

2018 Real Estate Outlook
The Australian Perspective
February 2018

Executive summary

Things look positive in 2018 for the real estate and construction
industries. Although the uncertainty of previous years has not
entirely gone – and some markets won’t be as buoyant as they
have been – on the whole the road ahead looks more settled
and business like. It will however be a very busy year on the
implementation front.

Multiple variables that impact the sector are beginning to
settle, and as the complex ecosystem of third parties as
well as regulatory requirements expands, there continues
to be new frontiers and structural changes to manage.

In the following pages of this Outlook, we discuss these frontiers
and changes, and look forward to discussing how the trends we
outline apply to your business.

Alex Collinson
National Lead Partner

Real Estate and Construction
Deloitte Australia

Contents
  Market and investment
   Macroeconomic backdrop                                        03
   Outlook investment trends                                     07
   A-REITS – Reflection on value                                 11
   Development in Western Sydney                                 14

  Technology
   Why should companies focus on real estate fintech startups?   18
   Cyber in real estate                                          21
   Embrace robotics and cognitive automation                     23
   Digital finance – The new superhero                           26

  People
   Reimagine talent and culture                                  30

  The last word
   Scenario – What if?                                           37

                                                                      02
2018 Real Estate Outlook |
                          Market and investment

Macroeconomic backdrop
Australia has chalked up its 26th                                               The good news for Australia is that global                                                Australia remains at the
consecutive year of economic growth,                                            economic growth has picked up during 2017,
and the clouds around Australia’s economy                                       much of that driven by Asian economies,                                                   upper end of developed
are clearing. Commodity prices have firmed                                      and in recent months that has translated                                                  economies for projected
up and the slowdown in mining investment                                        into much stronger employment growth
growth is now mostly in the rear view                                           in Australia. That growth should also lift                                                growth, supported by
mirror. Mine approvals came to a halt a                                         demand for capital, boosting the outlook                                                  population growth and
while ago, but it wasn’t until 2017 that the                                    for business investment.
already approved projects were completed.                                                                                                                                 linkages to Asia, but
Chart 1 – Expected GDP growth of major economies, average annual growth                                                                                                   constrained by high
across 2017 and 2018 (forecast)                                                                                                                                           household debt.
                  South Asia

                                        East Asia and Pacific

9%
         India

8%
                               China

7%

6%
                                                                               New Zealand

5%
                                                                                             United States
                                                                   Australia

                                                                                                                                           United Kingdom
                                                                                                             South Africa

4%
                                                                                                                               Euro area

3%
                                                                                                                                                            Japan

2%

1%

0%

But global growth is yet to translate to                                        While the general consensus is that the
inflation. While there are encouraging                                          next move for Australian rates will be
signs of global inflation emerging, the                                         up, we expect no upward movements
outlook is for official Australian interest                                     in Australian interest rates until late in
rates to stay near record lows until late in                                    2018 or early in 2019.
2018 or early in 2019, a blessing for real
estate markets, especially so in NSW and
Victoria and the ACT.

Chart 2 – Australian interest rates, 90 day bank bill

10%

8%

6%

4%

2%

0%
      Dec 2000    Jun 2003         Dec 2005                     Jun 2008       Dec 2010                 Jun 2013            Dec 2015       Jun 2018            Dec 2020

03
2018 Real Estate Outlook |
                                                                                                                                     Market and investment

Having said that, the Royal Commission                      Outlook for the residential segment
                                                                                                           Household debt has
into the banking industry may                               The current residential property upswing
raise the effective cost of borrowing                       has seen strong price inflation, up around     escalated with house prices
as banks are likely to respond by                           47% across capital cities since December
                                                                                                           – Australia’s household debt
continuing to limit lending to risky                        2012 (around the beginning of the current
initiatives, including some property                        upswing nationally). Chart 3 shows that        to income ratio is now the
development and foreign borrowers.                          price growth has been uneven across the
                                                                                                           second highest in the world,
                                                            states, pulled along by the Sydney and
                                                            Melbourne markets.                             behind only Switzerland.
Chart 3 – Change in nominal house values, Dec 2011 – Sept 2017 (per cent)
80%
70%
60%
50%
40%
30%
20%
10%
0%
-10%
            Sydney     Melbourne Brisbane          Adelaide     Perth      Hobart     Darwin    Canberra

Source: ABS Cat.6416

In 2017, house prices fell in Perth and                     Household debt has escalated with
Darwin, linked to population movements                      house prices – Australia’s household
and employment opportunities. Slower                        debt to income ratio is now the second
price growth in the Brisbane market also                    highest in the world, behind only the
likely reflects low employment growth                       Swiss. And while growth in debt has
as well as the risks of oversupply in the                   been most pronounced for higher
apartment segment, but this may have                        income households, higher debt adds
bottomed out now.                                           to the economy’s vulnerability in the face
                                                            of a shock, and could also lead to lower
                                                            future growth (IMF 2017).1

Chart 4 – Housing debt to income

160.0
140.0
120.0
100.0
 80.0
 60.0
 40.0
 20.0
  0.0
         Jun        Jun        Jun        Jun        Jun       Jun       Jun    Jun       Jun      Jun
        1990       1993       1996       1999       2002      2005      2008   2011      2014     2017

Source: Reserve Bank of Australia

Regulators aiming to restrain increasing                    volume of ‘interest only’ loans to total
property debt amid concerns of an                           new residential mortgages, have pushed
overheating market have targeted                            up rates for investors. Market activity has
investor lending. Tighter lending                           begun cooling with house price growth
standards and restrictions on the                           slowing in the latter half of 2017.

1. IMF, 2017, Global Financial Stability Report, October.
                                                                                                                                                         04
2018 Real Estate Outlook |
                          Market and investment

Despite the vulnerabilities, the residential         Outlook for the commercial segment              •• A shift in focus to rental income growth
market generally continues to be buoyed              Demand for new office space is largely             for value appreciation given cap rates are
by other fundamentals. Underlying                    determined by white-collar employment              near historical lows and further tightening
demand remains solid with strong (albeit             growth. The standout performers in                 potential probably limited.
uneven) population growth expected to                2017 were the Melbourne and Sydney
                                                                                                     •• Although some firms are now
continue into 2020, and jobs growth has              CBD markets. Melbourne has seen
                                                                                                        discouraging remote working, in general
been strong, especially in Victoria.                 particularly strong growth, while Brisbane
                                                                                                        the trend toward flexible working
                                                     is gradually catching up to its east coast
Chart 5: Average population growth,                                                                     arrangements is becoming more
                                                     competitors after an extended period of
past five years and across 2017-18                                                                      mainstream and as a result there’s likely to
                                                     weakness. Overall office vacancy rates
and 2018-19                                                                                             be ongoing consolidation of office space
                                                     have continued to fall, due to positive net
                                                                                                        requirements by large space users.
                                                     demand in CBD markets and withdrawals
               VIC

2.50
                                                     in non-CBD markets.                             Outlook for the industrial segment
                     QLD
         NSW

2.00
                                 WA

                                                                                                     The outlook for industrial space demand
1.50                                                 The outlook for white collar employment
                                                NT

                                                                                                     is dependent on what is happening across
1.00                                                 over the next few years is a positive news
                           SA

                                                                                                     a range of sectors that drive demand for
                                       TAS

0.50                                                 story – job growth is increasingly being        industrial space. Renewed global growth
0.00                                                 driven by service-based sectors, with           and the easing of inflationary risks (and
       Average population growth past 5 years        health care by far the front runner, and        thus the delay in expected timing of interest
       Average population growth 2018-2019
                                                     with professional services and education        rates) has been good news for a number of
                                                     also expected to generate jobs.                 these sectors, and will likely buoy demand
And the outlook for construction activity            Commercial construction has been                for Australian industrial property.
in the near term varies across the states:           a relatively disappointing part of the          •• It has reduced the risk for wholesalers
•• For both NSW and Victoria, growth in              Australian economic story over the past            and retailers that sagging housing
   housing construction has slowed from              few years – it was initially hoped that            prices could pose problems before
   its peaks but remains at high levels and          construction could fill some of the hole left      wage growth improves to provide
   is underpinned by strong underlying               by the mining construction ‘cliff’ (after the      a rising tide for the sector.
   demand. In Victoria, population growth            first phase of the China boom), but it didn’t
                                                                                                     •• 2017 has seen reasonable gains in
   is containing risks of oversupply.                pan out that way.
                                                                                                        engineering activity in NSW, Victoria and
•• Housing construction fell in QLD over             That looks set to change in 2018, with             Queensland, as work continues on a
   2017, having reached its peak in mid-             commercial construction set to grow over           number of large infrastructure projects.
   2016. Despite population growth edging            the year. Building approvals have picked up        We expect engineering construction
   higher, housing construction is likely to         since mid-2016, supported by strength in           to stop detracting from the economy’s
   remain relatively flat in the near term.          the office, and education sectors.                 overall growth and become a more
   Similarly for SA, the housing construction                                                           neutral contributor in the near term.
                                                     In total, there are $20 billion worth of
   outlook is also relatively flat, because
                                                     office projects under construction across       •• Transport investment continues to go
   while approvals have picked up in late
                                                     Australia in late 2017, the largest of which       from strength to strength, with more than
   2017, population growth projections
                                                     is the $6 billion Barangaroo development.          $95 billion worth of transport and storage
   remain weak.
                                                     There are a further $8 billion worth of            projects underway in the latter half of
•• WA’s housing construction has seen a              projects yet to kick off.                          2017 and $140 billion worth of projects in
   large downturn in recent years (including                                                            planning. Much of that activity is focused
                                                     Likely trends for commercial property over
   a large fall in 2017), but looks to be                                                               in the nation’s east and south.
                                                     the near term include:
   stabilising, with building approvals and
                                                     •• Constrained supply in the Sydney and         •• Conditions have improved for
   loan approvals steadying.
                                                        Melbourne markets provide a positive            manufacturing supported by an increase
Taken together with the outlook for                                                                     in public sector infrastructure spending,
                                                        outlook for rental growth. The Perth and
interest rates, slowing house price growth                                                              improved global growth and an Australian
                                                        Brisbane markets have likely bottomed
(moderating the prospect of further capital                                                             dollar that, despite gaining ground in
                                                        out, with the economic and property
gains), restrictions on lending (such as on                                                             2017, is still below the peaks of mid-2014.
                                                        outlook improving.
interest only loans and loans to investors,                                                             However, higher energy costs are weighing
as well as lending to foreign investors); we                                                            on profitability for manufacturers and
expect the current upswing to peter out                                                                 could affect investment prospects. That
and enter a period of moderation rather                                                                 said, $18 billion worth of manufacturing
than an abrupt adjustment.                                                                              investment projects are in various stages
                                                                                                        of planning as at late 2017.

05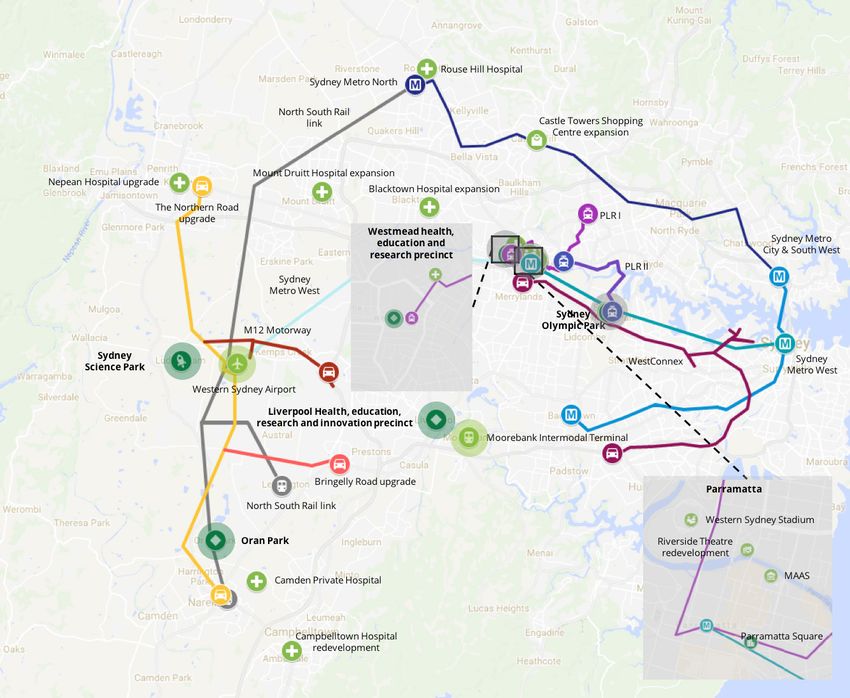
2018 Real Estate Outlook |
                                                                                                                            Market and investment

Likely trends for industrial property over       But forward indicators are suggesting a          Likely trends for retail property over
the near term include:                           good basis for spending to lift in 2018,         the near term include:
•• Industrial property is a tightly held         including:
                                                                                                  •• High levels of demand for centre space
   market, and there are pockets of              •• Strengthening employment outcomes
                                                                                                     are set to continue in the near term –
   supply constraints – strong continued
                                                 •• An improving outlook for wages growth            with growth in food and hospitality uses
   capital growth is expected in the
                                                                                                     and smaller footprints for many larger
   near term, buoyed by the national             •• Low cost of borrowing
                                                                                                     format retailers.
   infrastructure rollout.
                                                 •• Continued (albeit slowing) wealth gains
                                                                                                  •• There may be the potential for further
•• The trend of urban regeneration seen             from housing.
                                                                                                     yield compression in the near term,
   in recent years, with industrial land         The value of building approvals fell slightly       concentrated at the prime/super regional
   converted to mixed use for residential        in the year to September 2017, ending a             end of the spectrum. This is likely to be
   purposes, is expected to continue. This is    run of impressive gains. In terms of project        driven by the low frequency that these
   especially true of Melbourne and Sydney       activity, there are more than $5 billion worth      assets are offered to market and weight
   where jobs growth is expected to be           of retail projects under construction, as           of capital in the sector.
   concentrated in the CBD.                      well as a further $6 billion in the various
                                                 planning stages (Deloitte Access Economics’      •• The impact of online retailing to
•• Further growth in foreign investor
                                                 Investment Monitor, December 2017).                 continue to test the sector – given the
   participation in the market is expected
                                                                                                     relatively current low rate of penetration
   to emerge as market sophistication and        Key risks to the sector include the effect          in Australia and Amazon opening its
   maturity evolves.                             of Amazon’s recent entry and slowing                doors locally!
•• Yields will eventually be pressured by        growth in household wealth. We will get
                                                                                                  Risks
   a rising global and local cost of capital,    a better idea of the impact of Amazon’s
                                                                                                  There are risks to the outlook for Australian
   but that doesn’t loom as a major risk for     entry on bricks and mortar retailers in
                                                                                                  property: part of today’s good news
   2018. Yields may remain relatively stable     coming months – and therefore demand
                                                                                                  is also bad news. Thanks to renewed
   in the coming calendar year, with some        for retail floor space. But the results of a
                                                                                                  stimulus, Chinese construction activity
   opportunity for further compression in        recent survey suggests that retailers are
                                                                                                  has picked up again. But much of that
   select markets.                               not overly alarmed by Amazon’s entry to
                                                                                                  money is supporting the worst performing
                                                 the Australian market (Deloitte’s Retailer’s
Outlook for the retail segment                                                                    State Owned Enterprises (SOEs), thereby
                                                 Christmas Survey 2017). While a third of
Retail spending is becoming more uniform                                                          increasing China’s vulnerability to a sharp
                                                 respondents believed Amazon would have
across the states as retail spending growth                                                       adjustment as the economy transitions.
                                                 a negative impact on their business, 40%
slows in the previously robust eastern states                                                     That’s also true for Australian rates. We’ve
                                                 believed it would benefit them. Continuing
(Deloitte Access Economics’ Retail Forecasts,                                                     used lower interest rates to ward off risks
                                                 a tone of confidence, looking forward to
December 2017). While the resource states                                                         of recent years, boosting property prices,
                                                 2018, 51% of respondents expected to
are still facing challenges, particularly                                                         and household debt along the way.
                                                 grow their earnings by more than 5% next
in Western Australia and the Northern            year (down from 2016 expectations, where         While the most likely path for the Australian
Territory, Queensland is less pressured.         60% believed this would be the case).            economy doesn’t see a triggering of those
Annual retail spending growth in New South                                                        new risks (China and/or housing), they’re
Wales and Victoria has slowed significantly      Despite challenges and disruption in
                                                                                                  both plausible and relevant risks and
in the latter half of 2017, towards the          the sector, demand for retail space within
                                                                                                  worthwhile exploring further.
more modest growth seen in the slower            the Australian market remains solid, in
population growth jurisdictions of South         part due to the number of new large-             In a later chapter we present our China
Australia and Tasmania. The ACT is also          scale international entrants setting up          Stumbles scenario, and step through
witnessing a significant retail slowdown after   operations in Australia.                         how scenarios can be used for strategic
a strong period.                                                                                  planning for our model REIT.

Kristian Kolding leads the Deloitte Access Economic macroeconomic forecasting and policy team in Sydney. Kristian is co-author
of Deloitte’s flagship series, Building the Lucky Country, that consider future profitability models for the nation. Working closely with
Deloitte Access Economics, Chris Richardson, Kristian also forecasts the effect of policy changes on the economy.

Anthony Moeller leads the real estate advisory area of the Financial Advisory group in Sydney and is a leading provider of strategic
property advice to government and the private sector underpinned by his close working relationship with the Deloitte Access
Economics team. Anthony has 25 years’ experience in a number of leading developers, fund managers and advisory groups.

                                                                                                                                                06
2018 Real Estate Outlook |
                          Market and investment

                                                    Outlook investment trends
                                                    Future investment models such as build to rent and capital flows.

Although often used                                 Build to rent                                             Research suggests similar yields could
                                                    ‘Build-to-Rent’ or ‘Multifamily’ as it is                 be achieved in the Australian market,
synonymously in the media,                          known in the US, is the terminology                       making the sector increasingly attractive
it is important to make the                         used to describe institutional rental                     to investors as domestic commercial yields
                                                    accommodation where the whole                             continue to compress to comparable levels.
distinction between ‘build to                       development is owned and operated
                                                                                                              The lower yields on residential build-to-
rent’ and ‘affordable housing’,                     by developers or groups of investors.
                                                                                                              rent by comparison to commercial assets,
as build to rent can include                        Despite being relatively new to Australia,                have generally being offset by a strong
                                                    the concept of build-to-rent is well                      capital growth profile and diversification of
a range of product types at                         established globally; measuring $A319bn                   risk across the property lifecycle.
different price points, but                         in total, of which $A106bn is in the
                                                                                                              Residential build to rent has typically
                                                    United States. For the 11 markets where
does not necessarily relate                         MSCI measures residential real estate,
                                                                                                              become prevalent in markets with falling
                                                                                                              affordability, higher population growth
to low-cost/government-                             annualised income returns range from
                                                                                                              and constrained supply – all factors which
                                                    3.3% (UK) to 5.7% (Canada) over the past
subsidised rental housing.                          14 years, with the US sitting in the top half
                                                                                                              are applicable to the current Australian
                                                                                                              property climate.
                                                    of the pack, averaging 5.2%.2

                                                    2. Property Council of Australia and MSCI - Australian Property Still Performing Strongly, while Build-to-rent
                                                    has Proven itself Globally
                                                    https://www.propertycouncil.com.au/Web/News/Articles/News_listing/Web/Content/Media_Release/
                                                    National/2017/Australian_property_still_performing_strongly__build-to-rent_has_proven_itself_globally.aspx

07
2018 Real Estate Outlook |
                                                                                                                                   Market and investment

However, domestically there are a number                Capital flows                                    Foreign nationals are
of government policies and taxes which                  Foreign capital continues to play a key role
make the build to rent model prohibitive.               in driving Australia’s economic growth.          not permitted to buy an
In the traditional build-to-sell model, GST             The latest Australia Bureau of Statistics        established residential
is recouped at the time the product is sold,            data highlights the total level of foreign
whereas this mechanism does not exist for               investment in Australia (including real estate   dwelling in Australia,
build to rent. Land tax can also be a financial         and non-real estate sectors) increased by        however they are allowed
barrier, where the total land value of the              $153.3bn (5%) to reach $3,192.4bn for the
development is attributed to one owner,                 year ended 31 December 2016. Overall             to purchase off the plan or
rather than distributed across multiple                 the United States continues be the biggest       newly constructed buildings
owners in a strata scheme, and is therefore             source of foreign investment at $860.9bn,
more likely to exceed the land tax threshold.           representing 27% of the total foreign            and rent, sell or live in them.
                                                        investment market (Chart 1).
That said however, with its demonstrated
success overseas, the build-to-rent model               For the third consecutive year China             This means that foreign
is beginning to gain momentum in Australia.             represents the lion’s share of foreign real      investors are more active
This is driven in part by interest from                 estate approvals, by both value and number.
offshore capital sources, which are generally           Investment from China represents 26% of          in certain sectors of the
more familiar with the concept.                         the total value of approvals and a growth        residential property market,
                                                        of 31% since 2014-2015,3 according to the
The popularity of the sector will largely
                                                        Foreign Investment Review Board (FIRB).          for instance large scale
depend on whether commercial yields
continue to compress to residential levels              It is important to note that FIRB approvals      apartment developments,
and whether build to rent will remain a                 data does have significant limitations,          which are concentrated
competitive alternative. With the RBA cash              the most important being that approvals
rate remaining at a historic low of 1.5% and            do not represent actual purchases,               predominately in inner
Deloitte Access Economics anticipating the              but rather provide an indication of the          Melbourne and Sydney and
cash rate will be on hold until well into 2018,         planned future investment. As much
the outlook does looks positive.                        of the FIRB data is measured by value,           to a lesser extent, Brisbane.
                                                        significant one-off proposed transactions
                                                        can distort the figures.

Chart 1 – The billion dollar levels, by leading countries, of the total foreign
                                                                                                          According to the ABS, the leading investor
investment in Australia for year end 31 December 2016                                                     countries for the year ended 31 December
                                                                                                          2016 were:
1000                                                                                                      •• United States of America $860.9b (27%)
800                                                                                                       •• United Kingdom $515.5b (16%)
600                                                                                                       •• Belgium $270.1b (9%)
400
                                                                                                          •• Japan $213.5b (7%)
200
                                                                                                          •• Hong Kong (SAR of China) $100.9b (3%)
0
                                                                                                          •• Singapore $98.9b (3%).
                  USA              UK           Belgium           Japan      Hong Kong      Singapore
                                                                           (SAR of China)

Source: ABS

3. FIRB Annual Report 2015-2016 (for the year ending June 2016)

                                                                                                                                                       08
2018 Real Estate Outlook |
                          Market and investment

Victoria has the market share of foreign investment at a state level, representing                        Australia’s appeal
44% of the total number of foreign investment real estate approvals (Chart 2).                            Australia’s supportive macro-economic
The FIRB’s report notes that three-quarters of all residential real estate approvals                      environment and robust real estate
were for purchases in Victoria and New South Wales. This is consistent with recent                        fundamentals are attractive to foreign
years and reflects strong demand for residential property in Sydney and Melbourne.                        investors chasing yield and the opportunity
                                                                                                          to fill a local credit market gap.
Chart 2 – Number of approvals by state and territory
                                                                                                          Banks dominate the Australian real estate
                                                                                                          development debt market. However, they
                                                VIC                       44%
                                                                                                          are actively reducing their exposure ($216bn)
                                                NSW                       32%
                                                                                                          to commercial real estate lending, leaving
                                                QLD                       17%                             many developers struggling to obtain
                                                WA                         4%                             alternative funding.

                                                SA                         2%                             The banks represent more than 90% of
                                                ACT                        1%                             the market, mortgage funds are minimal
                                                                                                          and private debt is inadequate, creating
                                                TAS                        0%
                                                                                                          a significant dislocation in the real estate
                                                NT                         0%                             debt market. This gap in the market and
                                                                                                          lack of competition presents an immediate
Source: FIRB                                                                                              opportunity for a large pool of capital to
                                                                                                          capture the growing level of demand for
The residential real estate sector represented the largest share of foreign investment                    development debt.
value (29%) for the financial year ending June 2016, according to FIRB data (Chart 3)                     Provided the underlying asset class is sound,
Chart 3 – Share of total approvals by industry sector in 2015-16, by value                                then the current lending environment is
                                                                                                          providing abnormally high returns, particularly
                                                Residential real estate                           29%     in a low interest rate environment. The window
                                                Manufacturing electricity and gas                 23%     of opportunity for these returns is anticipated
                                                                                                          to be 24-36 months, before more normalised
                                                Commercial real estate                            20%
                                                                                                          capital flows return to the sector.
                                                Minerals exploration and development              11%
                                                                                                          The most dramatic change in active debt
                                                Services                                          9%
                                                                                                          lenders is the mortgage fund sector. The
                                                Finance and insurance                             6%      GFC saw the demise for mortgage funds
                                                Agricultural forestry and fishing                 2%      in Australia, which effectively became the
                                                                                                          ‘shadow banking’ sector of the debt market.
                                                Tourism                                           0%
                                                                                                          At its peak the mortgage fund sector had
                                                                                                          FUM of $18 billion. Today the mortgage trust
Note: Totals may not add due to rounding, Corporate reorganisations are excluded (99 in 2015-16           sector is estimated to have FUM $2 billion.
Source: FIRB)

Chart 4 – There has been a dramatic reduction in competition of active real estate debt lenders since the Global Financial Crisis:

Active lenders             Major banks          Regional banks             Mortgage funds               CMBS       Private/family office              Total
2008                                 4                      12                         60                  4                           4                84
2016                                 4                       4                          6                  1                          10                25

However Australia’s mature and                            The regulatory environment, lack of political        movements results in Chinese investors
comparatively stable financial markets and                and economic freedom and conditions in               reconsidering what and where they can
well-regulated land title system does appeal              the Chinese economy, make foreign markets            afford to purchase, with the Australian real
to foreign investors. Similar markets such                particularly attractive to Chinese investors.        estate market looking increasingly attractive.
as New Zealand and Canada have likewise                   In 2016, the Chinese currency depreciated            Australia’s gross rental yields of 4-5% in
become havens for global capital in recent                nearly 5% against the US dollar, while               major cities are twice that of China’s major
years, particularly for Chinese investors.                appreciating against the Australian dollar           cities (Chart 5).
                                                          by nearly 12%. The impact of such currency

09
2018 Real Estate Outlook |
Market and investment
Chart 5 – Median apartment prices and gross yields – December 2016
1200 6%
1000 5%
800 4%
600 3%
400 2%
200 1%
0 0%
Beijing Shanghai Shenzhen Sydney Melbourne Brisbane
Median apartment price (thousands AUD) Gross rental yeild (RHS)
Source:Bloomberg, ABS, CASS, Centaline, Domain, Credit Suisse
In China urban land is state owned with Housing acquisitions in Australia by
The most dramatic change
a 70 year lease to housing owners. In Chinese investors are typically below
contrast Australian real estate is mainly the US$5 million limit and therefore the in active debt lenders is the
freehold. Rural land in China is owned by restrictions on capital outflows introduced
mortgage fund sector. The
village collectives with limited competition by the Chinese government may not have
and as a result low price growth. China a large impact for Australia.5 GFC saw the demise for
also has a 30% deposit requirement on
mortgage funds in Australia,
residential real estate purchases (which
goes up even further for buyers looking which effectively became the
to purchase a second property),
‘shadow banking’ sector of
compared to 10% in Australia.4
the debt market.
Stephen Hynes, Deloitte Financial Advisory Partner, has more than 20 years’
experience in real estate, development, funds management and property finance.
Stephen has also held a variety of senior roles within Lend Lease and Macquarie Bank.
4. Deloitte Access Economics - Juwai.com, 8 May 2017. Here’s why domestic restrictions are driving Chinese buyers abroad. Available at: https://list.juwai.com/
news/2017/05/heres-why-domestic-restrictions-are-driving-chinese-buyers-abroad
5. Deloitte Access Economics - Altmann, E. & Yang, Z., 2 May 2017. Why Chinese investors find Australian real estate so alluring. Australian Broadcasting Corporation
(ABC). Available at: http://www.abc.net.au/news/2017-05-02/why-chinese-investors-find-australian-real-estate-so-alluring/8489686
102018 Real Estate Outlook |
Market and investment
A-REITs – Reflections on value
A-REITs are one of the most public faces of real estate in Australia, given the high level of corporatisation
of the sector. Below we consider some of the trends in the current market and recent movements.
In Australia, listed A-REITs can be classified The market's perception of the cost
into a number of subsectors: Retail (45% of risk has lowered
of market capitalisation of all A-REITs),
The figure below shows the trading
Office (12%), Industrial (12%), Diversified
premiums to NTA and the dividend yields
(27%) and Alternatives (4%). When
at which the A-REIT subsectors traded
considering the asset composition of
through 2016 and 2017:
Diversified REITs, they are largely weighted
to the Office and Retail subsectors.
Premium to NTA – median Dividend yield – median
60% 8%
50%
6%
40%
30%
4%
20%
10%
2%
0%
-10% 0%
Jun-16 Sep-16 Dec-16 Mar-17 Jun-17 Sep-17 Dec-17 Jun-16 Sep-16 Dec-16 Mar-17 Jun-17 Sep-17 Dec-17
Retail REITs Diversified REITs Industrial REITs Retail REITs Diversified REITs Industrial REITs
Office REITs Alternative REITs All A-REITs Office REITs Alternative REITs All A-REITs
10 yr AU gov bond
Notes: Diversified REITs are largely exposed to Retail and Office, with some
exposure to Industrial and Residential. Consequently, its performance is not
dissimilar to the specialised Retail and Office A-REITs.
Source: CapitalIQ, Company annual reports, Deloitte analysis,
While all A-REIT subsectors have generally This decline in capitalisation rates was Retail’s Amazon moment
traded at a premium to NTA since June largely influenced by investor (local and finally arrived
2016, performance across subsectors has foreign) demand for investments with a Over the second half of 2016 and first half
been mixed and the investment themes secure income yield, underpinned by a of 2017, the retail subsector experienced
have also been different. Despite this, the view that interest rates that are likely to an increase in valuations as capitalisation
cost of risk has lowered with property be lower for longer. At the same time, the rates decreased given the wide gap that
valuations reducing the gap to market market capitalisation was weighed down had formed relative to other more secure
capitalisation and the yield differential to by an increase in government bond yields property asset classes such as office.
government bonds reducing by 90 basis (circa 80 basis points) during the first half Consequently, the median NTA premium for
points (2.5% to 1.6%). of FY17 and headwinds in the retail sector retail declined over FY17 from 26% to 4%.
as noted below.
The property valuers continue to In the second half of 2017 there were
play catch-up Since June 2017, NTA premiums have started concerns over the impending arrival of
Over the period, the overall median to rise again driven by an increase in the Amazon and the pressure on consumer
premium to NTA reduced from 21% at June market capitalisation, reflecting a view, in spending driven by low wage growth, higher
2016 to 5% at June 2017. This was primarily our opinion, that there will be further, albeit cost of living and slower house price growth.
driven by NTA growth resulting from a broad small, reductions in capitalisation rates
based reduction in capitalisation rates in applied in the underlying valuations.
underlying property valuations.
112018 Real Estate Outlook |
Market and investment
Despite this, retail malls that were able to Development activity among the large Alternative A-REITs are being priced
offer an improved shopping experience players is strong but the uplift in office for lower interest rates
and diversity of tenant mix have been able property values hasn’t necessarily flowed Alternative A-REITs are invested across a
to partially mitigate the impact from online. through to the value of development range of property types such as storage,
The recent proposed takeover of Westfield assets and this has resulted in premiums rural, education, pubs, retirement,
by Unibail-Rodamco is testament to the to replacement cost being at historical international residential, hotels and social.
global capital markets’ confidence in the highs, particularly in Sydney. Such arbitrage These alternative property assets are
continued relevance of quality malls and provides scope for a rerating of businesses generally smaller, more ‘operational’ in
an acceleration of the consolidation that is with strong development pipelines. nature, have exposure to the same risks
occurring as a response to the online shift as their tenants and tend to have a more
Industrial’s Amazon moment has
and impact on consumer expectations. concentrated tenant mix, implying greater
also arrived
risk with valuations typically based on higher
Office is already low and now waiting The significant NTA premium for Industrial
capitalisation rates.
for uplifts on developments A-REITs reflects a number of factors
For office, NTA increased by 19% between including the structural demand for quality These A-REITs have traded at higher
June 2016 and June 2017 driven by industrial sites in order to achieve supply NTA premiums relative to the traditional
lower capitalisation rates and strong chain efficiencies in the shift to e-commerce, subsectors as investors pursue yield
fundamentals. Strong economic high portfolio occupancy rates, and a particularly in the current low interest rate
fundamentals and infrastructure recognition of the security of tenure of environment. With the increase in premiums
investment, particularly in east tenants. Goodman Group continues to over the second half of 2017, and subject
coast metropolitan cities such as receive due recognition for the successful to confidence in future improvements in
Sydney, combined with a withdrawal business and platform it has built and is an earnings, we expect to see reductions in
of older stock has resulted in below outperformer in this subsector and against capitalisation rates and discount rates,
average vacancy rates for prime space A-REITs in general. especially for assets with exposure to food,
and upward pressure on rents and ageing, health and capital city hotels.
increased earnings for office A-REITs.
A-REITs continue to play it safe on debt funding and are being rewarded
The figure below shows the gearing levels (net debt to book equity)
of the various A-REIT subsectors through 2016 and 2017.
Net debt to book equity – median
80%
70%
60%
50%
40%
30%
20%
Jun-16 Sep-16 Dec-16 Mar-17 Jun-17 Sep-17 Dec-17
Retail REITs Diversified REITs Industrial REITs
Office REITs Alternative REITs All A-REITs
Source: CapitalIQ, Company annual reports, Deloitte analysis
Gearing has been relatively stable across However, in our opinion, A-REITs with
the sector for some time, with the sector lower gearing tend to trade at higher
substantially recapitalising balance sheets premiums to NTA as there is more
post GFC. Median gearing on a net debt to scope to optimise equity returns via
book equity basis has reduced slightly to the increased use of debt.
below 40% over FY17.
122018 Real Estate Outlook |
Market and investment
Transaction activity
The graphs show the capital raisings and
M&A transaction activity in the listed
A-REIT sector since the June 2016 quarter.
A-REIT – Capital raisings by quarter A-REIT – M&A activity by quarter
2500 12 2500 12
10 10
2000 2000
No. of transactions
8 8
Capital raisings
1500 1500
AUDm
AUDm
6 6
1000 1000
4 4
500 500
2 2
0 0 0 0
Jun-16 Sep-16 Dec-16 Mar-17 Jun-17 Sep-17 Dec-17 Jun-16 Sep-16 Dec-16 Mar-17 Jun-17 Sep-17 Dec-17
Total value Capital raisings Total value No. of transactions
Source: CapitalIQ, Deloitte analysis,
Since the June 2016 quarter, A-REIT capital Ribbon Darling Harbour Project ($700 Earnings increases will highlight the
raising activity has largely occurred in the million, September 2016) and Generation high quality management teams and
retail sector with the $1 billion IPO of Viva Healthcare ($670 million, June 2017). platforms in place, but in particular, are
Energy in August 2016 and circa $650 million expected to be driven by factors such as
Outlook
capital raisings each by Vicinity, Westfield developments, operational efficiencies
On the back of strong performance in
and Scentre. The investment theme spilled and optimisation (through the increased
2016 and early 2017, we expect to see
over to industrial, with a $1.1 billion raising adoption of technology). The subsectors
continued strong performance by A-REITs.
by Goodman Group in September 2017 to watch will be the diversified, retail and
However, this will be driven by earnings
and the $500 million IPO of Propertylink in industrials over the short term and office
increases and consolidation among
August 2016. over the medium term. Notwithstanding
certain players, which is likely to be offset
its perception of being stable, we can
While M&A activity in the sector has been by the long awaited increase in interest
expect to look forward to more interesting
more subdued, the median NTA premium of rates towards the end of 2018.
developments in the sector.
deals since the June 2016 quarter was 15%,
with notable transactions relating to the
Tapan Parekh is a transactional valuation specialist Partner, in Deloitte’s Mergers
& Acquisitions practice. With more than 20 years’ experience, Tapan spent seven years
in the London office of Deloitte LLP advising clients in the European market on
valuation and related aspects. Value issues related to mergers, acquisitions, disposals
and restructurings as well as independent advice to directors and stakeholders is
Tapan’s bread and butter.
Alex Collinson is the National Lead Partner – Real Estate and Construction and
an audit Partner in Deloitte Australia. Alex has served global real estate and
construction companies across the world, and in Sydney, London and Toronto in
particular. He is a Member of the Property Council of Australia’s National Accounting
Committee and is Deloitte’s representative on the Property Industry Foundation (the
industry’s charitable arm).
132018 Real Estate Outlook |
Market and investment
Western Sydney – Australia's development site
The surge in infrastructure development and real estate construction projects to accommodate
Sydney’s growing population has begun.
What is your Western Sydney strategy? Precincts and zones are emerging across As jobs and supporting infrastructure are
Over the past five years, Western Sydney the region, which are going to provide built, the demand for housing will continue.
has been in transition from the poor large-scale development opportunities, and Government policy decisions around land
customer to the big and shiny CBD to its lead to other local supporting development. release and planning approvals will be critical.
east to a region full of potential – with the Three better known examples include: the
The nature of the housing product provided
promise of becoming a key real estate, health precinct being created across the
should diversify as well, catering to the new
development and construction hub. South West; the aerotropolis envisaged
breed of locally based, well-paid workers. This
adjacent to the airport to house advanced
Back when people would ask: ‘Why are you will create a need for density along the new
aerospace and defence companies; and the
in Western Sydney?’ there was a stirring metro, rail and motorway corridors, and more
continued growth in industrial and logistics
recognition of the need for Western Sydney premium quality housing.
facilities around the Moorebank intermodal
to thrive in order to unlock the economic
terminal along the M4/M7 corridor.
potential in NSW, and potentially Australia.
This was also driven by the need to
accommodate our growing population.
In the following article we set out some of the key themes playing out across the region and
Today, we have moved from ambitious highlight some of the major infrastructure projects.
concepts to more practical
Infrastructure projects across the Western Sydney region
plans, many of which are under
construction. A number of major
government-backed infrastructure
projects are already underway and
others are progressing through the
planning process. These large-scale
projects are injecting confidence into
the private sector to invest in the region
through all forms of development.
A more integrated planning environment
has also helped, with the creation of the
Greater Sydney Commission and the
release of the integrated Future Transport
Strategy for NSW.
The question we
now ask, is not,
‘why are you in
Western Sydney?’
but how can you
afford not to be?
142018 Real Estate Outlook |
Market and investment
Seize the opportunity in Any concern of apartment oversupply The potential development outline within
Western Sydney in Parramatta CBD appears to be the Sydney Olympic Park Master Plan 2030
The real estate development and overblown as developers react to the will transform the area to include a mixed
investment community is constantly ‘cooler’ market conditions with a 59% residential and office precinct with 23,000
seeking opportunities in growth areas. decrease in DA-approved apartments, new residents, 34,000 new jobs by 2030,
The challenge is to identify and secure these compared with those currently under new schools catering for 5,000 students,
opportunities before your competitors. The construction for the period 2017 to 2018. all complemented by investment in leisure
boom in infrastructure project spending and and retail.
Infrastructure
investment by the private and government
With the proposed Parramatta Light Rail
sectors in Western Sydney is a catalyst for
and Sydney Metro West, the new transport
‘Seizing the opportunity
real estate and development opportunities.
While these projects are not a secret, the
system will deliver both interconnectivity early in a strategic Western
within Greater Parramatta to the Olympic
advantage is to be gained through smart
Peninsula region by 2023. It has also
Sydney location is likely to
timing. Western Sydney is a long-term play
and opportunities are plentiful.
improved routes to the Sydney CBD, with deliver above average capital
travel times down to less than 20 minutes
between Parramatta CBD and Sydney CBD.
growth in the medium term’.
Locations with current The Greater Sydney Commission has
Investment in Parramatta’s cultural
and planned concentrated precinct will attract more visitors to the
recognised the park as a precinct that
forms part of Greater Parramatta to the
investment and area. It will also include the proposed
Olympic Peninsula region and Stage 1 Light
move of the Museum of Applied Arts
development activity. and Sciences (MAAS) to the Parramatta
Rail will provide improved connectivity to
Parramatta CBD and Westmead Health
riverbank, planned expansion of
Parramatta CBD Parramatta Riverside theatres, and a
and Education precinct once completed,
expected in 2023.
30,000-capacity Western Sydney Stadium.
Statistics
The new Sydney Metro West line will
Parramatta is located approximately 25 As this expected increase in workers and
connect Sydney CBD and Parramatta, and
kilometres west of the Sydney CBD. It visitors materialises there will be a gap in
will stop at Sydney Olympic Park. Travel
is four times the size of Perth city. The the market for short-term accommodation.
times to the Sydney CBD will be halved to
Parramatta Central Business District is the Currently 857 new hotel/serviced
about 20 minutes.
second largest employment destination apartment rooms are expected to be built
to the Sydney CBD in NSW, and is growing by 2020 in Parramatta CBD, to service It will include three precincts – Stadia,
rapidly. the Parramatta CBD as well as the wider Central and Parkview that will capture
western Sydney precincts. the benefits from the recently announced
Parramatta Square is a $2bn city centre
rebuilding of ANZ Stadium. This will
renewal project, with 135,000m2 currently
under construction across three new office
Parramatta’s vision to provide civic, retail, and other amenities in
the heart of town centre, and will lead to
projects. Pre-committed tenants include create future growth and the construction of a low-rise residential
NAB, NSW Department of Education and
the NSW State Government. Approximately
opportunities, and become neighbourhood.
30,000 workers will be moving into the an even more liveable city, Stage 2 of the Parramatta Light Rail
Parramatta CBD by 2020. Parramatta CBD will improve connectivity, with a direct
office vacancy for ‘A’ grade buildings is
is finally being realised, connection to Parramatta CBD.
currently at ‘0%’. with benefits from multiple The Sydney Olympic Park will continue to
The high-rise and higher quality projects projects now underway. evolve and provide ample development/
introduced into Parramatta CBD over investment opportunities under the future
the last five years have triggered strong vision of the Masterplan 2030, with the
residential development activity.
Sydney Olympic Park Sydney West Metro, the major enabler
Developers are invested in Parramatta CBD Sydney Olympic Park (SOP), which is of growth of this precinct in the Western
in the medium to long term, with a strong located just 15 kilometres west of the Sydney region.
pipeline of residential and mixed-use Sydney CBD, houses Australia’s largest
projects at the proposal stage. sporting and entertainment precinct, which
has now matured into both residential and
commercial office locations, with significant
expansion plans.
152018 Real Estate Outlook |
Market and investment
Western Sydney Airport Liverpool and South West The health precinct will be complemented
by the emergence of new university
Western Sydney’s Airport project will be Liverpool’s vision is to re-activate its city campuses in Liverpool, that are expected
going ahead and is due for completion centre by ‘anchoring’ the Liverpool Civic to accommodate up to 9,500 new students.
by 2026. It is a unique opportunity for Place project at the southern end of the The University of Wollongong recently
Western Sydney to house Sydney’s second city (opposite end of the current Westfield completed its South Western Sydney
international airport. There will be flow-on shopping centre and Liverpool Hospital). campus, while Western Sydney University’s
benefits to the region as the development The project is scheduled to take four years. Liverpool campus, is currently under
of the ‘Aerotropolis’ will incorporate New council offices and chambers, a civic construction, with completion expected
residential, industrial and commercial plaza, amenities, as well as student, hotel, early this year (2018).
development around the airport and so and residential accommodation, are all
benefit the whole region. It is proposed planned. The investment by Liverpool Sydney Science Park
to be a 24-hour airport. Council is around of $75m.
Sydney Science Park is set over 280
The airport site at Badgerys Creek is The South West and Greater Macarthur hectares and is located in the strategic
located in Western Sydney near the New region of Western Sydney continue to ‘Western Sydney Priority Growth Area’
South Wales Government's Western be areas supplying significant housing at Luddenham. With convenient access
Sydney Employment Area, the Western growth, with detached housing in release to both the M4 and M7 motorways, it is
Sydney Priority Growth Area, and the areas and in Liverpool, Campbelltown and three kilometres north of the new airport
South West Priority Growth Area. other areas adjoining stations along an at Badgerys Creek, and 24 kilometres west
extension to the new railway line. of Parramatta. The project value is $5bn
The Western Sydney Infrastructure Plan
outlines future transport infrastructure The growth of housing in these areas is and and is expected to deliver a community
including the ‘M12 Airport Motorway’ supported by the NSW Department of that will create more than 12,000 jobs,
extending from Liverpool to the airport Planning which has identified five priority 10,000 students and be home to more
and connecting into the existing M7 precincts (out of a total of 30) that lie than 10,000 residents.
Motorway. Also under construction is a within the south western region of Sydney. Stage 1 Masterplan has been created and
$509m, two stage upgrade to Bringelly These include Glenfield, Leppington Town interest has been received from Birling
Road, which connects into the Northern Centre, Greater Macarthur Growth Area, National Avian-Laboratories Centre; CSIRO’s
Road leading past the airport. South Creek West and Western Sydney First Dedicated Innovation Zone and ‘Urban
Airport Growth Area. Living Lab’ in NSW; and Catholic Education
The NSW government is exploring six
options to connect the Western Sydney With the evolution of the Campbelltown Diocese of Parramatta – delivering NSW's
Airport with rail infrastructure to and Liverpool health, education and first STEM-inspired school.
Sydney Metro line. It is also proposed at research precincts, the South West will Conclusion
some stage to establish vital transport become an advanced medical hub for The growth potential for Parramatta,
infrastructure to the future airport. NSW/Sydney, with a residential corridor the Western Sydney Greater Region,
and transport and logistic centre. and the Greater Parramatta to the
The opportunities will become
clearer as planning progresses The existing health precinct in Olympic Peninsula region is significant.
and construction commences. Liverpool will be expanded by the The growth potential is very exciting and
development of Camden Private the opportunities that it will create will be
Hospital, and Stage 2 redevelopment game changers for NSW.
of the Campbelltown Hospital.
David Hagger leads Deloitte’s Western Sydney Real Estate and Construction
practice. David is chairman of the Western Sydney Committee of the Property Industry
Foundation. David works in corporate finance, servicing a range of corporate, private
and government clients.
Fred Ibrahim is a Director and forms part of the Real Estate Advisory and Consulting
team with a focus on Western Sydney clients. Fred has over 18 years’ of experience,
specialising predominately in property valuation and advisory services.
162018 Real Estate Outlook |
Market and investment
Top 10 infrastructure developments across the region
Status: Under construction
Capital value: $16.8b
Westconnex Start date: 2015
Expected completion: 2023
Status: Under construction/committed
Capital value: $12b
Sydney Metro City & Southwest
Start date: 2017
Expected completion: 2024
Status: Proposed
Capital value: $10.4b
Sydney Metro West
Start date: 2017
Expected completion: 2024
Status: Under construction
Capital value: $8.3b
Sydney Metro Northwest
Start date: 2014
Expected completion: 2019
Status: Proposed
Capital value: $5.3b
Western Sydney Airport
Start date: 2018
Expected completion: 2026
Status: Proposed
Capital value: $3.4b
Parramatta Light Rail I & II
Start date: 2018
Expected completion: 2023
Status: Under construction
Capital value: $1.9b
Moorebank Intermodal Terminal Start date: 2017
Expected completion: 2020
Status: Under construction
Capital value: $1.6b
Northern Road upgrade
Start date: 2016
Expected completion: 2020
Status: Proposed
Capital value: $1.25b
M12 Motorway
Start date: 2020
Expected completion: 2023
Status: Proposed
Capital value: $1.25b
ANZ Stadium Start date: 2019
Expected completion: 2022
172018 Real Estate Outlook |
Technology
Why should companies focus on Real Estate
fintech startups?
Technology startups seem to be here to stay.
Rapid advancements in technology have While venture capital (VC) remains
Globally, real estate fintech
lowered entry barriers for tech startups. the dominant funding source, there
Over the past 15 years, the cost of is substantial capital flow from non- startups increased by
establishing an internet-based startup VC investors as well, including REITs,
18% from 246 in 2008
has plummeted from $3 million in the established real estate services
1990s to just $300 today ,6 causing them companies and investors, private equity to 1,372 by 2017.
to become more synonymous with firms and high net worth individuals.
disruption and innovation.
In the five-year period between 2011
This has also meant exponential growth in and 2016, funding from non-VC sources
the real estate sector. Globally, real estate for real estate tech startups increased at a
fintech start ups increased by 18% from compound annual growth rate (CAGR)
246 in 2008 to 1,372 by 2017.7 In the same of 72.4% to $2.4 billion in 2016.9 And there
period, cumulative investments soared is an all-time record funding of $3.4 billion
from $2.2 billion to $31.3 billion.8 YTD, as of July 25, 201710.
6. “Disrupting the Disruptors: Startup Accelerators Feel Pressure to Evolve”, Knowledge@Wharton, University of Pennsylvania, July 28, 2016, http://knowledge.wharton.
upenn.edu/article/why-startup-accelerators-are-feeling-pressure-to-evolve/.
7. Venture Scanner database, data as of July 31, 2017.
8. Ibid.
9. Ibid.
10. Ibid.
182018 Real Estate Outlook |
Technology
See the NUMPERSPEAK chart over for Large crowdfunding firms, such as Fundrise Where should companies start?
more details. and RealtyMogul, have been key proponents Traditional real estate companies can
of eREITs so far.13 Even companies such as benefit by engaging with these startups
We categorise real estate (RE) tech
RealtyShares provide similar investment in different ways. Companies can make
startups into two groups – RE operations
opportunities in the Construction and Real choices based on their investing capacity,
and RE fintechs.
Estate sector as they seek to potentially the utility of a startup’s services, their need
•• RE operations – The operations-related compete with traditional REITs. As such, RE for financing, and so forth. As end users,
tech startups focus on the core real Fintech startups comprise only 5% of the real estate companies can leverage some
estate business such as property search, overall global real estate tech startup space of the online services and solutions for key
leasing, facility management, smart by investments, having raised $1.4 billion property-related decisions.
building technologies, and home services. to date. But they are certainly disrupting
Companies can also access capital by
traditional business models.14
•• RE fintechs – Our focus area of using the innovative funding and investing
discussion, are enabling financing and But this is not just an overseas story with platforms that RE fintechs have to offer.
investments in real estate. They offer investment and innovation in Australia. Alternately, they could also partner with
diverse services and solutions such as Examples include BlochExchange and the RE fintechs to help meet their financing
real estate transaction services, digital BrickX (fractionalised property trading and investment needs. Finally, real estate
lending platforms for construction and platforms) and the emergence of foreign companies can invest in the RE fintechs
real estate owners and lenders, online entrants into the local market, such as and benefit through their growth.
real estate investments options for Purple Bricks, challenging traditional
RE fintechs’ services
individuals, or investments in single- residential real estate agents.
Construction and real estate owners,
family homes for institutional investors.
How to benefit from RE fintechs? developers, and investors can use RE
The general notion was that startups would There are many ways in which traditional fintech platforms for a variety of services
threaten incumbent real estate companies. real estate companies can benefit from the – including leasing, acquisition, disposition
Certainly with the help of technology, they solutions offered by RE fintech firms. They decisions, and managing the underwriting
absolutely offer innovative solutions and can provide platforms that can expand and process, and accessing detailed financial
enhanced user experience at a relatively diversify the lender base and enable more models for property financing.
lower cost, faster pace, and user friendly individuals and institutions to get exposure
environment. However our research shows The most obvious and key benefits would
to real estate.
that while they were initially thought to be be efficiency and convenience, as these
a competitive threat, they have been more This is especially useful for US-based online and sharable solutions have the
about changing the pace of innovation than companies, which face a challenging capability to provide analysis faster, more
taking the place of the incumbents. financing environment, where traditional cheaply, and efficiently.16 As an example,
lenders such as banks are tightening lending Assess+RE provides cloud-based services
Take the case of startups that directly standards and CMBS issuances remain such as property level valuation models
compete with REITs by providing online well below their historical highs due to the and related financial analysis.17
investment avenues for individuals to implementation of the new regulations
invest in commercial real estate in the following the 2008 financial crisis. In light
US.11 Also called eREITs, their solutions of the fact that the global online lending
combine the features of nontraded REITs industry is expected to grow from $40
and crowdfunding, with lower fees.12 But billion in 2016 to more than $1 trillion in the
unlike traditional crowdfunding ventures, next five years, the growth in construction
eREITs offer multiple and diversified asset and real estate financing may very well be
lending services. led by these RE fintechs.15
11. Fundrise website https://fundrise.com/, accessed on August 4, 2017.
12. Ibid.
13. Fundrise website https://fundrise.com/; RealtyMogul website https://www.realtymogul.com/, accessed on August 4, 2017.
14. Venture Scanner database, data as of July 25, 2017.
15. Beth Mattson-Teig, “How is the CRE Industry Adapting to the Emergence of Fintech Solutions?,” National Real Estate Investor, April 25, 2017.
16. Assess+RE website https://www.assessre.com/index.html, accessed on August 4, 2017.
17. Ibid.
19You can also read