STRATEGIC PLAN 2017/18 2021/22 - Richards Bay Industrial ...
←
→
Page content transcription
If your browser does not render page correctly, please read the page content below
STRATEGIC PLAN
          2017/18 - 2021/22

G A T E W A Y   T O   W O R L D   M A R K E T S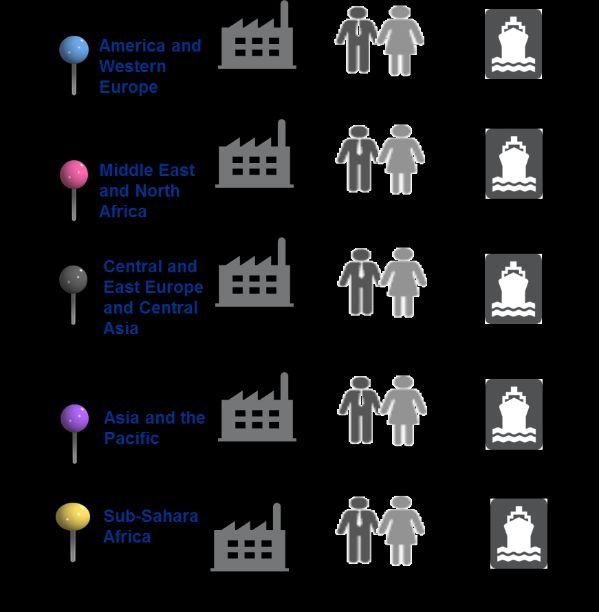
FOREWORD BY THE MEC FOR ECONOMIC DEVELOPMENT, TOURISM AND ENVIRONMENTAL AFFAIRS

On the 9th May 2011 the country witnessed the sod-turning ceremony which paved the way for the construction
of the Richards Bay Industrial Development Zone’s Phase 1A. Since the inception of the RBIDZ, investments
totalling R6,8 billion have been signed. Coupled with this, more than 2000 direct jobs have been created through
construction. This has been achieved because of partnerships involving the district, local municipalities, as well
as the private sector.

The KwaZulu-Natal Provincial government is committed to working with the leadership of various communities in
this district in view of the fact that this province has some of the poorest communities in our country. Many of
these communities are rural, and require a lot of our attention and effort in driving their economic development.
It is with this in mind that the RBIDZ is positioned as a significant role player when it comes to job creation and
the betterment of the lives of our people.

The quest to attract foreign direct investment into the RBIDZ is a deliberate effort aimed at ensuring that
government’s ambitions of closing the widening gap between the rich and the poor. The marketing of RBIDZ in
national and international platforms through conferences, seminars and exhibitions will be intensified. These
marketing efforts are yielding positive results as indicated by an increasing number of investments leads.

In October 2016 I led a delegation that attended the Taiyuan Energy Low Carbon Development Forum held in
China with the aim of promoting structural reform in coal consumption and to develop a low carbon lifestyle. This
forum presented an opportunity for us to see how other countries are embracing the green environment. This
opportunity was also utilized to market the Richards Bay Industrial Development Zone as an investment
destination; especially in energy infrastructure, given its aspirations of housing the Liquefied Natural Gas Hub.
This on its own presented us as key players on issues of preservation of the environment through clean air
projects and the promotion of a low carbon lifestyle.

I am confident that the warm friendship and recognition between us and the people of China will yield various
business and investment opportunities which shall see the South African economy taking a positive turn. My
confidence is bolstered by the dedication of our leadership – starting from the President His Excellency J.G
Zuma to the Premier of the Province of KwaZulu-Natal Mr Willies Mchunu who are the drivers of economic
change and remain our anchors in fostering good relations with other countries.

The energy supply sector plays a pivotal role in the South African economy in improving the quality of life for the
previously disadvantaged majority as well as supporting large-scale industrial development. While a great deal
has been achieved in growing the economy over the past 23 years of our freedom and democracy, our
immediate action as government is working with different stakeholders in attracting direct investment in the
strategic energy infrastructure.

The government wants energy infrastructure programmes to focus extensively in rural areas and labour intensive
approaches to be used for massive job creation purposes. We have set an ambitious target of increasing total
employment to 4.5 million in 2030 (from 2.4 million in 2010). This means that an annual growth rate of 5.43% is
required in order to achieve job creation targets.

We are using both investments in energy infrastructure and environmental sustainability as a driving force
towards our targets. Energy costs and the sustainable generation thereof have in recent times become
increasingly important.

The KwaZulu-Natal provincial government has taken advantage of Operation Phakisa, which was launched by
President Zuma a few years ago, and is currently exploring opportunities that will ensure that we use our
coastline to generate energy. Richards Bay Industrial Development Zone is critical in ensuring the success of
Operation Phakisa given its strategic location in close proximity of the international deep – water Port of Richards
Bay. We have identified various sources through which energy may be generated and these include waves,
ocean currents, tidal currents, salinity gradients, and water thermal gradients.

                                                                                                                  1
As a responsible government we are rising to fulfil the dreams and hopes of all the citizens of this province
regardless of their class, race, gender and geographic location. All endeavours should focus on aligning policies
and strategies in line with the New Growth Trajectory as informed by the Industrial Policy Framework, the New
Growth Path as well as the provincial vision articulated through the work of the Provincial Growth Development
Strategy. The surrounding districts have some of the highest unemployment and poverty rates in the country and
by bringing investment to the RBIDZ, inequality, poverty and unemployment can be challenged head on.

In all platforms I have emphasized the need for the province to increase foreign direct investment to address the
socio-economic strain resulting from subdued economic growth. Over the next few years we will intensify our
plans to ensure that the Richards Bay Industrial Development Zone becomes a catalyst for job creation and
foreign direct investment. In achieving this, the entity will place greater emphasis on the acquisition of land and
strategic properties in order to expand its footprint.

 MEC: ECONOMIC DEVELOPMENT, TOURISM and ENVIRONMENTAL AFFAIRS

                                                                                                                 2
It is hereby certified that this Strategic Plan:
Was developed by the management of the Richards Bay Industrial Development Zone Company SOC Ltd
under the guidance of its Board of Directors
Takes into account all the relevant policies, legislation and other mandates for which the Richards Bay
Industrial Development Zone Company SOC Ltd is responsible
Accurately reflects the strategic outcome oriented goals and objectives which the Richards Bay Industrial
Development Zone Company SOC Ltd will endeavour to achieve over the 5 year period beginning 2017.
3Background by the Chief Executive Officer
Richards Bay Industrial Development Zone once again presents a pleasing set of milestone achievements in
spite of a difficult and rapidly changing socio-economic and political environment. There is now noticeable
purpose-built industrial infrastructure, evidence of functional operations, and a felt positive impact on job
creation, albeit still slanting more on construction jobs. Progress is undoubtedly underpinned by a relentless
execution of the organizational strategy and swift adaptation to the attractive offerings of the Special Economic
Zone thereby resulting in increased investor activity.
During the 2016/17 financial year the Company delivered gratifying performance; a notably increased CAPEX
budget; impactful empowerment programmes for targeted groups of youth and women-led enterprises; and the
commencement of construction of the Techno-Park in Phase 1A. In addition to this, jointly with uMhlathuze
Municipality and under the leadership of MEC Sihle Zikalala, we were able to package a compelling business
case that led to the awarding of 2000MW Gas-to-Power to the Richards Bay area. This has been a profoundly
humbling yet affirming nomination which validates the research as well as long held belief that Richards Bay is
best placed to be the energy hub of the country and the region.
Strong stakeholder relationships with both the Port of Richards Bay as well as uMhlathuze Municipality have
paved the way for a sound collaboration which has evolved from cordiality to partnership, ensuring the fulfilment
of a seamless logistics offering to customers and investors.
In 2016/17 the Board of Directors approved the organizational strategy and mandated Management to focus on
key organizational goals namely; developing a fully endowed Special Economic Zone framed on the 50-year
Master Plan; relentless attraction of sustainable investments; solicit funding for organizational sustainability;
develop employee skills base; uphold premium governance; and, sustain a strong stakeholder engagement with
safety amplified in executing the organizational mandate. The accomplishment of these organizational goals
positions the Richards Bay IDZ to be on the pulse of contemporary business trends such as on-going
globalization that needs to be exploited. Furthermore, the realization of these goals enables us to execute
Government’s 9-point plan whilst meeting investors’ evolving needs of innovation, efficiency, and connectivity.
Through our strategy we create value and opportunities for all our stakeholders, including our customers,
employees, communities, and investors.
Environment
As a responsible corporate citizen seeking long-term business sustainability, we have centralized an ethos
geared at ensuring that we provide a secure and safe working environment, and mitigate adverse environmental
impacts. We have been diligent in upholding a significantly low lost time injury frequency rate in spite of an
extensive infrastructure build programme, notably interspersed with investor construction programme. An
established programme with the environmental fraternity, namely, the Environmental Review Committee (ERC)
ensures a harmonious and sustainable coexistence between economic, ecological and social capital
requirements in the midst of the intensive development undertaking. Similarly, collaboration with the Water
authorities ensures appropriate rationalization in water use to meet both industrial consumption needs while
sustaining the environment.
Investments
Agro-processing: In line with the Radical Agrarian Socio-Economic Transformation Programme (RASET), the
RBIDZ is developing an agro-processing centre which will process agricultural products freshly produced and
sourced through Agri-parks which are facilitated by the District Agri-park Operational Task Team (DAPOTT)
within the King Cetshwayo District. The RBIDZ will be embarking on a procurement programme to identify
suitable operators to invest in the processing of agricultural produce in the IDZ.
Development of an automotive components sector in Richards Bay: RBIDZ together with the City of uMhlathuze,
EDTEA, and the dti are working to develop a compelling case to attract automotive manufacturing (with specific
focus on components manufacturing) to the Richards Bay area.
4Titanium dioxide plant: Pleasing progress is noted regarding the development of the R4.5 billion titanium dioxide
plant as demonstrated by the onset of the bankable feasibility study and material sample testing. The investment
is expected to create 800 construction jobs as well as 300 permanent jobs, and is projected to commence
construction in the 2nd quarter of 2018.
Our investment attraction efforts are set to be a game-changer in creating sound job opportunities and in fighting
the unemployment pandemic in the Province. This is evidenced by a healthy multi billion rand investment
pipeline that the RBIDZ has committed to in various sectors. The RBIDZ’s investment pipeline is comprised of a
total of 12 investments with a total value in excess of R10billion. These investments are expected to create more
than 6500 direct and indirect jobs.
Importantly, the RBIDZ’s investment attraction strategy is to find complementary industries that are able to be off-
takers of each other’s products e.g. titanium dioxide potentially being used as an ingredient in toothpaste, paint,
and other food products.
Outlook
Land acquisition: one of the biggest challenges facing the RBIDZ is the availability of suitable land in the
Richards Bay Area that can be developed for industrial purposes. The RBIDZ has therefore developed a
land acquisition strategy that considers the short, medium, and long term land needs of the Company.
Approval has been received from the Board for the acquisition of certain land parcels as per the strategy and
to undertake a due diligence process on alternative land parcels. The target is to develop additional 250ha
fully serviced land by 2022. It is highly appreciated that the Provincial leadership is prioritizing the RBIDZ in
acquiring additional land for industrial expansion.
Investment attraction: The RBIDZ will continue to focus on attracting investments in the priority sectors as
identified in the marketing strategy. We will also be embarking on an aggressive investment promotion
programme in line with our marketing plan.
Human resources strategy: The RBIDZ recognizes the impact that it needs to have in uplifting the
communities within which it operates. In order to fully deliver on this, a skills audit of the King Cetshwayo
district has been undertaken to enable the Company to identify the pool of available skills that would
facilitate investment attraction and therefore enable job creation. In support of the organisation’s vision we
want to position the RBIDZ as an employer of choice through a compelling employee value proposition
where development of global competitive leaders able to execute the RBIDZ mandate is key. This can be
achieved where Human Resources is viewed as a trusted advisor and strategic partner.
Phase 1F infrastructure rollout: The RBIDZ is embarking on an extensive infrastructure roll out programme in
the 2017/18 financial year to the value of R302 million.
Techno Park: Construction of the Techno-Park administration building commenced in September 2016 and it
is pleasing to note that out of the four techno-parks that will be located in the KwaZulu-Natal Province,
RBIDZ has been the first organisation to commence construction and has reached a 25% construction
milestone. Construction is projected for completion in the second half of 2017. The RBIDZ has signed a
Recognition Agreement with Umfolozi TVET who will be the tenant for the Techno Park. The main objective
of this collaboration is to provide artisan training as part of our skills development initiatives for the region.
CSI flagship: We continue to invest strategically in our community relationships in recognizing the important
corporate citizen role we play in the broader Zululand region. In doing this we have supported numerous
community upliftment initiatives, including the local hospice as well as an organisation that assist people living
with disabilities. In order to further our efforts we have increased our corporate social investment budget to reflect
the necessity of re-investing in our communities and are in the process of developing a CSI strategy that would
see us investing in flagship CSI projects within the King Cetshwayo district.
5 Bayside – downstream aluminium opportunities: We continue to negotiate the acquisition of the former
Bayside Smelter site to create a mineral beneficiation hub that would include downstream Aluminium
processing and Iron Ore pelleting.
SMME development: The RBIDZ will continue with supplier development training to local SMMEs in
alignment with EDTEA’s objective of empowering SMMEs to participate in the mainstream economy.
The 2017/18 financial period will be characterized by a more robust construction programme, with the
commencement of civil, electrical, and ICT infrastructure projects in Phase 1F, as well as the widening of
Alumina Allee Road. The capital expenditure programme will see a peak as we deliver significant new capacity to
prepare for the hosting of large scale industrial enterprises that have been committed for Phase 1F. The
Richards Bay Industrial Development Zone is therefore poised to grow immeasurably as it achieves its targets
set in the 5-year Strategy towards 2022.
CHIEF EXECUTIVE OFFICER
6Contents
LIST OF ACRONYMS ................................................................................................................................... 9
PART A: STRATEGIC OVERVIEW................................................................................................................ 11
1. Purpose ........................................................................................................................................... 12
2. Vision .............................................................................................................................................. 12
3. Mission ............................................................................................................................................ 12
4. Values ............................................................................................................................................. 12
5. Legislative and Other mandates.......................................................................................................... 13
5.1 Legislative Mandate ................................................................................................................. 13
5.2 Relevant Court Rulings ............................................................................................................. 13
5.3 Planned Policy initiatives........................................................................................................... 14
5.3.1 Industrial Policy Action Plan .................................................................................................. 14
5.4 Constitutional Mandate ............................................................................................................. 16
6 SITUATIONAL ANALYSIS ................................................................................................................... 17
6.1 Global Research ...................................................................................................................... 17
6.1.1 Special Economic Zones........................................................................................................... 17
6.1.2 PESTEL Analysis ..................................................................................................................... 19
a) Political ............................................................................................................................... 19
b) Economic ............................................................................................................................ 20
c) Social.................................................................................................................................. 23
d) Technological ...................................................................................................................... 24
e) Environmental...................................................................................................................... 25
f) Legislative ........................................................................................................................... 26
6.1.3 SWOT Analysis ...................................................................................................................... 28
6.1.4 Table of PESTEL items ........................................................................................................... 29
6.2 Performance Environment...................................................................................................... 30
6.3 Organisational Environment ................................................................................................... 30
7 The strategic planning cycle of the Company ....................................................................................... 33
7.1 Strategic Planning Process .................................................................................................... 33
7.2 Strategic focus for the next 5 years ........................................................................................ 33
7.2.1 Policy Environment ................................................................................................................ 33
7.3 Strategic Goals ...................................................................................................................... 35
PART B: STRATEGIC OBJECTIVES ............................................................................................................. 36
8 STRATEGIC OBJECTIVES .................................................................................................................. 37
8.1 PROGRAMME 1: ADMINISTRATION ....................................................................................... 37
8.1.1 Sub-Programme: Office of the CEO ........................................................................................ 37
8.1.1.1 Resource considerations................................................................................................... 37
8.1.2 Sub-Programme: Corporate Services ..................................................................................... 39
8.1.2.1 Resource considerations................................................................................................... 39
8.1.3 Sub-Programme: Finance ....................................................................................................... 41
78.1.3.1 Resource considerations................................................................................................... 41
8.2 PROGRAMME 2: ZONE DEVELOPMENT AND OPERATIONS .................................................. 45
8.2.1 Resource considerations........................................................................................................ 46
8.3 PROGRAMME 3: BUSINESS DEVELOPMENT AND SUPPORT ................................................. 47
8.3.1 Resource considerations ....................................................................................................... 47
9 Strategic Risks ................................................................................................................................... 49
PART C: LINKS TO OTHER PLANS .............................................................................................................. 52
10 Links to long-term infrastructure and other capital plans .............................................................................. 53
11 Sources............................................................................................................................................ 54
12 INDICATOR DESCRIPTORS ................................................................................................................ 55
8LIST OF ACRONYMS
ACF African Competition Forum
ASGISA Accelerated and Shared Growth Initiative for South Africa
BRICS Brazil, Russia, India, China and South Africa
CCA Customs Control Area
CEO Chief Executive Officer
CFO Chief Financial Officer
CIDB Construction Industry Development Board
CIP Critical Infrastructure Programme
dti Department of Trade and Industry
EDTEA Department of Economic Development Tourism and Environmental Affairs
EDD Economic Development Department
EIA Environmental Impact Assessment
Exco Executive Committee
FDI Foreign Direct Investment
GDP Gross Domestic Product
GGP Gross Geographical Product
GWh Gigawatt hour
HR Human Resources
ICN International Competition Network
ICT Information and Communication Technology
IDZ Industrial Development Zone
IPAP Industrial Policy Action Plan
IRR Internal rate of return
ISO International Organisation for Standardisation
IT Information Technology
ITT Interdivisional Task Team (ITT)
KMS Knowledge Management System
KW Kilowatt
KWh Kilowatt hour
KZN KwaZulu-Natal Province
LRA Labour Relations Act
MDA Manufacturing Development Act
MOU Memorandum of Understanding
MTEF Medium Term Expenditure Framework
MTSF Medium Term Strategy Framework
MW Megawatt
MWh Megawatt hour
NDP National Development Plan
NEDLAC National Economic Development and Labour Council
NEET Not in education, employment or training
NEMA National Environmental Management Act
NGP New Growth Path
NPC National Planning Commission
OHSACT Occupational Health and Safety Act
PDP Personal Development Plan
PESTEL Political, Economic, Social, Technological, Environmental and Legal
PFMA Public Finance Management Act
PGDS Provincial Growth and Development Strategy
RB Richards Bay
RBIDZ Richards Bay Industrial Development Zone
RSA Republic of South Africa
SARS South African Revenue Service
9SCM Supply Chain Management
SDI Spatial Development Initiative
SEZ Special Economic Zone
SMART Specific, Measureable, Achievable, Relevant and Time Bound
SWOT Strengths, Weaknesses, Opportunities and Threats
TIKZN Trade and Investment KwaZulu-Natal
TISA Trade and Investment South Africa
CTLF Clothing, Textile, Leather and Footwear
10PART A: STRATEGIC OVERVIEW
111. Purpose
The company’s purpose summarised, ultimately guides the strategic direction of the organisation. The purpose of the RBIDZ
is to develop a Special Economic Zone in order to:
Attract local and foreign investors who will beneficiate South Africa’s raw materials;
Create production capacity;
Provide services; and
Create employment and improve the skills base.
2. Vision
To be the preferred Special Economic Zone for quality investments whilst delivering value to our stakeholders.
3. Mission
We utilize the competitive advantage of the Richards Bay area to attract sustainable investments that stimulate economic
growth, job creation, beneficiation of resources and the empowerment of people.
4. Values
RBIDZ’s vision is supported by five core values, which underpin the workings of the company. (ERISSI)
Excellence We shall conduct our business with our stakeholders and investors with highest
levels of professionalism, competence and responsibility
Respect We shall embrace diversity by treating each other with respect, trust and dignity at all
times
Integrity We shall pursue ethical practices by being open, honest, sincere and consistent in
actions and communications
Sustainability We shall pursue the development of the RBIDZ to meet the present needs without
compromising the ability of future generations to meet their own needs whilst
promoting the health and safety culture
Safety We shall maintain a safe working environment for our employees, contractors, and
investors
Innovation We shall seek creative and novel solutions to ensure continued improvement and
address the needs of RBIDZ and stakeholders
125. Legislative and Other mandates
5.1 Legislative Mandate
The RBIDZ is a Schedule 3D entity in terms of the PFMA.
The IDZ Programme in South Africa was established in terms of a cabinet resolution of September 2002 and was regulated
in terms of the Manufacturing Development Act, 1993 (Act No. 187 of 1993) and in particular the specific Regulations made
under that Act and contained in Regulation No: R1224 of 1 December 2002 (Government Gazette No: 21803), which was
subsequently amended by Government Notice No R1065 of 27 October 2002 (Government Gazette No. 29320).
The RBIDZ was separately established by Government Notice No. 644 of 26 April 2002 (Government Gazette 23369) and
its area was then amended by Government Notice No. 1045 of 4 August 2006 (Government Gazette 29094).
On 9 February 2016 the Special Economic Zones Act, 2014 (Act No. 16 of 2014) replaced the Manufacturing Development
Act as the statute which regulates Industrial Development Zones. In terms of the transitional provisions to this Act, all
Industrial Development Zones created in terms of the Manufacturing Development Act were deemed to be Special
Economic Zones. Industrial Development Zones are one of the categories of Special Economic Zones contemplated in the
Special Economic Zones Act.
In terms of the Special Economic Zones Act, the purpose of creating Special Economic Zones, such as the RBIDZ,
includes:
a) facilitating the creation of an industrial complex, having strategic national economic advantage for targeted
investments and industries in the manufacturing sector and tradable services;
b) developing infrastructure required to support the development of targeted industrial activities;
c) attracting foreign and domestic direct investment;
d) providing the location for the establishment of targeted investments;
e) enabling the beneficiation of mineral and natural resources;
f) taking advantage of existing industrial and technological capacity, promoting integration with local industry and
increasing value-added production;
g) promoting regional development;
h) creating decent work and other economic and social benefits in the region in which it is located, including the
broadening of economic participation by promoting small, micro and medium enterprises and co-operatives, and
promoting skills and technology transfer; and
i) The generation of new and innovative economic activities.
The Customs Controlled Area within an SEZ is regulated by the Customs Control Act, 2014 (Act No. 21 of 2014). The
RBIDZ shall, in conjunction and collaboration with SARS: Customs and Excise Division, be responsible and facilitate
compliance by SEZ Enterprises, with all SEZ specific legislation, rules and regulations regarding movement of goods,
persons and vehicles into and out of the proclaimed areas, as well as with legislation, guidelines and standards;
specifically pertaining to safety, health and environment.
In short therefore, the purpose of the RBIDZ is to develop a Special Economic Zone in order to attract local and foreign
investors who will create production capacity to beneficiate South Africa’s raw materials prior to export and also to create
exportable services and will thereby create employment and improve the skills base.
It is thus an integral part of Government’s macro-economic policy to develop South Africa’s manufacturing sector by
encouraging investment in the manufacturing industries, centred on beneficiation of the country’s natural resources.
5.2 Relevant Court Rulings
The key court case dealing with Industrial Development Zones is the decision of the Constitutional Court in Offit Enterprises
(Pty) Ltd and Another v Coega Development Corporation (Pty) Ltd and Others (CCT 15/10) [2010] ZACC 20; 2011 (1) SA
293 (CC) ; 2011 (2) BCLR 189 (CC) (18 November 2010). In this case the Applicants sought a declaratory order that any
13expropriation of their applicants’ property at the instance of the Coega Industrial Development Zone was neither permissible
nor lawful.
In Offit Enterprises (Pty) Ltd and Another v Coega Development Corporation (Pty) Ltd and Others (09/09) [2010] ZASCA 1;
2010 (4) SA 242 (SCA) ; [2010] 2 All SA 545 (SCA) (15 February 2010) the Supreme Court of Appeal found: “that an
expropriation of the appellants’ properties for the purposes of their inclusion in the Coega IDZ would serve a public purpose
and it can make no difference whether the properties are retained by the national government as the expropriating authority
or transferred to Coega Development. In any event such an expropriation would plainly be in the public interest once it is
accepted that it furthers the development of the Coega IDZ. That suffices to dispose of the point that an expropriation would
not be permissible under s 2 of the Expropriation Act.”
The Constitutional Court found “there is no reason that the first respondent should be barred from making an application for
the expropriation of the applicants’ property in the future if it so requires for the benefit of the development of the Coega IDZ,
provided that it does so lawfully”.
The above makes it clear that the existence of Industrial Development Zones, such as the RBIDZ, is in the public interest
and could justify the use of expropriation, if required.
The case of Land Access Movement of South Africa and Others v Chairperson of the National Council of Provinces and
Others (CCT40/15) [2016] ZACC 22; 2016 (5) SA 635 (CC) (28 July 2016) is important to the Company as it is in the
process of acquiring land and there is a risk that the land it acquires may be subject to a future land claim after it is acquired.
This case dealt with the Restitution of Land Rights Amendment Act 15 of 2014, which extended the deadline for lodging land
claims until 2019. The Court found that the Act was invalid as a result of insufficient public participation. The decision
effectively closed the window to file further land claims unless and until a new Act is passed. Any claims subsequent to 1
July 2014 also cannot be processed.
The case of Umso Construction (Pty) Ltd v Member of the Executive Council for Roads and Public Works Eastern Cape
Province and Others (20800/2014) [2016] ZASCA 61 (14 April 2016) illustrates the care that must be taken in tender
processes to ensure a fair process as well as the duty of tenderers to disclose relevant information. The case is important to
the Company given the number of tenders it awards and the negative consequences which would arise were projects to be
delayed by relating to the award of tenders.
In this case it was sought to set a tender aside. The first ground for review arose from Umso Construction being found non-
responsive as the tender required that tenderers had to have been involved in a tender with a value of at least R60 million in
the last 7 years. Umso had been involved in such a project as a joint venture partner which had that experience. The Court
found Umso had been improperly disqualified.
A second issue dealt with the fact that between the close of tenders and final adjudication the selected tenderer had been
put under business recue, which had not been disclosed to the employer. The Court found that the duty to disclose the
financial status of a tenderer is found in paragraph F.2.2 of the department’s tender data which expressly provides that the
employer will only consider tenders from tenderers who can prove to its satisfaction that they have the necessary financial
resources to undertake and complete the work. It can hardly be disputed that an entity that applies to be placed under
business rescue because it is financially distressed would fall outside of this tender condition. The Court found that there
were sufficient grounds to award the tender to the Plaintiff.
5.3 Planned Policy initiatives
5.3.1 Industrial Policy Action Plan
At the launch of the 8th iteration of Industrial Policy Action Plan - IPAP2016/17-2018/19 (IPAP) on Monday, 9 May 2016,
Minister of Trade and Industry Dr Rob Davies, stated that there is now an even more pressing need for structural change in
the economy, to break out of commodity dependence and move to a more diversified base in which increasing
manufacturing-based value addition, employment creation and export-intensity come to define South Africa’s growth
trajectory.
IPAP 2016 envisages nothing less than a massive, concerted and focused national industrial effort, intimately involving all
the key stakeholders and economic partners.
14This must be built on four pillars, viz:
Policy coherence and policy certainty across government;
A close collaborative effort between government, business and labour;
A commitment to ensure that the linkages between the primary and secondary productive sectors of the economy are
maximised; and
A combined and constructive drive to overcome the key constraints to manufacturing-led, value-adding growth and
labour-intensive manufacturing.
IPAP 2016/17–2018/19: Key Focal Areas
Public procurement – greatly enhanced and enforced compliance with localisation targets set for government departments
and State Owned Companies.
A strong focus on spill-over and labour-intensive sectors - in particular: agro-processing; the CTLF sector; the
component manufacturing and sub-assembly sub-sectors in automotives; rail, light manufacturing and engineering in the
metals sector; plastics and associated sub-sectors; electro-technical assembly, sub-assembly and component
manufacturing; downstream timber and pulp products, including furniture and boatbuilding.
Carefully targeted Industrial financing and incentives – including: a) much stronger export credit and export credit
insurance support, in combination with a wide range of sector-specific incentives; and b) energetic implementation of the
recently launched Black Industrialists Incentive.
Leveraging the devaluation of the Rand to make South African manufactured products more globally competitive and
create opportunities for the expansion and further development of SA’s domestic manufacturing capabilities.
Growing exports: there are four main pillars to the IPAP export strategy:
Building partnerships with global Original Equipment Manufacturers (OEMs) focused on transferring technologies and
growing our exports in OEM value chains; partnering with national export champions to catalyse increased national
technology absorption for the development of high value exports.
Strengthening existing Industry Associations and Export Councils; including establishing a dedicated new Export
Council for Africa.
Developing export-orientated production hubs in SEZs and Regional Clusters and fostering industrial decentralisation.
Automotive: the Department of Trade and Industry has established a team of technical experts to develop a post-2020
Automotives Master Plan
The mandate of the team is to examine the entire automotive sector and not just the existing Automotive Policy
Development Plan (APDP) - which means that it will now include light, medium and heavy vehicles and motorcycles.
The purpose of this work will be to ensure that in the context of long term policy certainty a post-2020 Master Plan will
create a framework to secure even higher levels of investment and production, higher exports, deepening localisation
and expanding employment.
Gas-based industrialisation: IPAP 2016 introduces a medium term programme to ensure that gas-based industrialisation
increasingly develops into one of the spines of our industrial strategy, leveraging natural gas as both a source of power
generation and a driver of industrial diversification.
Minimising red tape: to open up space for much more streamlined and business-friendly governance processes. These
efforts will include:
15 Establishment of an inter-Ministerial Committee (IMC) on Investment to tighten up the intra-governmental coordination
required to underpin South Africa’s new One-Stop Investment Centres.
A rapidly expanding partnership between the CIPC (Companies and Intellectual Property Commission) and all the
major banks to provide official company registration facilities within their branches and online.
5.4 Constitutional Mandate
In the light of its goals of growth, development and job creation, the IDZ programme relates to the constitutional goal of
improving the quality of life of all citizens and freeing the potential of each person; building a united and democratic South
Africa that is able to take its rightful place as a sovereign state in the family of nations and, in creating jobs, enhancing the
dignity of all. In order to achieve this RBIDZ advocates for the employment of a larger percentage of South Africans in each
investment project within the zone. Furthermore it will maximise downstream opportunities for the benefit of SMME’s.
Industrial Development Zones directly relate to the functions of industrial promotion, regional planning and development and
urban and rural development, set out in Schedule 4 of the Constitution of the Republic of South Africa, 1996.
As an organ of state the RBIDZ is mandated to ensure that its procurement processes are fair, equitable, transparent,
competitive and cost effective and is in accordance with the right of fair administrative action.
It is also required to ensure that, in developing the zone, it recognises that everyone has a right to an environment that is not
harmful to their health or well-being and to have the environment protected, for the benefit of present and future generations.
166 SITUATIONAL ANALYSIS
6.1 Global Research
The assessment of international IDZ/SEZ development revealed that there are more than 3000 Special Economic Zones
operating worldwide. The lessons learnt by the international Special Economic Zones were considered by RBIDZ in
developing their strategic plan for 2017-2022.
6.1.1 Special Economic Zones
There are over 3000 SEZs in 135 countries. Globally SEZs contribute to 68 million jobs and $851 billion in exports.
Figure 4 provides an overview of SEZs globally
and their contributions in terms of jobs and
revenue
The figure above shows that Sub-Sahara Africa has the fewest number of SEZs. Contribution of revenue per SEZ is ranked
from highest to lowest as follows:
Middle East and North Africa ($793 million per SEZ)
Asia and pacific ($514 million per SEZ)
Central and East Europe and Central Asia ($203 million per SEZ)
America and Western Europe ($135 million per SEZ)
Sub-Sahara Africa ($70 million per SEZ)
Given the opportunities in respect of untapped natural resources and clean energy as well as the later start in terms of
establishing and developing SEZs in Sub-Sahara Africa, there is potential for growth that must be considered and
leveraged.
Based on size, prominent examples of SEZs include Jebel Ali Free Trade Zone in United Arab Emirates, Shenzen in China
and Iskandar in Malaysia. However, SEZs are not the sole domain of developing countries as seen in figure 4. For many
years, both the United States and the United Kingdom have used Enterprise Zones to encourage growth in depressed
areas.
Key success factors that can be extracted from some of the international SEZs include:
Strong Incentives
Incentives offered by the SEZs are globally competitive and therefore increases the SEZs ability of attracting
investors.
Strong commitment and support of the government to pilot market-oriented economic reforms
Despite the high uncertainty at the beginning, the top leaders were determined to make changes, through a
gradualist approach. Such a determination ensured a stable and supportive macro-environment. The central
17government also tried to decentralize its power and help create an open and conducive legal and policy
environment for the SEZs. At the same time, the local governments made a great effort to build a sound business
environment. They not only put in place a conducive regulatory environment for reforms, an efficient administrative
system such as “one-stop-shops”, but also good infrastructures for the zones.
Land Reforms
In China, the land reforms started from Shenzhen has played an important role in the SEZs’ success. Before
1981, all land belonged to the State in the urban areas and, in rural areas, land was “collectively” owned. Since
1981, the government allowed SEZs to lease land to investors with an initial term of 20-50 years with the
possibility of renewal.
Meanwhile, a land auction system was established for all the commercial land (2002) and industrial land (2007) to
ensure the efficient use of land resources (Shen and Xu 2011). These reforms helped to establish a modern land
market which has transformed whole China’s urban landscape.
Investment incentives and institutional autonomy
To encourage firms (especially FDIs) to invest in the zones, the SEZs had in place various fiscal and non-fiscal
incentives and preferential policies, including streamlined administrative process, sound infrastructure, rapid
customs clearance, concessionary tax rates, and flexibility in hiring and firing workers, among others (Ge 1999;
Enright, Scott, and Chung 2005).
Favourable policies were also in place to attract skilled labour, such as the provision of housing, research funding,
education subsidies, etc. In addition, the SEZs (especially the early-stage ones) were given greater political and
economic autonomy. They had the legislative authority to develop municipal laws and regulations to govern these
zones. Such an unusual discretion allowed them more freedom in pursuing new policies and development
measures deemed necessary to vitalize the economy.
Foreign Direct Investment and the Chinese diaspora
FDI and the Chinese diaspora have played important roles in the success of the SEZs by bringing capital
investment, technologies, and management skills; generating learning and spill overs; and ultimately helping to
build local manufacturing capacity.
At the same time that the SEZs were opening up in the 1980s, Hong Kong (China), Macao (China), and Taiwan
(China) were also beginning to upgrade their industrial structure and transfer out their labour-intensive
manufacturing sectors. The cheap labour and good infrastructure in the SEZs, as well as the Open Door policies
coupled with various incentives, provided a great opportunity for FDI to flow into China from the diaspora.
Technology learning, innovation, upgrading, and strong links with the domestic economy
One of the key strengths of the SEZs is that they have a high concentration of very skilled people, including many
R&D personnel, especially in the HIDZs and ETDZs. As a result, they have become centres of knowledge and
technology generation, adaptation, diffusion, and innovation.
Governments also put strong emphasis on technology learning and innovation, as well as technology-intensive
industries. In addition, the SEZs are closely linked to domestic enterprises and industrial clusters through supply
chains or value chains. This connection not only helps achieve economies of scale and business efficiency, but
also stimulates synergistic learning and enhances industrial competitiveness (Zeng, 2010).
Innovative cultures
In addition to institutional flexibility, the composition of people in the SEZs also helped nurture innovation and
entrepreneurship. Because most SEZs were built in new areas or suburbs of cities and were open to all qualified
workers, they have attracted a large number of immigrants from across the country and, later on, from overseas,
who hoped for better jobs and new opportunities. Such a strongly motivated migrant community tends to generate
an innovative and entrepreneurial culture.
Clear objectives, benchmarks, and competitions
In China, SEZs were normally set up in batches, initially four and then the number increased rapidly. Despite the
large number of these zones, most of them have clear goals and targets in GDP growth, exports, employment,
revenues, FDI generation, and the like. These expectations put a great deal of pressure and responsibility on the
18shoulders of the zone management. Meanwhile, the SEZs are highly competitive among themselves. Such
competition helps make them more efficient and competitive.
Location advantages
Most SEZs in China are located in the coastal region or near major cities with a history or tradition of foreign
trading or business and thus are better linked to the international market. They also have good access to major
infrastructure, such as ports, airports, and railways. The location advantage is especially obvious for the SEZs in
the Pearl River Delta region (close to Hong Kong, China) and the Min Delta region (close to Taiwan, China).
6.1.2 PESTEL Analysis
The PESTEL dimensions were researched as part of the macro-economic analysis to establish the current dimensions that
could impact RBIDZ. The environmental factors applicable to RBIDZ were considered during the development of the RBIDZ
2017-2022 Strategic Plan.
These factors are summarised as follows:
a) Political
The RBIDZ is seen as an engine for job creation and a catalyst for foreign direct investments, this was highlighted by the
Premier of KwaZulu-Natal in his State of the Province address delivered on 25 February 2016. In his speech he noted that,”
Manufacturing sector is the backbone of the economy of the province. The reality is that this sector has huge demand on
electricity. It is for these reasons that we are using RBIDZ to pioneer an energy production hub. Currently, about 20 hectares
of Land have been identified at the Bayside to host gas-to-power operations in an effort to yield diversified energy
generation capacity from renewable sources”.
There is also a clear political commitment in ensuring the success of the IDZ programme and in particular the KZN EDTEA
is committed to its mission and mandate to develop and implement strategies that encourage participatory sustainable
economic development.
The EDTEA’s objectives include:
To facilitate globally competitive and sustainable industries and services;
To support the development of sustainable small, micro and medium and social enterprises that contributes to food
security, wealth and job creation; and
To facilitate integrated planning that ensures effective implementation of sustainable economic development
policies, strategies and programmes.
The creation of the conditions necessary to facilitate these nascent programmes inevitably relate to economic, financial and
legislative support and flexibility. In order to ensure growth, the EDTEA requires catalyst projects that will generate
expansionary growth or provide impetus to Greenfield projects and investments. The RBIDZ aims to fast track the
development of its phases within the stipulated time frames so as to benefit from EDTEA’s strategies on participatory
sustainable economic development.
The RBIDZ is aware of the challenges it faces, taking into account the requirements of the KZN EDTEA, revised Black
Economic Empowerment promulgated by the National Department of Trade and Industry and the access and procurement
of sufficient provincial and national funding. Additionally, consideration also needs to take account other factors affecting the
RBIDZ such as:
Grant dependency
Competition with other SEZ’s for funding
Change in leadership may impact on the support received
Political uncertainty and its effect on investor perception
Black Industrialist Programme
One stop shop initiative being driven by National Government
19b) Economic
Economic factors were considered in the following broad categories in order for RBIDZ to achieve their vision in attracting
quality investors:
Overview of the Global economy
Overview of the South African economy
Overview of Richards Bay
Overview of the Global economy
In January 2016, the International Monetary Fund (IMF) lowered its 2016 projection for global economic growth from 3.6% to
3.4%, following growth of 3.1% in 2015. Global growth is expected to be 3.6% in 2017. GDP growth in sub-Saharan Africa is
expected to reach 4% in 2016, up from 3.5% in 2015.
The USA remains one of the strongest growing economies and this factor is likely to continue pushing the US dollar higher
in 2015-16. US job creation remains buoyant and real disposable income is climbing. The US in the first quarter of 2016
recorded a growth rate of 0.5%. This was the worst performance in two years and was mainly due to a slowdown in
domestic demand as well as a fall in exports. Growth in 2016 is likely to be soft, with growth expected at around 2%,
weighed down by contracting business investment in the energy sector and the strong dollar, which will dampen exports.
However, growth is likely to rise to an annual average of 2.3% in 2017-18, supported by stronger capital formation. Inflation
is bound to accelerate as the labour market tightens and commodity prices recover.
In Europe the European Central Bank (ECB) remains firmly in the loosening phase of its cycle. In March 2016 it reduced its
deposit rate from -0.3% to -0.4%; increased the size of its quantitative easing (QE) payments by €20 billion per month;
added investment grade non-bank corporate debt to the QE programme; cut its policy rate to zero; and introduced more
measures to encourage banks to extend credit. This was a more aggressive package of measures than was expected, but
the euro rose against the dollar in response. A persistently strong euro will hamper the ECB's efforts to deliver inflation of
2%. Confidence in the euro zone will continue to be undermined by wider existential questions about its future, the rise of
national opt-outs from regional-wide policy and its inability to resolve the migrant crisis. In its latest quarterly forecasts, the
ECB lowered its estimates for growth and inflation. It forecast inflation of 1.3% in 2017 and 1.6% in 2018.
There has been a heightened sense of instability surrounding the Chinese economy. The government unwisely intervened in
equity and currency markets, suggesting that the authorities are finding it difficult to manage the transition from a production
dominated economy to a consumption and services-driven economy. The Chinese economy is growing at two very different
speeds: the manufacturing sector, plagued by overcapacity and inefficiency, is struggling to expand, with the government
promising to close loss-making plants and reassign millions of workers into more productive areas. As the engine of growth
in such a huge economy shifts from manufacturing to services, further periods of volatility are to be expected.
The increase in uncertainty about economic growth in the United Kingdom is the major driver behind the immediate reaction
in the financial markets. Brexit will inevitably increase the friction between the UK and its international trading partners. Many
large businesses, unsure of future access to the common European market for goods and services, will most likely postpone
or even freeze their major investments in the U.K. And because global business is so interconnected, the prospect of a
worldwide economic slowdown becomes more plausible.
One interesting development for China is its inclusion by the International Monetary Fund (IMF) of the Chinese Yuan into the
basket of currencies making up the Special Drawing Rights (SDR), joining the US dollar, the British Pound Sterling, the Euro
and the Japanese Yen, to be effective from 1st October 2016. This will make the Yuan the third most powerful currency in
the world. With its status as the world’s largest trading nation, China can now protect itself from US policy decisions and spill
over effects from Quantitative Easing (QE).
The biggest concern stemming from China and the US economic developments from an Africa perspective, is that fixed
asset investment from China may begin to retract and a US economy failing to recover would have dire consequences for
the African continent.
20Overview of the South African Economy
South Africa’s GDP growth in the fourth quarter of 2015 amounted to 0.6% (quarter on quarter (q/q) annualised) which was
slightly down on the 0.7% recorded in the third quarter of 2015. The growth rate in 2016 is projected to be lower than 2015’s
growth rate of 1.3%, at only 0.5%.
GDP growth in the first quarter of 2016 for SA contracted by 1.2% and contracted by 0.3% in KZN. Sectors in KZN that were
negatively affected were;
Agriculture (-6.0% and has contracted for five consecutive quarters)
Mining (-18.2%), and
Transport (-2.7%)
Real production by the agricultural sector contracted throughout 2015. In the final quarter, growth in the gross value added
(GVA) by the agricultural sector amounted to –14% (q/q annualised), following the –12.6% which was recorded in the third
quarter of 2015. Widespread drought conditions experienced during the planting and growth season, adversely affected field
crop production. Grain SA estimates that South Africa may need to import almost half of its domestic maize requirement.
This would amount to as much as 6 million metric tonnes for the year ending April 2017 at a cost of some R20 billion.
Agricultural value added growth in real terms, amounted to –8.4% in 2015, with another decline of around 4.5% expected in
2016.
The real value added by the mining sector rose by 1.5% (q/q annualised), in the fourth quarter after declining by 9.8% in the
third quarter of 2015. Mining production in 2015 amounted to 3% (year on year (y/y)), with the sector benefitting mainly from
the normalisation in platinum production following the protracted labour strike in the platinum sector in 2014. However, the
outlook for growth in the mining sector in 2016 remains subdued, with the growth forecast at around 1.9%. The sector’s
performance is likely to be adversely affected by infrastructural constraints, policy uncertainty, on-going labour tension,
declining commodity prices, rising operational costs, and a global oversupply of certain mining products.
After a short-lived pickup in the growth performance to 6.2% (q/q annualised) in the third quarter, the manufacturing sector
gross value added shrunk by 2.6% in the fourth quarter. Production volumes declined in the subsectors supplying basic iron
and steel; non-ferrous metal products and machinery; electrical machinery; and motor vehicles, parts and accessories. The
weaker demand for metals and metal products by China, was a major cause for the depressed manufacturing production
activity. Overall manufacturing growth amounted to only 0.1% y/y in 2015, with the sector’s performance expected to
improve to 1.9% in 2016.
Tertiary sector growth weakened slightly to 1.5% (q/q annualised) in the fourth quarter of 2015, after growth of 1.9% was
recorded in the third quarter of 2015. Growth in all tertiary sub-sectors weakened, with the transport, storage and
communication sub-sector posting slightly negative growth of –0.2% in the fourth quarter. The real value added by the
tertiary sector (69% of total Gross Value Added) is forecast to increase by only 0.7% in 2016.
Growth in real gross fixed capital formation (GFCF) amounted to 2.6% (q/q annualised) in the fourth quarter of 2015
compared with only 0.6% recorded in the third quarter. Owing to subdued business confidence levels, private sector capital
formation remained sluggish, registering 1.7% (q/q annualised), compared with 4.2% recorded by the public sector.
Annualised real gross fixed capital formation growth was negative in four of the nine major categories in the fourth quarter of
2015. Apart from the large decline in mining investment, financial intermediation, real estate and business services (-11.7%)
and manufacturing (-9%) also showed substantial declines. The sectors which showed the highest annualised increases in
GFCF, were electricity, gas and water (117%); community, social and personal services (6%); and general government
(5%).
South Africa’s gross external debt decreased from US$141.7 billion at the end of June 2015 to US$134.5 billion at the end
of September 2015 due to a decline in rand-denominated debt over the period. This decline marked the third consecutive
quarterly decrease in South Africa’s gross external debt position, having previously increased steadily from September
2013. However, expressed in rand terms, South Africa’s external debt rose from R1.734 billion at the end of June 2015 to
R1.858 billion at the end of September 2015 due to the depreciation in the exchange rate of the rand. South Africa recorded
a Government Debt to GDP of 50.10% of the country's Gross Domestic Product in 2015.
In February 2016, headline consumer prices increased by 1.4% over the previous month which was lower than January’s
2.6% increase. Headline CPI inflation amounted to 7% (y/y), up from 6.2% (y/y) recorded in January 2016. The March
21You can also read