STRATEGIC PLAN Towards the implementation of a Smart District - 2019-20 TO 2023-24 - Aspire Aspire Aspire
←
→
Page content transcription
If your browser does not render page correctly, please read the page content below
STRATEGIC PLAN                   2019-20 TO
                                 2023-24

Towards the implementation of
              a Smart District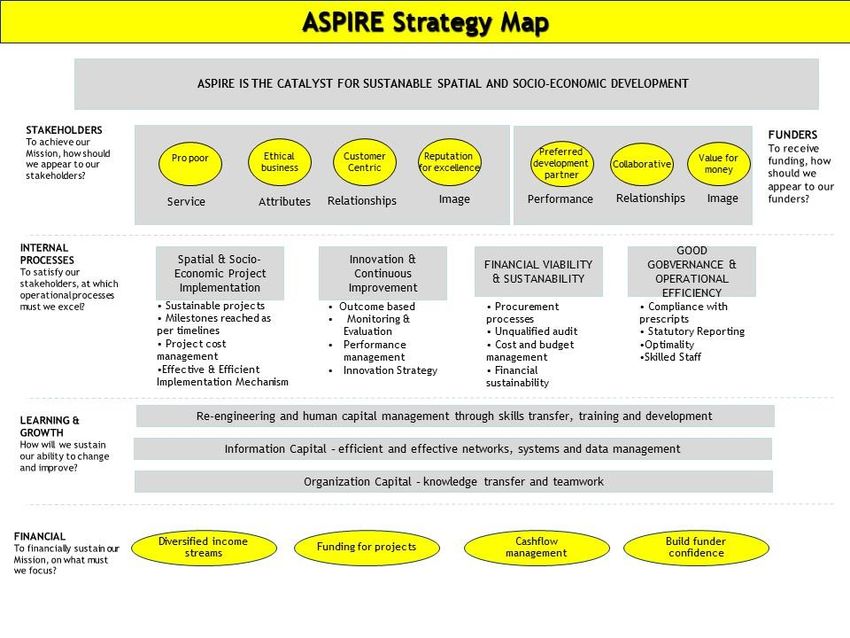
TABLE OF CONTENTS
TABLE OF CONTENTS ...................................................................................... 1

PART A: STRATEGIC OVERVIEW ........................................................................... 6

1    VISION ................................................................................................... 6

2    MISSION ................................................................................................. 6

3    VALUES .................................................................................................. 6

4    MANDATES .............................................................................................. 7

4.1 CONSTITUTIONAL MANDATES ......................................................................... 7

4.2 LEGISLATIVE MANDATES ............................................................................... 7

     4.2.1 THE COMPANIES ACT ........................................................................... 7

     4.2.2 MUNICIPAL SYSTEMS ACT 32 OF 2000 ........................................................ 8

     4.2.3 MUNICIPAL FINANCE MANAGEMENT ACT 56 OF 2003 ...................................... 8

4.3 POLICY MANDATES ..................................................................................... 9

     4.3.1 NATIONAL DEVELOPMENT PLAN (NDP) AND VISION 2030.................................. 9

     4.3.2 EASTERN CAPE VISION 2030 .................................................................. 10

     4.3.3. AMATHOLE DISTRICT MUNICIPALITY VISION 2058 ........................................ 12

     4.3.4. ADM DISTRICT-WIDE ECONOMIC GROWTH AND DEVELOPMENT STRATEGY TOWARDS
     2030 .................................................................................................... 15

PART B: OVERVIEW OF THE AMATHOLE DISTRICT ..................................................... 21

1.   KEY DEMOGRAPHIC AND SOCIO-ECONOMIC HIGHLIGHTS ........................................ 21

                                                       1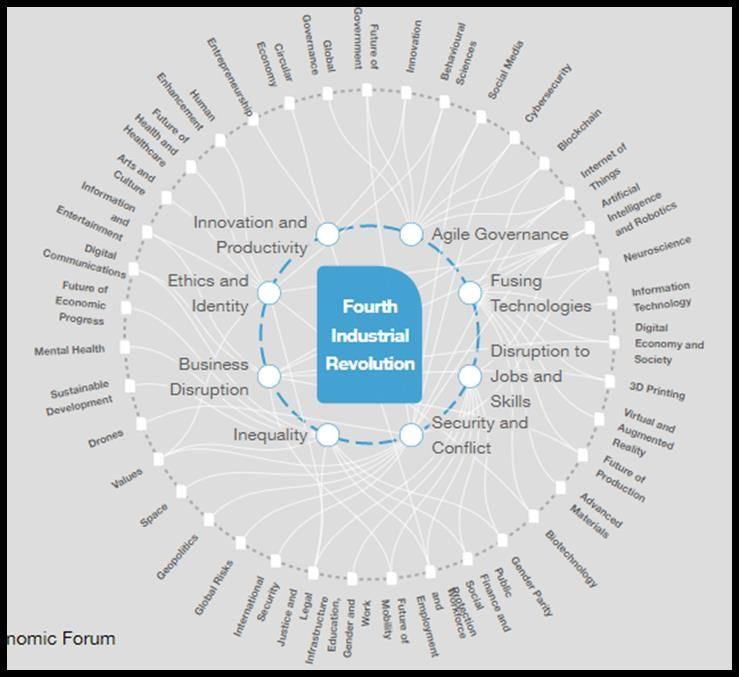
1.1. POPULATION AND HOUSEHOLDS ............................................................. 22
1.2. GROSS DOMESTIC PRODUCT (GDP) .......................................................... 24
1.3. GROSS VALUE ADDED BY ECONOMIC SECTOR .............................................. 25
1.4. LABOUR ......................................................................................... 26
1.5. INCOME.......................................................................................... 28
1.6 DEVELOPMENT .................................................................................... 29
1.7 EDUCATION ....................................................................................... 30
1.8 HEALTH ............................................................................................ 31
1.9 CRIME .............................................................................................. 31
1.10 TOURISM ......................................................................................... 32
1.11 INTERNATIONAL TRADE ........................................................................ 32
2. DRIVERS FOR CHANGE ............................................................................... 32
PART C: PROFILE OF ASPIRE .............................................................................. 47
1. STAKEHOLDER ANALYSIS ............................................................................. 47
2. ORGANISATIONAL ANALYSIS ......................................................................... 50
3. SWOT ANALYSIS ....................................................................................... 52
PART D: STRATEGIC PLANNING PROCESS ............................................................... 54
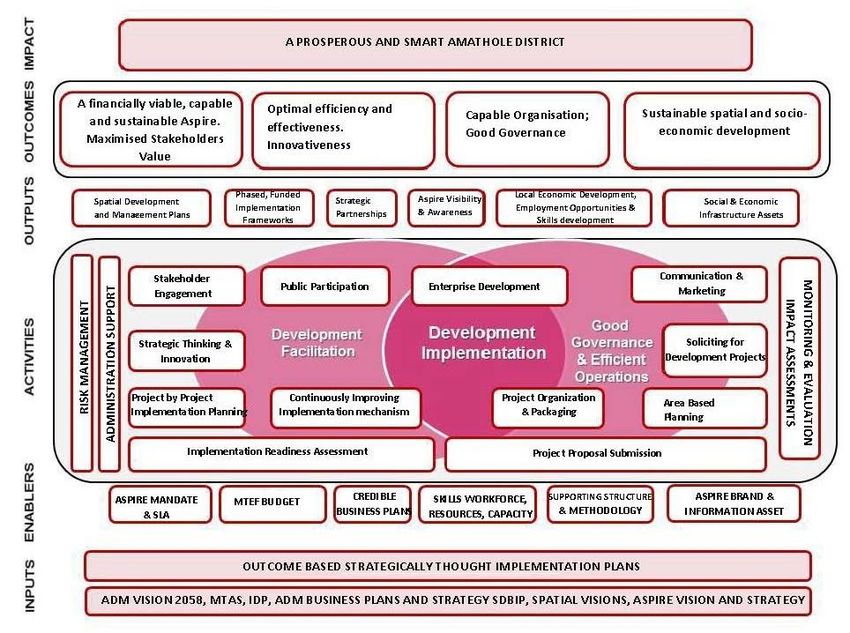
1 STRATEGIC OUTCOME-ORIENTATED GOALS ....................................................... 55
2. STRATEGIC OBJECTIVES ............................................................................. 62
3. STRATEGIC OBJECTIVES ............................................................................. 64
4. RESOURCE MOBILISATION............................................................................ 68
5. RISK MANAGEMENT ................................................................................... 69
2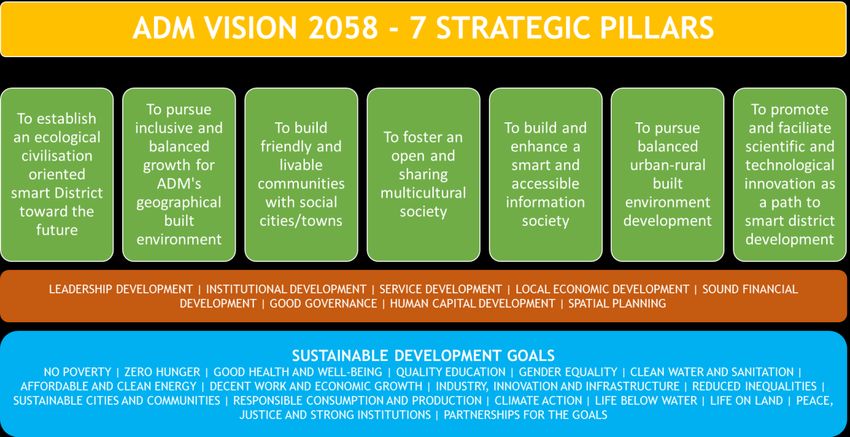
PART E: FINANCIAL PLAN ................................................................................. 70

1    ASPIRE’S FINANCIAL PLAN ........................................................................... 70

1.1 THREE YEAR FINANCIAL PLAN ....................................................................... 71

2    POLICIES ............................................................................................... 74

3    FINANCIAL MANAGEMENT ............................................................................ 75

4    CASH FLOW POSITION ................................................................................ 76

5    FINANCIAL SUSTAINABILITY ......................................................................... 76

6    CONCLUSION .......................................................................................... 77

                                                       3
List of Figures

Figure 1: Amathole District Municipality Vision 2058 – 7 Strategic Pillars ................................... 13
Figure 2: Revenue by Source ....................................................................................... 73
Figure 3: Expenditure Forecast by Department ................................................................. 74

                                                          4
List of Tables

Table 1: Budgeted Income for 2019/20 – 2021/22 MTREF ..................................................... 72
Table 2: Expenditure Forecast by Department .................................................................. 73
Table 3: Liquidity Ratio ............................................................................................. 75
Table 4: ASPIRE’s Cash flow ........................................................................................ 76

                                                           5
PART A: STRATEGIC OVERVIEW

1 VISION

ASPIRE’s vision alignment contextualises the Districts’ vision within an implementation model Amathole
District Municipality: Commitment towards selfless, excellent and sustainable service to all our
communities.

                     ASPIRE: A PROSPEROUS AND SMART AMATHOLE DISTRICT

2 MISSION
The catalyst to promote and implement sustainable spatial and social economic development in the
Amathole District.

3 VALUES

      INTEGRITY                                                                     PASSION FOR
                                  UBUNTU               ACCOUNTABILITY
                                                                                   DEVELOPMENT

   •Ethical behaviour       •Dignity and respect        •Professionalism,            •Pro poor
     •No corruption            for each other,            inclusivity and           •Selflessness
  •Capital stewardship          communities,               transparency
                                environment,             •Responsibility
       •Honestry
                                diversity and
                                   culture
                            •People first (Batho
                                    Pele)

                                                   6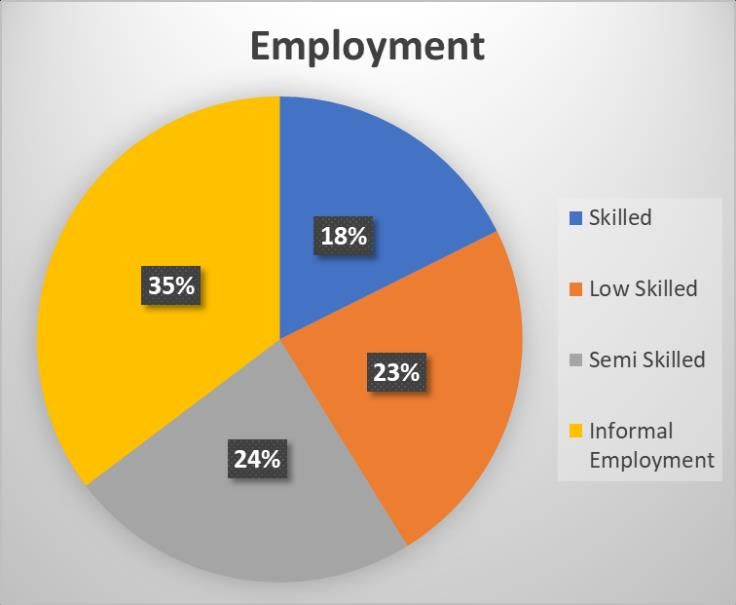
4 MANDATES

ASPIRE, an incorporated municipal entity with limited liability as defined in section 1 of the Systems Act
32 of 2000 and section 1 of the Companies Act 71 of 2008, was established in accordance with section
84 of the Municipal Finance Management Act 56 of 2003, falling under the sole ownership of the Amathole
District Municipality. As an entity of the District Municipality, there are a number of legislative and
regulatory prescripts that govern ASPIRE. These prescripts are further augmented by the
recommendations of the King IV Code of Conduct which require a high standard of ethical conduct of
both the executive and non-executive directors of the company.

4.1 CONSTITUTIONAL MANDATES

ASPIRE’s strategic intentions and objectives are guided by the requirements of Chapter 2, sections 27-
29 of the Constitution of the Republic of South Africa. This constitutional mandate requires the Agency
to contribute towards the promotion and implementation of local economic development initiatives
which result in economic growth and development in the Amathole District. ASPIRE attempts to fulfil
this mandate by working closely with the parent municipality, local municipalities and other
stakeholders, in the areas of economic activity and commercial production.

4.2 LEGISLATIVE MANDATES

4.2.1 The Companies Act

The Companies Act provides for the incorporation, registration, organisation and management of
companies. It also stipulates the roles and responsibilities of the directors of a company in respect of
governance, oversight and performance.       ASPIRE is required to comply with the provisions of the
Companies Act with the ultimate goal being the sound and sustainable management of available
resources in the achievement of the ASPIRE strategic objectives.

                                                    7
4.2.2 Municipal Systems Act 32 of 2000

The Municipal Systems Act No 32 of 2000 provides for the core principles, mechanisms and processes
that are necessary to enable municipalities to move progressively towards the social and economic
development of communities and ensure universal access to essential services that are affordable to all.
The Act goes on to describe the core processes or elements that are essential to realising a truly
developmental local government system. These include participatory governance, integrated
development planning, performance management and reporting, resource allocation and organisational
change. This Act has very defined implications for LED in terms of the operational procedures, powers
and management systems which in themselves can be regarded as mechanisms to promote pro-poor
development.

Municipalities are specifically required to involve communities in the affairs of the municipality, to
provide services in a financially and sustainable manner and to promote development in the
municipality. In terms of LED, this may be promoted through the provision of special tariffs for
commercial and industrial users. A further LED provision provides that municipalities may establish
service utilities or acquire ownership of a company which renders a municipal-type service.

Parent municipalities and municipal entities are governed by Chapter 8A of this act, which provides the
framework for the types of municipal entities that may be established, the governance of the municipal
entity in terms of the appointment and removal of directors and municipal representatives and the
duties of the directors and the appointment of a chief executive officer. The act also provides a code
of conduct for the directors and staff of the municipal entity. ASPIRE directors and staff are required
to abide with the Code of Conduct.

4.2.3 Municipal Finance Management Act 56 of 2003

The objective of this Act (2003) is to secure sound and sustainable management of the fiscal and financial
affairs of municipalities and municipal entities by establishing norms and standards and other
requirements for:

                                                    8
•   Ensuring transparency, accountability and appropriate lines of responsibility in the fiscal and
       financial affairs of municipalities and municipal entities;
   •   The management of their revenues, expenditures, assets and liabilities and the handling of their
       financial dealings;
   •   Budgetary and financial planning processes and the coordination of those processes with the
       processes of organs of state in other spheres of government;
   •   Borrowing and the handling of financial problems in municipalities; and
   •   Supply chain management and other financial matters.

The institutions, to which the Municipal Finance Management Act applies, as stipulated in Section 3 of
the Act, are all municipalities, all municipal entities and national and provincial organs of state to the
extent of their financial dealings with municipalities. It is, therefore, necessary that local municipalities
adhere to the financial procedures presented in the Act when engaging in financial matters relevant to
any LED activities. Chapter 10 of the MFMA provides a framework for the establishment and management
of a municipal entity and outlines the key requirements which ASPIRE must comply with, specifically
with issues relating to financial governance, the fiduciary duties of accounting officers, the monitoring
of performance of the entity, reporting and the duties of finance officials and delegations in respect of
financial matters.

4.3 POLICY MANDATES

Whereas legislation provides the broad mandates, national and provincial policies and frameworks give
effect as to how the legislative mandates should be implemented. They specify the desired outcomes
that the state wishes to achieve to foster a country beneficial to all.

4.3.1 National Development Plan (NDP) AND VISION 2030

The National Development Plan 2030 aims to unite South Africans, unleash the energies of its citisens,
grow an inclusive economy, build capabilities and enhance the capability of the state and leaders
working together to solve complex problems. As a long-term strategic plan, the NDP serves four broad
objectives:

                                                     9
• Providing overarching goals for what needs to be achieved by 2030;
• Building consensus on the key obstacles to achieve these goals and what needs to be done to
overcome any obstacles;
• Providing a shared long-term strategic framework within which more detailed planning can take
place in order to advance the long-term goals set out in the NDP; and
• Creating a basis for making choices about how best to use limited resources.
The plan aims to ensure that all South Africans attain a decent standard of living through the elimination
of poverty and reduction of inequality by 2030. The core elements of a decent standard of living
identified in the plan are housing, water, electricity and sanitation; safe and reliable public transport;
quality education and skills development; safety and security; quality health care; social protection;
employment; recreation and leisure; clean environment and adequate nutrition.
Given the complexity of national development, the plan sets out six interlinked priorities:
• Uniting all South Africans around a common programme to achieve prosperity and equity.
• Promoting active citisenry to strengthen development, democracy and accountability.
• Bringing about faster economic growth, higher investment and greater labour absorption.
• Focusing on key capabilities of people and the state.
• Building a capable and developmental state.
• Encouraging strong leadership throughout society to work together to solve problems.
4.3.2 Eastern Cape Vision 2030
The provincial vision and long-term plan are intended to mobilise all citisens and sectors of the Eastern
Cape around a common vision. The aim is to provide an opportunity for revisiting social partnerships and
development of common goals among citisens, the state and the private sector. The plan promotes
mutual accountability between the state, citisens and private sector and enable coherence of the three
spheres of the state.
10The plan addresses the following priorities:
• Redistributive, inclusive and spatially equitable economic development and growth;
• Quality Health;
• Education, Training & Innovation; and
• Institutional Capabilities.
This set of priorities gives rise to the following five goals of the Vision 2030 PDP:
• Goal 1: A growing, inclusive and equitable economy which seeks to ensure a larger and more
efficient provincial economy; more employment; and reduced inequalities of income and wealth;
• Goal 2: A healthy population through an improved health care system for the Eastern Cape;
• Goal 3: An educated, innovative citisenry. This goal seeks to ensure that people are empowered
to define their identity, are capable of sustaining their livelihoods, live healthy lives and raise
healthy families, develop a just society and economy, and play an effective role in the politics
and governance of their communities and nation;
• Goal 4: Vibrant communities. This goal seeks to generate a shift from the focus on state-driven
quantitative housing delivery that has trumped the need for people to make own decisions, build
their own livable places and transform spatial patterns as basis for vibrant and unified
communities; and
• Goal 5: Capable, conscientious and accountable institutions. This goal seeks to build capable,
resilient and accountable institutions to enable and champion rapid inclusive development.
The provincial priorities for 2017/18 have been pronounced as follows by the Premier of the Eastern
Cape:
• Province response to the economic downturn and economic uncertainty, particularly through
improving efficiency in budget expenditure, reduction in the ratio of compensation of employees
to total budget and increased revenue generation.
• Development and implementation of a Provincial Spatial Development Framework, including
o Small town revitalisation
o Local economic development
11o Integrated Human Settlements and o Improved roads network infrastructure
• Improved integration of government programmes and functional local government.
• Transforming agriculture (including aquaculture, fisheries and forestry)
• Improving the effectiveness of provincial institutions (departments and entities)
• Drive the seven-point education plan.
• Improving provincial infrastructure through the Rapid Response Team and the implementation of
the 2030 Infrastructure Plan.
• ICT in the province, including Bhisho campus network; broadband and use of transversal
contracts.
• Improve health profile of province
4.3.3. Amathole District Municipality Vision 2058
The ADM Council adopted a Long-Term Vision for the District – Vision 2058 with the aim of bringing new
opportunities and fostering cooperation between stakeholders, spheres of government and their
residents, to improve the quality of life, make municipal services more efficient, promote economic
growth and job creation. The Vision 2058 has been initiated by the Municipal Turnaround Strategy which
is bold in its decision-making, and financially sustainable towards Building Public Confidence through an
improved organisational culture. The District will continue to work in collaboration with government
departments and other entities to accelerate the provision of desired services to the communities of
Amathole District Municipality to realise a legacy-driven better quality of life for its citisens. The ADM
Smart District Vision 2058 implementation model promotes a swift change on the structure and form to
attain a viable and economical Municipality, and is illustrated below:
12Figure 1: Amathole District Municipality Vision 2058 – 7 Strategic Pillars
The comprehension of the smart district environment vision for Amathole District Municipality towards
2058 indicated above will not be an easy task as it will only be possible with the dedication of all citisens
and with the help of smart districts environment development partners and the establishment of a
tailored Programme Management Office. In doing so, Amathole District Municipality must be prepared
to face the challenges ahead. Any digressions from the pathway will possibly lead the continent to a
detrimental future of economic deterioration, political instability and extensive poverty.
This has resulted in the finalisation of ADM’s Vision 2058 – Towards a Smart District, which boldly
embraces the challenges of the 4th Industrial Revolution. It recognises that innovative technological
advancement is a key driver pushing for change. Together with infrastructure development and socio-
economic development, these key drivers motivate for a paradigm shift in the way that the district
responds to the challenges of the future. Vision 2058 seeks to build a SMART district utilising the
technologies of the 4th Industrial Revolution. The 4th Industrial Revolution is a reality and has the effect
of blurring the lines between the physical, digital and biological spheres of society.
13In addressing the future, ADM states as it’s visions to reach this ideal state:
VISION 1
OUR GROWING, THRIVING AND SMART DISTRICT
VISION WILL ENSURE TO BE ONE OF SOUTH AFRICA’S MOST
DYNAMIC RURAL ECONOMIES WHERE FAMILIES,
ONE BUSINESSES, LOCAL MUNICIPALITIES AND WARDS
THRIVE
VISION 2
OUR AMATHOLE SMART DISTRICT
VISION WILL BE THE MOST SUSTAINABLE DISTRICT IN SOUTH
TWO AFRICA AND A REGIONAL LEADER IN THE FIGHT
AGAINST CLIMATE CHANGE.
VISION 3
OUR JUST AND EQUITABLE AMATHOLE DISTRICT
VISION MUNICIPAL AREA WILL HAVE AN INCLUSIVE,
EQUITABLE ECONOMY THAT OFFERS WELL-PAYING
THREE JOBS AND OPPORTUNITY FOR ALL TO LIVE WITH
DIGNITY AND SECURITY
VISION 4
OUR RESILIENT DISTRICT,
OUR NEIGHBOURHOODS, OUR ECONOMY, AND PUBLIC
VISION
SERVICES ARE READY TO WITHSTAND AND EMERGE
FOUR STRONGER FROM THE IMPACTS OF CLIMATE CHANGE
AND OTHER 21ST CENTURY THREATS
14Vision 2058 identifies Smart District solutions, in the form of Mega Catalytic Projects, to bring new
opportunities and foster cooperation between stakeholders, local government and their residents, for
the achievement of economic growth, with the ultimate impact being to Increase the quality of life,
make municipal services more efficient and promote economic growth and job creation. The mega
catalytic projects identified by ADM include:
• Integrated Sea Water Desalination Plant
• Integrated Transport Systems
• Broadband Connectivity
• World Class Sports Academy
• STEM Skills Academy
• Training Academy
• Waste Management
• Small Town Revitalisation
• Revitalisation of Irrigation Schemes
• Revitalisation of Crop Plantations
• World Class Disaster Management Centre
4.3.4. ADM District-Wide Economic Growth and Development Strategy Towards
2030
The Economic Growth and Development Strategy is underpinned by Amathole District Municipality 2058
visions, which charts the direction for the development of the district. The vision is one of a common future,
a future in a rural district community that will ensure economic well-being, improvement of the standards
of living and quality of life, freedom and social justice and peace and security for the people of Amathole.
This shared economic development vision is anchored on common values and principles and the historical
and cultural affinities that exist between the people of Amathole. The purpose of Economic Growth and
Development Strategy is to ensure an achievable, realistic and sought-after future that could become the
foundation for Amathole District’s wealth creation and smart environment development. In order to achieve
this, the strategy is based on the following priorities:
15• Embracing shared value: The central premise being that the competitiveness
of Amathole District business and the health of our communities (and economy
around it) are mutually dependent. It is a fundamental business philosophy
that recognises that profit and purpose can co-exist and be mutually
reinforcing.
• Promoting partnerships: Local government and business, both local and
international, need to become partners both in embracing a philosophy of shared
value as well as driving a common agenda of inclusive, sustainable economic
growth.
• Fostering entrepreneurship: Entrepreneurs provide one of the main engines of
growth through developing new products and services, implementing more
efficient production methods, and creating new business models and industries,
becoming the main drivers of job creation required to realise inclusive,
sustainable economic growth.
• Accelerating regional integration: By driving greater regional coherence to
achieve stronger regional institutions the promotion of greater levels of
regional investment and trade will be easier and more efficient to conduct
cross-border business, and will create markets with greater critical mass,
coherence and density of economic activity.
• Bridging the infrastructure gap: Sufficient investment in 4th Industrial
Revolution infrastructure; road networks, electricity access,
telecommunications, and trade infrastructure (such as ports, highway
corridors and railroads) will physically connect markets, reduce the cost
of delivered goods, facilitate the mobility of people and products,
remove productivity constraints, and enhance overall competitiveness.
16The strategy incorporates the following:
• Economic Development which is organised around the principles of growth, equity, sustainability,
and resiliency to ensure that a SMART District dream of becoming South Africa’s most dynamic
economy where businesses, families, municipalities and wards thrive, is realised:
o Equity – individuals of all races, incomes, ages, genders and other social identities have
equal opportunities to live full, health and productive lives
o Health – every person deserves the opportunity to live the healthiest life possible,
regardless of who they are or where they may live
o Prosperity – an increased standard of living for everyone
o Sustainability – a new relationship with nature to ensure a life-sustaining natural
environment will nurture both current and future generations
• Planning and development of revenue sources to realise the vision of poverty eradication, and
all other related challenges, thereby improving the lives of the people within ADM.
• Economic growth scenarios which will be used to identify possible weak signals or disruptive
events, which can then be incorporated into long-range planning for development. These
disruptive events may include such issues as climate change, service delivery protests and the
4IR.
• Game Changers - Green Infrastructure Initiatives which make better utilisation of technology and
data, adopt a participatory budgeting process and ensure residents have more influence in
decision-making. All the 60 game-changes take cognisance of the impact that globalisation and
the 4IR will have on the district and, as such, all incorporate the 4 principles.
17Further to this, five sector plans that are in line with the Economic Growth and Development Strategy
have been developed. The main purpose of these sector plans is to ensure that the bulk of the population
in Amathole District Municipality benefits in the economic development section.
These sector plan address the following:
• Tourism and Heritage Sector Plan
Amathole District Municipality is home to many tourism and heritage attractions dating back in
history. The plan identifies the opportunities and how best their potential can be maximised in
a sustainable manner.
18• Agriculture Sector Plan
Amathole District Municipality has abundant arable land but statistics show that Amathole
contributes only 3% to the GVA. This can be attributed to the lack of interest shown towards
agriculture and the high rate of outward migration by the economically active group. The plan
intends to unlock sustainable agricultural opportunities that will assist commercialisation of the
emerging farmers.
• Poverty Eradication Strategy
Demographics indicate that approximately 80% of Amathole District Municipality residents are
living in poverty or near poverty. This strategy intends to find ways and means of successfully
fighting poverty within the district, through the effective use of key partnerships.
• Enterprise Development Strategy
Many of Amathole District Municipality’s residents are engaged in informal trading, however their
products are often of poor quality. The strategy aims to assist these informal traders to become
commercially viable and self-developing through the establishment of Incubators, SMMEs and
Cooperatives, with the ultimate purpose of improving the lives of those traders.
• Rural Development Strategy
Amathole District Municipality forms part of the Eastern Cape which is one of the largest and
poorest provinces in South Africa. It is one of the poorest performing provinces (and districts) in
terms of economic activity and is viewed as lagging behind in becoming the economic
powerhouse of South Africa. This strategy attempts to change this status quo and aims to
improve the livelihoods of Amathole residents through the provision of various economic
opportunities.
The Economic Growth and Development Strategy recognises the importance of:
• science and technology in developing and strengthening systems of innovation in order to provide
scientific and technological solutions for sustainable local socio-economic development, district
integration and poverty eradication with the aim of increasing competitiveness;
• information as a resource and a tool for development through the use of computers in all aspects
of life, as well as being recognised as a key factor for regional integration and development,
globalisation and modernisation;
19• the need to ensure equitable and sustainable use of the environment and natural resources for
the economic benefit of present and future generations;
• the private sector in the policy and economic strategy formulation and development programme
implementation in order to accelerate and achieve sustainable district economic integration and
poverty eradication;
ASPIRE development agency as a facilitator, promotor and implementer of economic growth and
development initiatives and in assisting the ADM in realising its dream of Smart District, ASPIRE has been
mandated with the implementation of the identified mega projects.
In response to Vision 2058 and the Economic Growth and Development Strategy, the ADM have also
identified the need for the establishment of a project management office (PMO) whose roles will include
the development and finalisation of policy, business concepts, feasibility studies and business proposals
with the ultimate aim of increased resource mobilisation for the realisation of a SMART District.
20PART B: OVERVIEW OF THE AMATHOLE DISTRICT
The Amathole District is situated in the central part of the Eastern Cape, stretching along 200kms of
coastline from the Fish River Mouth to just south of Hole in the Wall. It is bordered in the north by the
Amathole mountain range, which together with its other natural resources in the form of grasslands,
estuaries, forests, waterfalls and beaches, give it its distinctly rural nature.
The district consists mainly of rural villages and small towns and covers a land area of 23,577 kms2.
Cities and Towns within its border include: Adelaide, Alice, Amathole Coastal, Bedford, Butterworth,
Cathcart, Dutywa, Elliotdale, Fort Beaufort, Hamburg, Hogsback, Kei Mouth, Kei Road, Keiskammahoek,
Kentani, Komga, Middeldrift, Morgan Bay, Ngqamakhwe, Peddie, Seymore, Stutterheim, Willowvale.
The main economic sectors of the area include: Community services (44%), finance (19%), manufacturing
(14%), trade (13%), transport (4%), agriculture (3%), construction (2%).
1. KEY DEMOGRAPHIC AND SOCIO-ECONOMIC HIGHLIGHTS
A number of demographic and socio-economic characteristics for the Amathole District, as compared to
the Eastern Cape in which Amathole is situated, as well as in the context of South Africa, provide an
21overall analysis of the district in terms of demographics, development, household infrastructure, labour,
income and expenditure, economy, tourism and international trade. These key indicators, as per the
2016 ECSECC figures, are compared to 2006 figures, in order to establish a trend with the aim of
providing a possibly projection for the future. In so doing, this provides a comprehensive overview of
the district.
1.1. Population and Households
The Amathole district houses 1.5% of South Africa’s total population, ranking Amathole as the most
populous district municipality in 2016. With a 52:48 female to male ratio split, as a result of males
leaving the region to seek work elsewhere, the population is largely African (97.44%), with the largest
share thereof consisting of babies and children in the 0-14 years of age category (32.6%). There is
approximately 163 000 youth, classified as those between the ages of 15 and 25 years old in Amathole.
Based on current statistics, Amathole’s population is projected to grow at an average annual rate of
0.54% to a total of 898,000 in 2023.
Population
density (number Number of
Year Total Population
of people per households
km²)
South Africa 2006 47,800 13,000
2016 56,455 45.6 15,800
2023 Projection 61,309 17,583
Eastern Cape 2006 6,450 1,570
2016 7,023 41.4 1,790
2023 Projection 7,366 1,945
Amathole DM 2006 893 218
2016 862 40.8 227
2023 Projection 898 233
22The district’s population rose steadily in the last year reaching 862 000 in 2016. This equated to a
population growth rate of 0.4% between 2006 and 2016. Amathole District Municipality further has the
highest old-age dependency ratio in the province. The high overall and old age dependency ratios are
worth noting for Amathole as this implies increased pressure on the productive population to support
dependents. It indicates a smaller base to draw taxes on to support state interventions for the youth
and age. This measure, however, is premised on the assumption that those over the age of 65 years’
lack other sources of income. The number of households over the 10-year period increased, indicating
a growth rate of 1.55%. This indicates that the average household size is decreasing based on the fact
that the number of households is growing at a faster rate than the population growth. Of these
households, approximately 52.8% live in formal dwellings, while a further 41.7% live in traditional
dwellings (DBE, 2016).
In the Amathole District, an analysis of households reveals the following:
• Dwelling: Formal – 53.98%. The balance of 46.02% reside in informal, traditional or other
dwellings (tents/caravans)
• Sanitation: Flush toilet – 27.4%. A total of 57.9% utilise some form of pit toilet, whilst 13.4%
have no access to a toilet
• Water: Piped water (inside/in yard) – 39.07%. A total of 32.21% have no formal piped water and
obtain water via water carriers, rain water, boreholes, rivers and springs.
• Electricity: none – 20.17%
• Waste management: No refuse removal – 10.9%. The balance of 89.1% have their waste removed
by a local authority (20.37%) or remove it themselves (68.73%).
Amathole has the third highest number of traditional Amathole dwelling type dwellings in the province.
This represents a slight improvement from 2010 when 94.5% of households were classified as living in
either a formal (52.3%) or traditional (42.2%) dwelling (DBE, 2016). Whilst much has been done to reduce
the backlogs in respect of household infrastructure over the 10-year period, a large amount of work is
still required.
231.2. Gross Domestic Product (GDP)
The gross domestic product of a region represents the value of all goods and services produced within
that region, over a period of one year, plus taxes and minus subsidies. It can be measured using constant
or current prices, where current prices measure the economy in actual Rands, whilst constant prices
measure the economy by removing the effect of inflation.
Year Gross Domestic Product – Gross Domestic Product – %
Current prices change - Constant Prices
South 2006 1,839.4 5.30%
Africa
2016 4,338.9 0.28%
2016-2023 3.00%
Projection
Eastern 2006 142.2 5.30%
Cape
2016 337.8 0.25%
2016-2023 4.00%
Projection
Amathole 2006 12.7 3.70%
DM
2016 27.9 -0.39%
2016-2023 38.74 1.39%
Projection
With a GDP of R27.9 billion in 2016 (up from R12.7 billion in 2006), the Amathole District contributed
8.26% to the GDP of the Eastern Cape. This was slightly lower than the 8.91% in 2006. At a national
level, Amathole contributed 0.69% in 2006 which dropped to 0.64% in 2016. In 2016, Amathole District
achieved an annual growth rate of -0.39% which is significantly lower than that of the Eastern Cape of
0.25% and nationally at 0.28%.
24The longer-term GDP growth rate of Amathole District is projected to be significantly lower at 1.39%
when compared to the Eastern Cape rate of 4% and national rate of 3%. Amathole had a comparatively
small economic output in 2015, having the 3rd lowest GVA-R in the Eastern Cape. Amathole produced
R14.5 billion in GVA-R output in 2015; this was up 1.6% on the 2014 figure. The largest sectoral
contribution to GVA-R came from the tertiary sector at R12.4 billion. The primary sector contributed
R493.0 million and the secondary sector contributed R1.6 billion. GVA-R growth was experienced by all
but the primary sector between 2014 and 2015, with this sector contracting by 4.1%. In comparison, the
secondary and tertiary sectors grew by 4.3% and 1.5%, respectively. Amathole contributed only 6.9% of
the total Eastern Cape GVA-R and was the 6th largest contributor (IMF, 2016).
1.3. Gross Value Added by Economic Sector
The Amathole District Municipality's economy is made up of various
industries. The GVA-R variable provides a sector breakdown, where
each sector is measured in terms of its value added produced in the
local economy. In 2016, the community services sector was the
largest accounting for R9.09 billion or 36.2% of the total GVA in the
district. The sector that contributes the second most was the trade
sector at 22.1%, followed by the finance sector with 18.7%. The
sector that contributes the least to the economy is the mining sector
with a contribution of R 46.9 million or 0.19% of the total GVA (IMF,
2016). The community sector, which includes the government
services, is generally a large contributor towards GVA in smaller and
more rural local municipalities.
25GROSS VALUE ADDED BY BROAD ECONOMIC SECTOR
Sector Average 2023 Projection
2006 2016 Annual Growth
2006-2016
Agriculture 0.35 0.39 1.11% 0.42
Mining 0.07 0.06 -1.18% 0.06
Manufacturing 1.55 1.47 -0.56% 1.45
Electricity 0.29 0.18 -4.51% 0.18
Construction 0.43 0.57 2.82% 0.57
Trade 3.34 3.76 1.18% 3.76
Transport 1.00 1.08 0.72% 1.08
Finance 2.62 3.33 2.43% 3.32
Community Services 6.35 6.42 0.12% 6.47
Total 16.01 17.26 0.76% 17.31
The agriculture sector is expected to grow the fastest, whilst the community services sector is expected
to make up the largest sector within the district by 2023. The mining sector is estimated to grow the
slowest. The expected growth rates of the primary, secondary and tertiary sectors are 3.01%, 1.4% and
1.33% respectively from 2016 to 2023. When considering the location quotient for the various sectors,
which reflects a comparative advantage in a sector if the location quotient is larger than the national
economy, Amathole has a comparative advantage in the community services, agriculture and trade
sectors.
1.4. Labour
With respect to employment, Amathole had an official unemployment rate of 34.8%5 (5.3% higher
than the provincial average of 29.5%). This equated to 91 216 unemployed people within the district.
Of those employed in Amathole, 103 681 were formally employed which was approximately 64.4% of
the labour force. This was 5.5% lower than the provincial average of 69.9%.
26There was also a notable informal sector, which
employed 67 376 people, or 35.6% of the employed
population. This was higher than the province, where
30.3% of employment was informal. The economically
active population in Amathole in 2016 was an estimated
190,000 people which is an increase from the estimated
184,000 people in 2006. This is an increase from 20.6%
in 2006 to 22% in 2016. The participation rate, which is
the percentage of the working age population that is
economically active, also increased from 35.9% to 37.8%
over the 10-year period. This percentage rate change
was higher than that of the Eastern Cape (0.35%) but slightly lower than the national rate change of
2.4%.
(informal and
Unemployme
Participation
employment
Working age
Population
population
formal)
Total
Total
Year
Rate
EAP
nt
2006 47,800 31,071 17,5 56.4% 13,00 25.8
South Africa
00 0 %
2016 56,455 36,220 21,3 58.8% 15,70 26.3
00 0 %
2006 6,450 3,866 1,84 47.6% 1,330 27.8
Eastern Cape
0 %
2016 7,023 4,289 2,06 47.9% 1,460 29.3
0 %
2006 893 512 184 35.9% 134 35.6
Amathole DM
%
2016 862 502 190 37.8% 141 36.0
%
27Total employment in 2016, which includes both the formal and informal sectors, was comprised of
104,000 formal employees and 37,000 informal employees. Employment within Amathole increased
annually over the 10-year period at an average annual rate of 0.51%. Unemployment over the same
period, however increased marginally from 35.6% to 36%. This is below the percentage increase at both
a provincial and national level.
1.5. Income
Year Total Per Capita
Index of
Personal Income
Buying
Income (R (Rands)
Power
billions)
South Africa 2006 1,259 27,000
2016 2,995 53,800 1.00
Eastern Cape 2006 106.6 18,000
2016 264.5 37,800 0.09
Amathole DM 2006 10.0 11,000
2016 24.8 28,000 0.01
Over the period 2006 to 2016, the number of households living on R30,000 or less per annum, decreased
from 58.1% to 19.64%. Annual total personal income, which is income from all sources, increased over
the period for the Amathole district from R10 billion to R24.8 billion. This was an average annual
growth rate of 9.53% which was higher than that of both the Eastern Cape (9.52%) and South Africa
(9.05%). Whilst per capita income increased over the period, the amount is significantly lower than
both that of the Eastern Cape and nationally.
The buying power of a region is dependent on three factors: the size of the population, the ability of
the population to spend and the willingness of the population to spend. Amathole has a low index of
buying power which suggests that the district has access to only a small percentage of the goods and
services available in all the Eastern Cape. This implies that Amathole residents are most likely spending
their income outside the district.
281.6 Development
Development refers to the advancement or improvement of residents in order that they can be uplifted
out of poverty and enjoy a long and healthy life, become educated and have a decent standard of
living.
Year Human Poverty gap Literacy Rate
Gini
Development rate
Coefficient
Index
South Africa 2006
2016 0.653 0.628 83.31%
Eastern Cape 2006
2016 0.596 0.617 77.18%
Amathole DM 2006 32.7% 60.9%
2016 0.551 0.56 30.2% 71.7%
The Human Development Index can have a maximum of 1, indicating a very high level of human
development, while the minimum value of 0, indicates no human development. When calculating this
index, factor such as education and GDP per capita are utilised. At both a national and provincial level,
the level of human development in Amathole is at a lower rate indicating that less is done to benefit
the residents of Amathole in terms of development.
The Gini Coefficient is a measure of the variance between high- and low-income earners within a
population. When income is distributed perfectly equally then the Gini coefficient would equal zero.
The Gini Co-efficient of Amathole in 2016, indicates a more equal spread of income amongst its
residents, as compared to the Eastern Cape and South Africa as a whole. The upper poverty line is the
level at which consumers can purchase sufficient food and non-food items without sacrificing one for
the other. Anyone who does need to sacrifice between these two is regarded as living in poverty.
29The poverty gap rate however, measures how far the population is from the poverty line, expressed as
a percentage. In 2006, it is estimated that the poverty gap rate was 32.7% - the rate needed to bring
all poor households up to the poverty line and out of poverty. By 2016, this had reduced to 30.2%,
which indicates improvements in the lives of Amathole residents. This improvement is also supported
by the increase in the literacy rate from 60.9% to 71.7%.
1.7 Education
Educational attainment levels in Amathole were low, with 15.4% of the population over 20 years old
having not attained any schooling in 2016. Only 13.5% of the population over 20 years had attained
Matric, and a further 6.1% had attained some form of higher education versus 19.4% and 8.6%
respectively in the Eastern Cape province. Amathole had approximately 315 629 learners enrolled across
1 614 public and private schools in 2014. This represented a decline of 52 856 learners from 2010. This
reduction in learners resulted in a corresponding decline in the number of educators which fell from 13
340 in 2010 to 11 827 in 2015. Despite these declines, the learner-to-educator-ratio improved from 27.6
in 2010 to 26.7 in 2015 (DBE, 2016).
As part of the 2016, Community Survey respondents in Amathole were asked to rate their overall
satisfaction with public schools within the district. The
overwhelming majority (52.3%) of respondents indicated
that they felt that the schools in the district were good.
However, this varied notably across the district with only
47.0% respondents in Mbhashe indicating that the quality
of public schools was good compared to 69.9% in
Amahlathi. Across the district, 1.8% of respondents
indicated that they had no access to public schools or did
not make use of public schools (1.6%).
301.8 Health
In 2014, ‘maternal mortality in-facility rate’ stood at 58.8 per 100 000 live births, which is below the
provincial average of 148.3 per 100 000 and national average of 132.5 deaths per 100 000. Amathole has
the lowest ‘maternal mortality rate’ of a district in the Eastern Cape. However, trends in this indicator
have been difficult to discern over time due to a small data sample within the district. The ‘stillbirth
rate’ has decreased from 17.1 per 1000 births to 13.4 per 1000 births, a 21.64% drop from 2013 to 2014.
The district has the second lowest stillbirth rate nationally. Child mortality can be referred to by
indicators analysing case fatality rates in diarrhoea, pneumonia and malnutrition in children under the
age of 5 years. ‘Child under 5 diarrhoea case fatality rates’ have fluctuated for Amathole DM over the
2009-2014 period, but exhibited a general improvement from 5.3% in 2013 to 3% in 2014. ‘Child under 5
pneumonia fatality rates’ have also fluctuated over this period, with the most recent at 2.6% in 2014,
below the provincial average. ‘Child under 5 malnutrition fatalities’ have increased from 8.7% to 14.1%
between 2013 and 2014, which is above provincial average. ‘Immunisation coverage of children under
the age of 1 year’ in the district is 86.6%, which is above the provincial figures of 80.9% and below the
national figures of 84.4%. ‘
TB incidence rates (all types)’ have fluctuated between 537.1 and 647.2 per 100 000 over the 2009-2013
period, with 651.5 suspected cases per 100 000 in 2014. ‘TB treatment success rates for all cases’ have
increased from 71.9% in 2012 to 78.6% in 2013, above the national average of 77.9% but below the
national target of 82%. The ‘HIV testing coverage of the population aged 15-49 years was 51.9%; this was
higher than the national average of 32.1% and the highest coverage in the province. The district was
ranked 3rd nationally for this indicator.
1.9 Crime
Whilst many acknowledge that the country has a crime problem, very little research has been done on
the level of crime. This is compounded by the fact that many crimes may go unreported. The crime
index is a composite, weighted index which measures the overall crime level for a particular year, by
allocating a weighting to the different types of crime, be they violent crimes or property crimes.
31The index is of particular importance when looking at trends over time, as it reflects the number of
crimes per 100,000 people. The overall crime rate in the Amathole District has decreased from 104.92
in 2006 to 06.6 in 2016. This is an average annual decrease of 0.82% over the period.
1.10 Tourism
People visit an area for reasons such as vacations, business, visiting friends and relatives or for other
reasons such as medical or religious reasons. During 2006, a total of 434,000 trips were made to the
Amathole region. By 2016, however, this total had been significantly reduced to 261,000. The main
reason for visiting the area was to visit with friends and family. The bulk of these visitors were domestic
tourists (91%).
Tourism spend is the total expenditure by tourists on their trip to a particular region. From 2006 to
2016, the total tourism spends increased at an average growth rate of 2.4% This is much lower than the
national rate of 7.7% indicating that tourists were opting to visit regions other than Amathole. This is
further supported by the decrease in tourism spend as a share of GDP. In 2006, tourism spend
contributed 6.2% to GDP for the district, but by 2016 this had dwindled to 3.6%.
1.11 International Trade
International trade increased from 2006 to 2016 at an average annual growth rate of 19.55%. In 2016,
Amathole had a positive trade balance to the value of R131 million. Exports as a percentage of total
GDP only amounts to 0.7%. This is way below the Eastern Cape at 16.6% and the national average of
25.5%.
2. DRIVERS FOR CHANGE
The future development of Amathole District entails a high level of complexity and uncertainty,
particularly in relation to the 4th Industrial Revolution, integrated transport, infrastructure, the new
business model economies of scale, development, technology, agriculture, tourism, energy and climate
32change issues. In addition, it also has to acknowledge the ambiguous and dynamic nature of the concept
of Amathole rural identity; and the fact that it is subject to ongoing social processes for Amathole
District Municipality towards 2030. These aspects of economic and rural development are also
highlighted by Rivera-Ferre (2008) and Davis, Giuseppe and Zezza (2017:155), who argue in favour of
“context-dependent economic for development”.
These authors also highlight the need to utilise expertise from various fields, with the collective aim of
developing solutions that will increase economic productivity, protect natural resources and livelihoods,
and minimise the sector’s negative effects on the environment and humans. This also gives an indication
of the level of complexity that development efforts in the field of economics have to deal with.
2.1. Political Drivers for Change
National, regional, and local governance relies on the values and principles that are held by the public,
as well as the political relations between the state, civil society and the private sector, even though the
purposes of these sectors vary, depending on the priorities and principles of a set social system.
Governance in political, economic, and administrative sectors, can affect expansion, which includes the
potential for sustainable environmental management, market efficiency and the understanding of basic
rights.
Good governance involves applying original policies and programmes to boost the quality of public
service with the eventual aim of increasing economic growth. Ground-breaking programmes and policies
tackle facets of governance such as transparency, participation, accountability, and professionalism.
However, the number of existing political risk factors is large, ranging from expropriation laws, acts of
terror or the announcement of war, to unexpected changes in tax regulations and sanctions arising from
trade regulations. Political risk can be defined as the probability that business will either earn less
money, or suffer losses in profit, as a result of the actions and reactions of stakeholders in relation to
events, decisions, and policies within a political system.
Although most definitions of political risk refer to the consequences of unforeseen local government
actions or interference, the local government is not the only player in the political environment that
can produce political risk factors. Firstly, political risk factors could arise through the actions or
inactions of ’executive political groups’ at the top levels of National government. Secondly, ’political
33pressure groups’ comprising of local, national or international, non-governmental organisations or
individuals, such as social groups, local and foreign competitors and community groups have the ability
to take action that could disrupt the business environment, either directly or indirectly, and, as a result,
produce political risk factors. Ultimately, the government remains the most important role-player in a
country’s political environment since it implements policies, and these policies shape the business
environment. The fact that political factors can adversely influence so many other environments makes
this driver a crucial part of an enterprise’s future success.
The political environment has undergone numerous changes in the 21st century. From a political
environment marked by ideological power struggles, territorial objectives, power-balancing clashes and
self-sufficiency, to one that revolves around economic growth, market expansion and integration,
globalisation and increased foreign direct investment and trade. One major explanation for this change
has been the geographical power shift from Western countries to countries in the East that control the
energy and oil supplies of the world. The business environment has also been impacted by governments
who have tended to become more actively involved resulting in interference with operations and
investments within their national borders. Globalisation has resulted in a world that is inter-connected
where borders no longer exist and consequently, there are numerous role-players in the political
environment. No matter what size an enterprise is, global politics could ultimately decide its success.
During 1994, South Africa made significant progress in building the structures of a democratic state.
The fragmented governance structures of apartheid have been consolidated into a system designed to
serve developmental objectives. The constitution enshrines a rights-based approach and envisions a
prosperous, non-racial, non-sexist democracy that belongs to all of its people. The country is governed
as a parliamentary democracy with numerous, identifiable, political pressure groups. These groups have
instigated strikes in the past during which the entire country has come to an economic standstill,
emphasising their crucial political pressure. The composition of the public service and local South African
Government has been transformed to represent the entire population better. The country has
successfully restructured public finances, created an effective tax system and built an independent and
credible reserve bank. Some argue that significant progress has been made in the provision of basic
services such as housing, water, and electricity.
34Whilst the foundations for a capable state have been laid, eighteen years into democracy, South Africa
remains a highly unequal society with high levels of poverty and unemployment. Foreign investors
continue to associate business in Africa with corruption and South Africa has constantly faced threats of
expropriation in the recent past, and issues surrounding land reform and the nationalisation of mines
continue to be sensitive subjects in the country. South Africa has struggled to achieve constructive
relations between the three spheres of government as a result of the lack of clarity concerning the
division and coordination of powers and responsibilities, together with the lack of coherent and
predictable mechanisms for delegating or assigning functions.
Where the public service is too insulated from political pressures, the concern is that it is failing to serve
the interests of local government and not fulfilling its democratic mandate. However, where it is
insufficiently insulated, standards for recruitment or procurement can be undermined as successful
negotiations depend on political connections rather than citisenship. No consensus on how this is going
to be resolved has been reached and a lack of leadership in finding appropriate solutions exits. These
immense challenges can only be addressed through a step-change in the country’s performance.
2.2. Economic Drivers for Change
The international economic system established after the Second World War will be almost
unrecognisable by 2025 owing to the rise of emerging powers, a globalising economy, a historic transfer
of relative wealth and economic power from West to East, and the growing influence of non-state actors.
By 2025, the international economic system will be a global, multi-polar one in which the gaps in national
power between developed and developing countries continue to narrow. Concurrent with the shift in
power among nation-states, the relative power of various non-state actors including businesses, tribes,
religious organisations, and criminal networks is increasing. At the same time, however, the world will
become more interdependent than ever before through trade, financial systems, energy
interdependence, and global communications systems. The extent to which globalisation continues to
deepen is evident when one considers that global GDP in nominal terms, almost doubled from $32.1
trillion in 2000 to $61.2 trillion in 2008.
Global institutions are also increasingly called upon to respond to global challenges such as climate
change and organised crime. Economic growth rates in numerous developing regions are higher than in
the current industrial countries indicating that the world economy will no longer be dominated by the
35You can also read