DEVELOPMENT REPORT 2019 / 2020 EDITION
←
→
Page content transcription
If your browser does not render page correctly, please read the page content below
CITY RIDGE / DEVELOPED AND OWNED BY ROADSIDE DEVELOPMENT / NORTH AMERICA SEKISUI HOUSE

  In Public-Private Partnership with
                                                                                         2019 / 2020 EDITION
                                                                                                 REPORT
                                                                                            DEVELOPMENT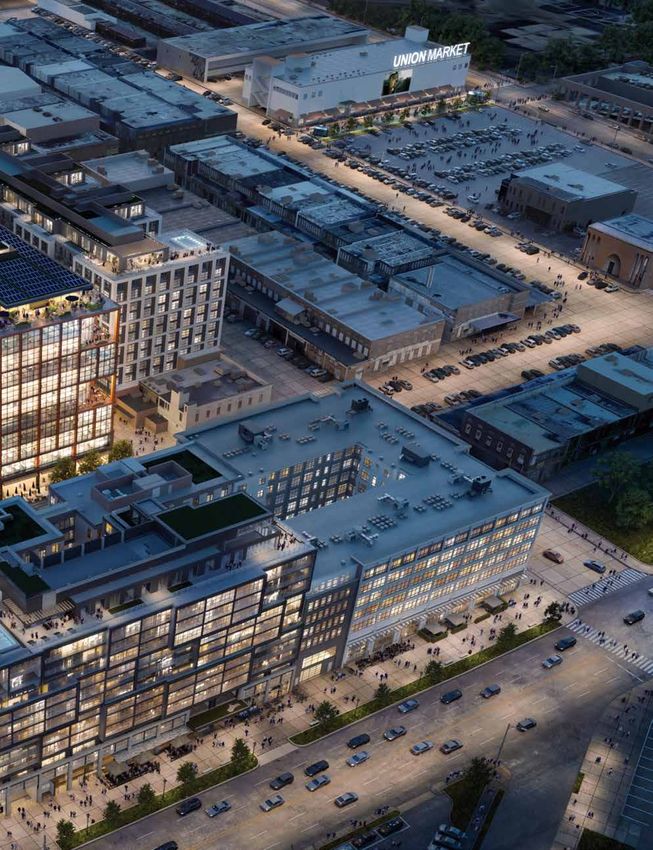
The Washington DC Economic Partnership would like to acknowledge our public and
 private sector board members whose continued financial support and guidance has
 made the Washington, DC Development Report 2019/2020 Edition possible.

PUBLIC SECTOR PARTNERS

                                                                         OFFICE OF THE CHIEF TECHNOLOGY OFFICER

PRIVATE SECTOR PARTNERS

BOARD MEMBERS

EXECUTIVE COMMITTEE                  Raj Aggarwal                                                      Daniel Duke                       Chase W. Rynd
                                     Board Chairman, Think Local First                                 Prinicipal Mid-Atlantic Region,   Executive Director,
John Falcicchio / Co-Chair           Joseph Askew                                                      Bohler Engineering                National Building Museum
Interim Deputy Mayor,                Vice President, Government Relations,                             Josh Etter                        Tara Scanlon
Office of the Deputy Mayor for       Verizon                                                           Director, Development,            Partner, Holland & Knight
Planning and Economic Development                                                                      Foulger Pratt
                                     Kristina Bouweiri                                                                                   Shawn Seaman
Richard Lake / Co-Chair              President & CEO, Reston Limo                                      Angie Gates                       Principal and Executive Vice President,
Managing Principal,                  Steven Boyle                                                      Director, OCTFME                  Hoffman & Associates
Roadside Development                 Managing Director,                                                Stan Jackson                      Annie Senatore
Omar McIntosh / Vice Chair           EDENS                                                             President & CEO, AEDC             CEO and Lead Event Designer,
Senior Vice President,               Jean-Luc Brami                                                    Norman Jemal                      Design Foundry
Smoot Construction                   Vice President, Gelberg Signs                                     Vice President,                   Olivia Shay-Byrne
                                     Kenneth Brewer                                                    Douglas Development               Partner, K&L Gates
Jennifer Eugene / Secretary
Manager, Engineered Sales,           Executive Director, H Street CDC                                  Caroline Kenney                   Stephen Taylor
Washington Gas                       Ernest Chrappah                                                   Managing Director of              Commissioner, DISB
                                     Director, DCRA                                                    Public/Private Development,       Joseph Torraca
Timothy F. Veith / Treasurer                                                                           Urban Atlantic
                                     Brunson Cooper                                                                                      Vice President of Business Development,
President,
                                     Corenic Construction Group,                                       Susan Lacz                        RCN
United Bank
                                     Corenic Construction                                              Principal & CEO,                  Andrew Trueblood
Keith Sellars / President                                                                              Ridgewells Catering               Director, DC Office of Planning
President & CEO,                     Donna Cooper
                                     Region President, Pepco                                           Lisa Mallory                      Donna Rattley Washington
Washington DC Economic Partnership                                                                     CEO, DCBIA
                                     Anita Butani D’Souza                                                                                Vice President Business Development,
Karima Woods /                       Division Head, HGRM Corporation                                   Gregory O'Dell                    Comcast
DMPED Representative                                                                                   President & CEO, Events DC
                                     Colette Dafoe                                                                                       Mitch Weintraub
Director of Business
                                     Office Managing Partner,                                          Lindsey Parker                    Partner, Cordia Partners
Development & Strategy,
                                     Nixon Peabody                                                     Chief Technology Officer,         Kristi Whitfield
Office of the Deputy Mayor for
                                                                                                       OCTO                              Director, DSLBD
Planning and Economic Development    Timothy Duggan
                                     Senior Vice President and Commercial                              William Rich                      Donna Woodall
                                     Regional Group Manager, TD Bank                                   President, Delta Associates       Director of Citizenship & Public Affairs,
                                                                                                                                         Microsoft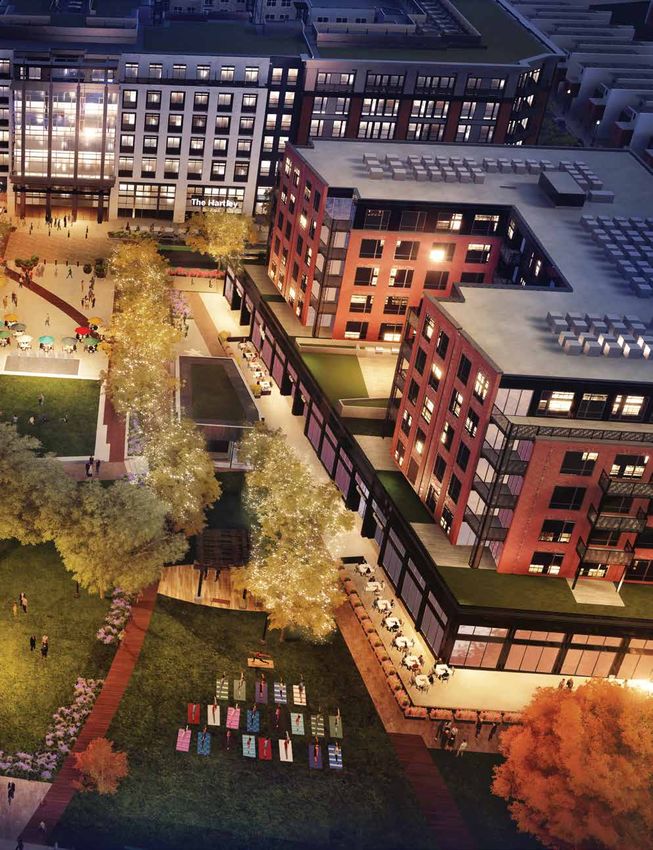
WASHINGTON, DC
                                                  DEVELOPMENT
                                                       REPORT
                                                                  2019 / 2020 EDITION

                                                            CITY RIDGE / DEVELOPED AND OWNED BY
                                             ROADSIDE DEVELOPMENT / NORTH AMERICA SEKISUI HOUSE

A publication of the   In partnership with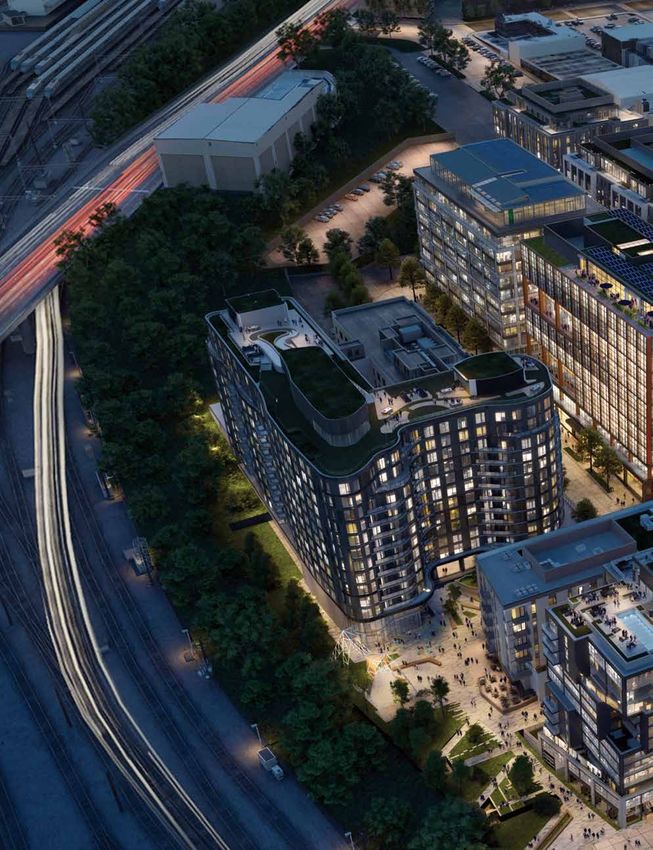
WDCEP
The Washington DC Economic Partnership             and global enterprise
(WDCEP) is a non-profit, public-private            leaders based
organization whose core purpose is to              on independent
actively position, promote, and support            thinking and
economic development and business                  objective insights.
opportunities in Washington, DC.                   We stay one step
                                                   ahead of the vibrant and evolving economic
Our mission is to promote DC’s economic
                                                   landscape by monitoring the pulse of
and business opportunities and support
                                                   DC’s developers, startups, entrepreneurs,
business retention and attraction activities.
                                                   and large and small businesses.
Through historical knowledge of the
city’s business and economic climate;              WDCEP Real Estate Services
accurate analytics, data, and research; and          • DC Real Estate Search tool
community partners and access, WDCEP is                (search.wdcep.com)
the central organization in Washington, DC           • Development Data
that connects public and private sectors,              (wdcep.co/dcdr)
neighborhoods, and communities to local,             • Local Market Intelligence
national, and international audiences.                 (wdcep.co/neighborhoods)
                                                     • Maps (wdcep.co/maps)
WDCEP’s purpose and success aligns with
                                                     • Site Location Assistance
its partners in the city: to facilitate dynamic
relationships with technology visionaries,         Learn more at wdcep.com or
artists, real estate entrepreneurs, non-profits,   engage with us @WDCEP.

THE DC DEVELOPMENT REPORT
The DC Development Report is a summary             constantly being updated, for the purposes of
of the major development and construction          this publication all data reflects project status,
projects in the District of Columbia. WDCEP        design, and information as of August 2019.
tracks major developments throughout the
                                                   Although every attempt was made to
year and performs an annual “development
                                                   ensure the quality of the information
census” in the month of August. This research
                                                   contained in this document, WDCEP and
and outreach receive contributions from more
                                                   Delta Associates makes no warranty or
than 100 developers, architects, contractors,
                                                   guarantee as to its accuracy, completeness,
and economic development organizations
                                                   or usefulness for any given purpose.
and results in updates to more than 300
projects. While our database of projects is
DEVELOPMENT OVERVIEW
4    ECONOMIC OVERVIEW
12   DEVELOPMENT OVERVIEW
14   MOST ACTIVE DEVELOPERS, ARCHITECTS & CONTRACTORS

DEVELOPMENT SECTOR
19   OFFICE
33   RETAIL
47   RESIDENTIAL
63   HOSPITALITY
73   QUALITY OF LIFE

NEIGHBORHOOD DEVELOPMENT
84   ANACOSTIA
85   ANACOSTIA WATERFRONT / CAPITOL RIVERFRONT
86   CAPITOL HILL / PENNSYLVANIA AVE, SE
87   GOLDEN TRIANGLE / WEST END
88   RHODE ISLAND AVENUE, NE
89   UNION MARKET / NOMA

APPENDIX
92   METHODOLOGY
93   ACKNOWLEDGMENTS
DEVELOPMENT

  OVER
VIEW
 ECONOMIC OVERVIEW
 DEVELOPMENT OVERVIEW
 MOST ACTIVE

                        Image courtesy of Urban Atlantic
ECONOMIC
                                          OVERVIEW                                                       By: Jonathan Chambers, Vice President, Delta Associates

GROSS DOMESTIC PRODUCT (GDP)

Economic growth in the District of Columbia continued to                                     The District has progressively diversified its economy in order
accelerate over the past year, driven heavily by the private                                 to reduce its reliance on the federal government, which has seen
sector. In 2018, GDP in the District grew at a rate of 4.0% to                               growth stagnate for nearly a decade. Between 1998 and 2018,
$144.1 billion, well ahead of the 2.9% pace of U.S. GDP growth.                              the public sector’s contribution to the economy has fallen from
Economic activity in the District’s private-sector grew at a                                 39% to 32%. Mayor Muriel Bowser’s Economic Strategy calls
post-recession high of 5.5% during the year, compared to public                              for growing private sector GDP to $100 billion by the end of
sector expansion of just 0.8%. Through the first quarter of 2019,                            2021. With annualized private sector GDP totaling $99.0 billion
annualized economic growth expanded to 4.4%.                                                 as of the first quarter of 2019, the District is well on its way to
                                                                                             achieving this goal. The tech industry has proven to be a strong
                                                                                             growth center, and the nearby Amazon HQ2 will further enhance
                                                                                             the District’s appeal to tech firms.

DC GDP YEAR-OVER-YEAR GROWTH RATE

      8.0%

      6.0%                                                                                                                                            5.5%
                                                                                                                                                      4.4%
      4.0%
                                                                                                                                                      3.1%
                                                                                                                                                      2.2%
      2.0%

      0.0%

    -2.0%

                       2008              2009              2010         2011   2012   2013      2014      2015       2016      2017       2018       20191
                                           DC Total                            DC Public                   DC Private                        U.S. Total

1. 12-month percentage change as of September 2019.
Source: Bureau of Labor Statistics, Delta Associates; September 2019.

4       © 2019 WASHINGTON DC ECONOMIC PARTNERSHIP
ECONOMIC
                                                                                                                          OVERVIEW

LABOR MARKET

The District’s labor market has seen renewed growth in 2019,                                      weighed down by several struggling industries, including Retail.
with 9,300 jobs added during the 12-month period ending August                                    The region’s annual pace of growth—1.0% as of August—remains
2019. The private sector continues to dominate job growth, with                                   well behind the 2-4% annual rate of job creation seen in the
10,300 new positions added during the year ending August 2019,                                    major metro areas of the Sunbelt and West Coast, but more
compared to a net loss of 1,800 in the public sector.                                             in line with other Northeastern metro areas, and greater than
                                                                                                  most Midwestern metro areas. As job growth has accelerated in
The greater Washington metro area continues to experience                                         the District, the city has captured a larger share of regional job
steady job growth, with 33,600 net additions over the year                                        growth—just over one-quarter as of August 2019—overtaking
ending August 2019. Regional growth continues to be somewhat                                      Suburban Maryland but remaining well behind Northern Virginia.

ANNUAL JOB GROWTH OF SELECT MAJOR METRO AREAS

      4.0%

      3.5%

      3.0%

      2.5%

      2.0%

       1.5%
                                                                                                                                                        1.4%
                                                                                                                                                        1.2%
       1.0%                                                                                                                                             1.0%

      0.5%
                                2014                                2015                2016               2017                2018                 20191

                             United States                                 District of Columbia              Washington MSA                   New York MSA

                            Chicago MSA                                    Boston MSA                        Los Angeles MSA                  San Francisco MSA

1. 12-month percentage change as of September 2019.
Source: Bureau of Labor Statistics, Delta Associates; September 2019.

The District’s 12-month trailing average unemployment rate                                        employment situation in the District to encounter some friction
stands at 5.4% as of August 2019, which is a decline of 20 basis                                  by the latter half of 2020 as the national economy slows, with
points from the 2018 annual average of 5.6%, and nearly half                                      greater deceleration in 2021, followed by a rebound in later years.
the post-recession peak of 10.2% in 2011. However, the level of                                   We project that 8,900 new jobs will be added in the District for
unemployment in the District remains higher than the greater                                      all of 2019, followed by another 7,000 positions in 2020 and 5,600
Washington region and the U.S. Looking ahead, we expect the                                       in 2021.

                                                                                                                     DC DEVELOPMENT REPORT • 2019 / 2020 EDITION    5
ECONOMIC
                                OVERVIEW

PROJECTED JOB GROWTH (THOUSANDS)

                                   TOTAL JOB GROWTH
                                          31.7
        30                                            4.8
                                                                                                      28.7

                                                                                                       5.5
                                                                                                                                     23.0

        20                                                                                                                            4.4
                                                     18.0
                                                                                                      16.2
                                                                                                                                      13.0
         10

                                                      8.9                                              7.0                            5.6
           0
                                                   2019                                              2020                            2021

                                          District of Columbia                                     Northern Virginia                 Suburban Marland
Source: Delta Associates; September 2019..

ANNUAL JOB GROWTH (THOUSANDS)

                                                                        12-MONTH PERIOD ENDING AUGUST 2019                          2009–2018

                                                           DISTRICT OF                                              DISTRICT OF
                                                                                 WASHINGTON MSA              U.S.                 WASHINGTON MSA       U.S.
                                                            COLUMBIA                                                 COLUMBIA

 Construction & Mining                                            0.4                   2.7              182.0          2.7           -13.1            92.0
 Education & Health Services                                      1.5                   8.9              577.0         28.8            98.3         4,439.0
 Federal Government                                              -0.1                   0.8                  50.0       2.5            15.2            34.0
 Financial Activities                                             0.0                  -2.2              114.0          1.9             5.0           363.0
 Information                                                      0.8                  -1.3                   5.0       -1.6          -17.1          -156.0
 Leisure & Hospitality                                            3.5                  15.6              302.0         21.9            70.9         2,912.0
 Manufacturing                                                   -0.1                  -0.6              133.0          -0.2           -7.9          -717.0
 Other Services                                                   2.2                   3.0                  93.0      11.0            26.1           330.0
 Professional & Business Services                                 2.8                   9.4              452.0         15.3            76.5         3,207.0
 Retail Trade                                                    -0.1                  -5.1              -98.0          4.4             7.3           544.3
 State/Local Government                                          -1.7                   1.7                  69.0       0.7            21.5           -95.0
 Transportation/Utilities                                         0.2                   1.6              111.4          0.7             5.1           900.9
 Wholesale Trade                                                 -0.1                  -0.9                  73.6       0.1            -6.4           -22.2
 Total                                                            9.3                 33.6             2,064.0         88.2          281.4         11,832.0

Source: Bureau of Labor Statistics, Delta Associates; September 2019.

6        © 2019 WASHINGTON DC ECONOMIC PARTNERSHIP
ECONOMIC
OVERVIEW
LABOR MARKET BY SECTOR relocations, they could cause increases in unemployment, slow
population growth, and sour investor sentiment. Perhaps more
Federal Government than ever, the results of the next presidential and congressional
election will have an outsized effect on the future growth (or
The federal government continued to shed jobs in the District contraction) of the District’s federal workforce.
in 2019, albeit at a slower rate than in 2018. Over the 12 months
ending August 2019, federal employment in the District shrunk Professional and Business Services
by 100 positions. Aside from chronic negative job growth, the
District’s federal sector has been very turbulent during the While the Professional and Business Services sector isn’t posting
current presidential administration. Federal workers have had to the enormous gains that it did in earlier years of the recovery
endure pay freezes, government shutdowns (without pay), and cycle, it remains a vital pillar of the District’s economy. During
rapidly changing (or vacant) administrative leadership positions. the 12-month period ending August 2019, the sector added 2,800
new positions—the second most of all primary employment
The most recent challenge to the sector has been a Trump sectors, behind Leisure & Hospitality. Job growth in this sector
administration attempt to relocate federal agencies from the typically generates demand for office space, making it critical to
District to other jurisdictions. Competition with neighboring the city’s commercial real estate market, particularly considering
jurisdictions in Maryland and Virginia for federal agencies has federal consolidation. Positions also tend to be well-paying,
been routine for the city, but the relocation of federal agencies which strengthens demand for residential units and retail.
to other parts of the country entirely (well beyond the commute
range of District residents) is significantly more damaging to the Over the past few years the District has seen significant success
city’s economy. So far, the administration has moved forward in attracting and retaining large firms in the industry. In 2018
with three agency relocations, despite vehement pushback from long-standing private equity firm The Carlyle Group expanded
local politicians and Congress. their District headquarters by 50%. More recently, in spring
2019, NGO Chemonics International finalized a lease for a new
Specifically, the USDA has selected the Kansas City metro area 300,000 SF headquarters in Capitol Riverfront and advisory
as the new home for two of its sub-agencies: the Economic firm Ankura moved into a new 91,000 SF headquarters, nearly
Research Service (ERS) and the National Institute of Food and doubling its square footage in the process. In addition, startup
Agriculture (NIFA). ERS is relocating 253 positions, while NIFA incubator 1776 announced that it would relocate from Crystal
plans to relocate 294. Both agencies are currently based in the City to the District by the end of 2019. There have been several
District’s Southwest Federal Center. At least two-thirds of the recent moves in the District’s large legal sector, although most of
existing employees asked to relocate have declined, according to those relocations have been within the city for net reductions of
The Washington Post. Further, the Trump administration signed leased space (while maintaining headcount).
a lease this year to relocate nearly all of the Bureau of Land
Management’s 360-employee workforce, currently based in the Technology
Capitol Riverfront neighborhood, to Grand Junction, Colorado
and other dispersed locations. The District may have lost out to Arlington County for Amazon’s
HQ2 campus, but the city’s tech industry has boomed over
The Trump administration’s most predictable characteristic is its the last few years, with growth outpacing any other major
unpredictability, so it is unknown if other agency relocations will private sector industry. The East End has become a magnet
be proposed, to where, and whether they will be successful. If the for the industry with several major tech firms setting up shop
relocations do continue, there will certainly be a negative impact there, including Dell, Facebook, Yelp, FiscalNote, and Apple.
on nearly all facets of the District’s economy, where one out of FiscalNote’s growth has been so rapid, that the company has had
four jobs is federal. Depending on the size and timing of the to expand its headquarters twice over the last three years. Two
DC DEVELOPMENT REPORT • 2019 / 2020 EDITION 7ECONOMIC
OVERVIEW
other home-grown tech firms, EverFi and TransitScreen, also two-thirds since 2015. The only age group that has experienced
moved into new, larger headquarters this year. While not strictly recent declines is the 18-24 age group, as younger college
a tech firm, coworking operator WeWork has grown massively graduates are becoming increasingly priced out of the District.
in the District in recent years, leasing over one million SF at 16
locations, becoming its largest private sector tenant virtually Roughly one-third of new District residents are relocating
overnight. WeWork and other coworking firms have nearly from Maryland or Virginia, with the former accounting for the
single-handedly turned around the District’s once stagnant office larger share. Outside of the metro area, the Northeast region is
market. However, there are growing concerns of risk exposure, the largest contributor of migrants to the District. Additionally,
particularly concerning WeWork, which recently canceled an over 10,000 new District residents in the 2013-2017 time period
IPO and made considerable leadership changes. moved from abroad. As for those departing, Maryland is the
recipient of the largest share of former District residents. The
POPULATION GROWTH state is the destination for nearly one-third of people moving out
of the District.
The District’s population has officially surpassed the 700,000
mark, with the most recent Census figure estimating a total As the city’s population continues to grow, so too has household
of 702,455 residents as of July 2018. The 25-39 year-old age income. ESRI estimates that the median household income in the
group, which includes the majority of the Millennial generation, District increased 6% since 2018, and 35% since the 2010 Census,
continues to lead population growth among age groups, to $82,381. The figure is projected to increase another 15% to
accounting for just under half of all new residents since 2017, and $94,570 by 2024.
DC POPULATION GROWTH BY AGE (2015–2018)
19,725
20,000
15,000
10,000 9,387
8,299
5,000
325
0
-5,000
-7,509
-10,000
Under 18 Years 18-24 years 25-39 years 40-64 years Over 65 Years
Source: Census Bureau, Delta Associates; September 2019.
8 © 2019 WASHINGTON DC ECONOMIC PARTNERSHIPECONOMIC
OVERVIEW
THE DISTRICT'S MIGRATION PATTERNS (2013–2017) DOMESTIC MIGRATION TO DC
(SELECT STATES)
MIGRATED TO DC MIGRATED FROM DC NET GAIN
Maryland 12,287 19,984 -7,697
Virginia 8,623 10,617 -1,994
New York 4,339 3,870 469
3.76%
California 3,504 4,467 -963
7.95%
Pennsylvania 2,113 1,897 216
2.49%
Massachusetts 2,051 1,351 700 3.87%
3.65%
New Jersey 1,994 875 1,119 3.11%
Florida 1,883 1,416 467 22.50%
Texas 1,850 1,425 425 15.79%
Illinois 1,700 1,089 611
2.88%
> 10%
Foreign Nation 10,800 n/a n/a
5%–10%
2.12% 2%–5%
Note: list is based on states with highlest levels of migration to DC
< 2%
Source: U.S. Census Bureau, 2013-2017 American Community Survey
INVESTMENT investment has dropped significantly across the country in light
of recent dollar volatility, a reduction in overseas instability,
Commercial real estate (CRE) investment activity remains controversial federal policy decisions, and growing sentiment of
high in the District, with $5.6 billion worth of commercial real an impending recession.
estate transactions occurring over the 12 months ending June
2019, including $1.1 billion worth of multifamily sales and $4.2 Looking ahead, there are several new factors emerging over the
billion worth of office sales. However, this figure is about 10% next year that have the potential to dramatically affect commercial
lower than total transactions recorded in calendar year 2018. real estate investment in the District. At the forefront is the
The District’s 25 opportunity zones saw over $46.5 million in possible near-term onset of a recession. While the District has
investment activity over the same period, compared to $48.8 historically been largely economically insulated from the worst
million in calendar year 2018. effects of economic downturns, the most recent recession (along
with other factors, such as sequestration) proved to be a major
The District has been a hotbed of foreign investment activity drag on the city’s CRE market, particularly the office sector.
in recent years, particularly for very top-of-the-market trophy Short-term returns for office assets in the District have yet to even
assets downtown. However, cross-border CRE investor interest begin to approach the double-digit annual returns seen in the
has cooled in 2019, following a surge in prices to stratospheric decade prior to the recession, and have lagged those in most other
heights (well over $1,000/SF for select properties) and cap rate gateway cities. Nevertheless, the District’s well-earned reputation
compression. Midway through 2019, just under a quarter of CRE as a stable “safe haven” for long-term real estate investment
investors in the District were foreign entities, compared to about continues to make it an appealing choice for capital deployment to
40% in 2018. However, the trend is not unique to DC as overseas a broad spectrum of investors.
DC DEVELOPMENT REPORT • 2019 / 2020 EDITION 9ECONOMIC
OVERVIEW
A more immediate test for the investment market will be an by over 70% from 1.45% to 2.5% for commercial properties
increase in CRE-related tax rates that went into effect on valued in excess of $2 million. These changes will directly
October 1, particularly increases to the deed recordation and impact the District’s CRE investment market by making it more
deed transfer tax rates. Both taxes are each scheduled to increase expensive for investors to acquire property within the city.
COMMERCIAL REAL ESTATE INVESTMENT SOURCES
User/Other
REIT
Private
CES
Institutional &
Equity Funds
Foreign
0% 10% 20% 30% 40% 50%
DISTRICT OF COLUMBIA UNITED STATES
Source: Real Capital Analytics, Delta Associates; September 2019 (Note: Acquisitions only, does not include construction financing).
10 © 2019 WASHINGTON DC ECONOMIC PARTNERSHIPECONOMIC
OVERVIEW
MOBILITY These new mobility options have already had a positive impact
on the District’s commercial real estate industry, primarily by
The District and the larger metro area has some of the worst saving developers money on parking construction. In 2016,
traffic congestion and longest commutes in the nation, but the District’s Zoning Commission approved a zoning update
the arrival of new transportation options in recent years have that lowered the required parking minimums for nearly all
greatly expanded mobility for commuters and residents. New new commercial buildings, with further reductions for those
services that have appeared over the last decade include Lyft properties within the walkshed of Metro stations. In addition,
and Uber ridesharing, Capital Bikeshare, DC Streetcar and, the arrival of ride-sharing has increased the value of multifamily
most recently, dockless bicycles, scooters, and mopeds. Rather properties located outside of transit walksheds (but still in dense
than fully replacing traditional transportation modes, such as neighborhoods) by becoming more attractive to residents who
automobiles, buses, or Metrorail, these new options have taken wish to live car-free. In the long-term, the potential widespread
on supplementary and complementary roles, by serving as “first- adoption of fully autonomous vehicles could result in a marked
mile/last-mile” and short-trip choices. change in how buildings are designed and where they are
located, with possibly lower importance of transit access and
parking availability.
DC DEVELOPMENT REPORT • 2019 / 2020 EDITION 11DEVELOPMENT
OVERVIEW
DC DEVELOPMENT GROUNDBREAKINGS (AUGUST 2019, SQ. FT. IN MILLIONS)1
14.4
13.9
13.4
12.7
11.7
11.2
10.4 10.6 10.5 10.5
10.2 10.1 10.2
9.5
9.1
7.5
101
89 91 93
83 80 86
80 78 79 79
65 4.3 65
4.3 68
50
45 42
2003 2004 2005 2006 2007 2008 2009 2010 2011 2012 2013 2014 2015 2016 2017 2018 2019 YTD
NO. OF PROJECTS TOTAL SF
SUMMARY OF PROJECTS (AUGUST 2019)
PROJECTS SQ. FT. ESTIMATED VALUE ($B)
Completed 1,466 198,493,679 $65.0
2001–2010 805 109,707,199 $31.0
2011–2019 YTD 661 88,786,480 $34.1
2011 54 5,489,253 $2.3
2012 68 7,848,994 $2.5
2013 80 11,619,129 $4.8
2014 71 11,533,842 $4.6
2015 70 6,224,685 $2.6
2016 99 12,870,149 $4.5
2017 85 13,276,702 $5.3
2018 80 11,236,779 $4.1
2019 YTD 54 8,686,947 $3.4
Under Construction 143 28,367,341 $13.9
2019 delivery 57 9,319,374 $3.2
2020 delivery 59 10,261,769 $4.3
2021 delivery 21 4,766,636 $2.3
2022+ delivery 6 4,019,562 $3.8
Pipeline 433 116,523,372 $36.6
Near Term 208 27,661,934 $8.8
Long Term 225 88,861,438 $27.7
Source: Washington DC Economic Partnership Research
1. All projects
12 © 2019 WASHINGTON DC ECONOMIC PARTNERSHIPDEVELOPMENT
OVERVIEW
PROJECTS COMPLETED (2001–AUGUST 2019)
# OF PROJECTS SQ. FT. UNITS ROOMS
¢ Office 293 62,181,621 -- --
¢ Retail
¢ Residential
430
724
8,965,051
79,786,025
--
80,641
--
--
198.5 MILLION
¢ Hospitality 132 20,820,761 -- 19,699 Square Feet Completed
¢ Quality of Life 306 22,443,285 -- --
Total Estimated Value of Projects: $65 billion
PROJECTS UNDER CONSTRUCTION
# OF PROJECTS SQ. FT. UNITS ROOMS
¢ Office 24 5,163,807 -- --
¢ Retail
¢ Residential
68
89
1,740,840
16,669,238
--
17,088
--
--
28.4 MILLION
¢ Hospitality 15 1,687,451 -- 1,468
Square Feet Under Construction
¢ Quality of Life 18 2,410,944 -- --
Total Estimated Value of Projects: $13.9 billion
PIPELINE PROJECTS
# OF PROJECTS SQ. FT. UNITS ROOMS
¢ Office 99 31,892,489 -- --
¢ Retail
¢ Residential
199
284
4,984,746
54,750,465
--
62,102
--
--
116.5 MILLION
¢ Hospitality 54 4,299,246 -- 6,236 Square Feet in the Pipeline
¢ Quality of Life 62 5,004,795 -- --
Total Estimated Value of Projects: $36.6 billion
DC DEVELOPMENT REPORT • 2019 / 2020 EDITION 13DEVELOPMENT
OVERVIEW
The figures below list the developers, architects and contractors that have been the most ¢ Completed
active in contributing to DC’s development activity since 2014.
¢ Under Construction
¢ Pipeline
MOST ACTIVE DEVELOPERS SINCE 2014 (# OF PROJECTS)4
JBG Smith1
17 6 8 31
Douglas Development
17 5 5 27
Brookfield Properties2
10 2 9 21
WC Smith
10 6 5 21
Jair Lynch Real Estate Partners
8 4 4 16
MRP Realty
5 3 8 16
If measured by sq. ft. of projects the most active developers include JBG Smith (11.2M sq. ft.), Brookfield Properties (11.0M sq. ft.),
Akridge (7.3M sq. ft.), MRP Realty (6.6M sq. ft.), and Urban Atlantic (6.4M sq. ft.).
MOST ACTIVE ARCHITECTS SINCE 2014 (# OF PROJECTS)4
Shalom Baranes Associates
17 6 16 39
Bonstra | Haresign Architects
14 5 18 37
Torti Gallas + Partners3
11 9 16 36
PGN Architects
12 7 13 32
Eric Colbert & Associates
19 6 6 31
WDG Architecture
15 10 6 31
If measured by sq. ft. of projects the most active architects include Shalom Baranes Associates (21.2M sq. ft.), Perkins Eastman DC, (13.9M sq. ft.),
WDG Architecture, (13.0M sq. ft.), Torti Gallas + Partners, (12.6M sq. ft.), and SK+I Architectural Design Group, (10.4M sq. ft.)
MOST ACTIVE GENERAL CONTRACTORS SINCE 2014 (# OF PROJECTS) 4
Clark Construction Group
37 10 4 51
Hamel Builders
18 5 4 27
Gilbane Building Company
13 4 7 24
Grunley Construction
18 3 3 24
MCN Build
19 2 1 22
James G. Davis Construction Co.
15 6 1 22
If measured by sq. ft. of projects the most active contractors include Clark Construction Group (17.0M sq. ft.), Balfour Beatty (6.8M sq. ft.),
Bozzuto Construction (5.8M sq. ft.), James Davis Construction Corporation (5.7M sq. ft.), and Grunley Construction (5.5M sq. ft.).
1. Includes projects developed as The JBG Companies. 2. Includes projects developed as Forest City Washington. 3. Includes Torti Gallas Urban projects 4. Projects completed since January 2014, under construction or in the pipeline as of
August 2019 (excludes government agencies and colleges/universities). Only companies with 10 or more projects since 2014 are included in sq. ft. calculations.
14 © 2019 WASHINGTON DC ECONOMIC PARTNERSHIPArchitecture. Planning. Interiors.
The Bower, Washington, DC
AC Hotel by Marriott, Washington, DC 100 K Street NE, Washington, DC
Midtown Center, Washington, DC Sursum Corda, Washington, DC
www.wdgarch.com Washington DC Dallas TXDEVELO
PMENT
 BY SECTOR
 OFFICE
 RETAIL
 RESIDENTIAL
 HOSPITALITY
 QUALITY OF LIFE

                   Image courtesy of WDG Architecture
DOES YOUR IDEA
NEED
SPACE?
When you need to scale up your
business with a storefront or office
space, WDCEP can assist with:
ONE-ON-ONE SUPPORT FOR
BUSINESSES OF ALL SIZES
• Site location assistance
• DC incentive information
• Neighborhood retail/restaurant site tours
• Broker introductions
DATA & TOOLS
• Neighborhood Profiles
• Development Report
• Current retail and development
online search tools
• Monthly economic sector maps
wdcep.com | (202) 661-8670 | dcbiz@wdcep.com
1495 F Street, NW | Washington, DC 20004OFFICE DEVELOPMENT
IN WASHINGTON, DC
Image courtesy of Gould Property GroupBy: Jonathan Chambers, Vice President, Delta Associates
The District of Columbia’s office market has
continued to experience positive, but uneven
growth. The private sector has been even more
influential for office growth in 2019, as GSA has
remained on the sidelines of the marketplace.
OFFICE INVENTORY 1 NET ABSORPTION 1 DIRECT VACANCY RATE 1 AVERAGE FACE RENT 1
108.5M
Square Feet (Q3 2019)
806,000
Square Feet (Q4 2018–Q3 2019)
12.0% (Q3 2019)
$56.13
Per Square Foot (Q3 2019)
Strong hiring in the Professional and Business Services sector, Net absorption of office space in the District has oscillated
which includes the consulting, tech, and coworking industries, significantly over the past year, but has overall been positive.
in particular has driven the market forward. Combined with Total absorption in the District of Columbia from Q4 2018 to
Information, the two sectors added a total of 3,600 new jobs in the Q3 2019 totaled 806,000 SF. The Capitol Hill-Riverfront/NoMa
District over the 12 months ending August 2019. During the same submarket again led with 502,000 SF of positive absorption
period, the Federal Government contracted by 100 positions. over the 12-month period, while the Uptown submarket was
GROWTH OF OFFICE-USING EMPLOYMENT SECTORS2 (2007–2019)
TOTAL: 600 -1,500 10,100 4,600 -500 -1,600 -5,100 5,600 5,400 1,100 0 3,500
10000
8000
6000
4000
2000
0
-2000
-4000
-6000
-8000
2008 2009 2010 2011 2012 2013 2014 2015 2016 2017 2018 20193
Federal Government Financial Activities Information Professional & Business Services
1. REIS, Delta Associates; September 2019 (does not include owner-occupied buildings) 2. BLS, Delta Associates; September 2019 3. 12 months ending August 2019
20 © 2019 WASHINGTON DC ECONOMIC PARTNERSHIPOFFICE
DEVELOPMENT
TOP NEW OFFICE LEASES (Q3 2018–Q2 2019)
TENANT PROPERTY ADDRESS SUBMARKET SQ. FT. INDUSTRY TIMEFRAME
Consulting/
Chemonics 1275 New Jersey Ave., SE Capitol Riverfront 300,000 Q4 2018
Contracting
Williams & Connolly LLP 690 Maine Ave., SW Southwest 292,000 Legal Q4 2018
University of the District of Columbia 4250 Connecticut Ave., NW Uptown 202,000 Education Q4 2018
WeWork 1333 New Hampshire Ave., NW CBD 130,000 Coworking Q4 2018
WeWork 200 Massachusetts Ave., NW East End 111,000 Coworking Q2 2018
WeWork 1100 15th St., NW CBD 110,000 Coworking Q1 2019
WeWork 1701 Rhode Island Ave., NW CBD 104,000 Coworking Q2 2019
Convene 600 14th St., NW East End 79,800 Coworking Q1 2019
Convene 575 Seventh St., NW East End 72,400 Coworking Q1 2019
WeWork 700 K St., NW East End 66,500 Coworking Q4 2018
CBRE 1900 N St., NW CBD 55,000 Real Estate Q4 2018
EIG Global Energy Partners 600 New Hampshire Ave., NW West End 51,000 Energy Q1 2019
SmithBucklin 2001 K St., NW CBD 50,000 Legal Q3 2019
CommonGrounds Workplace 99 M St., SE Capitol Riverfront 44,200 Coworking Q3 2019
National Association of Manufacturers 733 10th St., NW East End 42,000 Advocacy/Lobbying Q2 2019
Beveridge & Diamond 1900 N St., NW CBD 41,000 Legal Q4 2018
Consulting/
Pact 1140 3rd St., NE NoMa 40,000 Q2 2019
Contracting
SoundExchange 733 10th St., NW East End 39,000 Advocacy/Lobbying Q2 2019
Business Roundtable 1000 Maine Ave., SW Southwest 30,500 Advocacy/Lobbying Q4 2018
Michael Best & Friedrich LLP 1000 Maine Ave., SW Southwest 30,400 Legal Q4 2018
Source: Delta Associates; September 2019.
easily the worst performer with -609,000 SF of absorption. decade. As of Q3 2019, the District’s direct vacancy rate stood at
Notably, Uptown was hit by the relocation of Fannie Mae 12.0%, 120 basis points higher than a year prior. The ongoing glut
to a new headquarters at Midtown Center in the CBD. The of new construction is mostly to blame for rising vacancy. Although
District’s Class A sector has led the overall market in positive total private-sector office construction activity has dipped from its
growth as the “flight-to-quality” continues, with 1.1 million SF post-recession peak of over six million SF at the end of 2017, the
of space absorbed over the 12-month period ending Q3 2019. pipeline remains very robust with 4.1 million SF underway as of Q3
Comparatively, Class B/C properties struggled with -300,000 SF 2019. Tenants continue to demand newer, more-efficient, and better-
of net absorption over the same timeframe. amenitized space, and developers continue to build new product to
meet this demand; however, these new spaces are paired with very
Even with positive absorption, office vacancy in the District generous incentives. Average tenant improvement packages in the
continues to climb, as it has almost consistently for nearly half a District have effectively doubled over the past five years.
DC DEVELOPMENT REPORT • 2019 / 2020 EDITION 21OFFICE
DEVELOPMENT
Most office construction activity is concentrated in the rapidly- of tenants, from federal agencies to coworking operators to legal
growing submarkets outside the core, east and south of the firms to their projects which offer 24/7 live/work/shop/play
Center Leg and SE-SW freeways, respectively. The NoMa, mixed-use environments along with other unique amenities,
Capitol Riverfront, and Southwest districts have added millions such as water views in Southwest and Capitol Riverfront and
of SF of new office product over the past decade. Developers in quick access to a myriad of transportation options at Union
these neighborhoods have managed to attract a broad spectrum Station in NoMa.
SUBMARKET TENANT RELOCATIONS (2015–2019)
TENANT PREVIOUS SUBMARKET NEW SUBMARKET IMPACT (SF)
Chemonics International CBD Capitol Riverfront 300,000
Fannie Mae Uptown CBD 752,000
Goodwin Procter LLP East End CBD 80,000
GSA/Corp. for National and Community Serv. East End Southwest 85,000
GSA/Federal Communications Commission Southwest NoMa 473,000
GSA/Bureau of Prisons East End Southwest 113,300
GSA/Dept. of Homeland Security: OIG East End Southwest 88,000
GSA/Dept. of Justice East End NoMa 839,000
GSA/Federal Election Commission East End NoMa 100,000
GSA/Pension Benefit Guaranty Corp. East End Southwest 431,800
GSA/U.S. Peace Corps. CBD NoMa 173,000
Paul Hastings LLP East End CBD 97,000
The Aspen Institute CBD West End 91,000
Universal Service Administrative Co. CBD East End 102,000
Urban Institute CBD Southwest 121,000
Williams & Connolly LLP East End Southwest 290,000
Source: REIS, Delta Associates; September 2019.
Unfortunately, much of the tenant roster for new office space tenants moving to other District submarkets. GSA has been
in these nascent submarkets was lured from the District’s especially active in moving tenants out of the submarket. As
traditional core submarkets, specifically the CBD and East a result, the office vacancy rate in the East End has increased
End. The East End has been especially beset by relocations, roughly 50% over the past decade to 12.3% as of Q3 2019.
with well over a million SF vacated over the past few years by
22 © 2019 WASHINGTON DC ECONOMIC PARTNERSHIPOFFICE
DEVELOPMENT
One of the primary weaknesses of the CBD and East End are rents typically include the following amenities: conference
their large inventories of lower-quality Class B product, which rooms, indoor and outdoor rooftop space, glass curtain walls,
has struggled to compete in an era when tenants rely heavily on LEED certification, double- or triple-height lobbies, open
amenities to recruit the best talent. Owners have come to the floorplans, and fitness facilities.
realization that in order to be competitive, comprehensive asset
renovations or redevelopment is necessary. Unsurprisingly, the In addition to the Class A/Class B office supply-demand
entire office pipeline in the CBD and East End is composed imbalance, another incongruity lies within the buildings
of office projects that are either complete redevelopments themselves. As new office buildings deliver to market, space on
of demolished Class B office buildings or office buildings higher floors has been leasing much quicker than space on lower
undergoing complete gutting and rebuild programs, even floors. This is especially true in buildings with skyline, landmark,
for 80’s- and 90’s- vintage “B+” assets. 1901 L Street NW is or water views. Some ways that owners have overcome this
undergoing a combination of both strategies, with a renovation obstacle has been to offer greater concessions on lower floors,
of all eight pre-existing floors and the addition of three new enhance lower floor views with attractive landscaping or art,
floors of office space. The repositioning/renovations that provide private terraces to tenants, build lower floors with
successfully draw tenants willing to pay top-of-the-market higher ceilings, or target lower floors for smaller “spec suites.”
DC OFFICE LEASING CONCESSIONS METRICS (CLASS A/B/C BUILDINGS)
8.0 $100.00
7.0
6.4
6.0
$82.31
TIME (MONTHS/YEARS)
$80.00
5.0
$ PER SQ. FT.
4.0
3.8
3.0
$60.00
2.0
1.0
0.0 $40.00
Q1 2016 Q2 2016 Q3 2016 Q4 2016 Q1 2017 Q2 2017 Q3 2017 Q4 2017 Q1 2018 Q2 2018 Q3 2018 Q4 2018 Q1 2019 Q2 2019 Q3 2019
Avg. Months of Free Rent Avg. Lease Term (years) Avg. Tenant Improvement Package/SF
Source: REIS, Delta Associates; September 2019.
DC DEVELOPMENT REPORT • 2019 / 2020 EDITION 23OFFICE
DEVELOPMENT
Leasing activity in the District for new office space continues to
be dominated by the private sector. Nearly all of the largest new
leases signed over the past year came from private sector tenants.
The coworking industry continues to be particularly active, with
providers signing larger and larger leases. WeWork is the clear
market leader in the coworking space, and has grown to become
the largest single private tenant in both the District of Columbia
and Manhattan, New York. The firm currently holds leases of over
one million SF at 16 locations in the District, including half a million
SF in leases executed for five new locations over the past year.
However, a lot of questions have surfaced regarding the coworking
giant’s long-term solvency and whether its meteoric growth is
sustainable, especially in light of the recent IPO debacle. To a
lesser extent, the same concerns extend to other coworking firms,
including industry pioneer Regus, and newcomers MakeOffices,
Spaces, Convene, CommonGrounds, and Industrious, among other
independently-owned and operated providers.
SUBMARKET DATA
NET ABSORPTION Q4 2018-Q3 2019 ASKING RENT Q3 2019 CONSTRUCTION ACTIVITY
SUBMARKET
CLASS A CLASS B/C CLASS A CLASS B/C DELIVERED UNDER CONSTRUCTION
2015–Q3 2019 Q3 2019
CBD 133,000 -13,000 $56.81 $44.35 1,340,600 1,240,900
East End 744,000 51,000 $59.41 $51.80 2,360,200 155,000
Capitol Hill-Riverfront/NoMa 532,000 -30,000 $66.42 $49.88 3,331,500 2,002,000
Southwest 233,000 -96,000 $49.86 $45.56 735,000 600,100
Georgetown -26,000 -42,000 $56.17 $50.32 0 0
West End -182,000 111,000 $51.49 $37.84 0 0
Uptown -328,000 -281,000 $64.66 $56.32 112,000 68,000
District of Columbia Total/Average 1,106,000 -300,000 $60.90 $48.86 7,879,300 4,066,000
Source: REIS, Delta Associates; September 2019.
Looking ahead, stakeholders can expect continued positive the impact has been uneven between submarkets, with
growth, but at a more moderate pace as the economy the East End suffering the most. The District is also the
slows. The federal government, and specifically the 2020 most susceptible of its peers to the Trump administration’s
presidential and congressional elections, remains the biggest initiative to relocate federal agencies outside of the region.
concern for the office market in the near future. GSA-leased The Bureau of Land Management and two USDA agencies
inventory continues to shrink across the Capital Region and scheduled for relocation will leave a 369,000 SF-sized hole in
the District has borne the brunt of the reductions. However, the District’s office market.
24 © 2019 WASHINGTON DC ECONOMIC PARTNERSHIPOFFICE
DEVELOPMENT
OFFICE DEVELOPMENT GROUNDBREAKINGS COMPLETED PROJECTED
(AUGUST 2019, OFFICE SQ. FT. IN MILLIONS) PRIVATE GOVT PRIVATE GOVT PRIVATE GOVT
2002 3.3 0.8 4.1 2002 3.0 3.0
2003 2.2 0.6 2.9 2003 2.8 2.8
2004 4.9 0.4 5.3 2004 2.0 1.2 3.2
2005 2.8 1.4 4.2 2005 3.6 3.6
2006 3.8 0.4 4.1 2006 4.4 1.5 5.9
2007 4.7 4.7 2007 3.7 0.6 4.3
2008 3.0 0.5 3.5 2008 2.0 1.2 3.2
2009 0.9 1.1 2.0 2009 5.6 0.4 6.0
2010 0.7 2.8 3.4 2010 2.7 0.7 3.4
2011 1.3 0.4 1.7 2011 1.2 0.8 2.0
2012 1.3 0.4 1.7 2012 0.8 1.0 1.8
2013 1.1 0.2 1.2 2013 2.0 2.1 4.1
2014 3.0 0.9 3.9 2014 0.9 1.0 1.9
2015 1.8 0.7 2.4 2015 0.6 0.1 0.7
2016 2.7 0.3 3.0 2016 2.0 0.3 2.2
2017 2.5 0.2 2.7 2017 1.3 0.8 2.1
2018 1.0 0.2 1.2 2018 2.9 0.3 3.1
2019 YTD 1.4 0.2 1.6 2019* 3.7 0.5 4.2
2020* 1.0 0.6 1.5
2021* 0.7 0.7
*projections based on targeted delivery dates of projects under construction as of August 2019
OFFICE DEVELOPMENT (AUGUST 2019)
PROJECTS OFFICE SQ. FT.
COMPLETED (SINCE 2001) 293 62,181,621
2009 21 6,033,060
2010 10 3,408,455
2011 8 1,987,719
2012 9 1,818,359
2013 20 4,127,439
2014 11 1,925,674
2015 4 651,500
2016 19 2,211,006
2017 11 2,125,785
2018 15 3,139,202
2019 YTD 12 2,395,514
UNDER CONSTRUCTION 24 5,163,807
2019 DELIVERY 8 1,772,582
2020 DELIVERY 7 1,547,200
2021+ DELIVERY 9 1,844,025
PIPELINE 99 31,892,489
NEAR TERM 41 4,358,907
LONG TERM 58 27,533,582
TOTAL 416 99,237,917
DC DEVELOPMENT REPORT • 2019 / 2020 EDITION 25■ COMPLETED
■ UNDER CONSTRUCTION
■ PIPELINE
SO
UT
M
A
H
SS
DA
A
CH
KO
CO
U
TA
SE
NN
TT
AV
S
EC
GEORGIA AVE
E
AV
TIC
E
ROCK
UT
CREEK
AV
PARK
E
14TH ST.
VE
DA
U ST. LAN
E IS
OD VE
RH
KA
OR
WY
GE
NE
OR
GE
W
AS
HI
G
TO
N
N
M
E
M
10 31
O
RI
AL
PK
18 27
W
Y
16 17
21 23 11 6 1 2
8 15 22 13
H ST.
VIRGINIA
UNION
66
14 STATION
4
9
NATIONAL MALL E. CAPITOL ST.
VIRGINIA
U.S. CAPITOL
20
29 19
5
FORT DUPONT
12 PARK
26 24 M ST.
NATIONALS
PARK 7
PE
NN
SY
LVA
M NIA
AV
E
395
25
M
E.
OFFICE
1
AV
JR.
M
M A RTIN LUTHER KING
3
M NATIONAL
AIRPORT
Alexandria
28 30AVE
A
BAM
ALA
All project locations
are approximate.DEVELOPMENT
PIPELINE
EST. VALUE
PROJECT WARD LOCATION DEVELOPER(S) OFFICE SF DELIVERY2
($M) 1
TOP OFFICE PROJECTS COMPLETED (Q3 2018–AUGUST 2019)
1 655 New York Avenue 6 655 New York Ave., NW Douglas Development Corporation / 653,500 $185 Q1 19
Brookfield Properties
2 Four Constitution Square 6 150 M St., NE Stonebridge Associates / 505,000 $250 Q2 19
Walton Street Capital
3 Center Building (DHS HQ) 8 St. Elizabeths West Campus General Services Administration 276,000 $268 Q2 19
4 One Freedom Plaza 2 1301 Pennsylvania Ave., NW Quadrangle Development 270,040 Q1 19
5 500 L'Enfant Plaza 6 500 L'Enfant Plaza, SW JBG Smith 215,200 $75 Q4 18
6 1441 L Street 2 1441 L St., NW S.C. Herman & Associates 207,000 $36 Q1 19
7 DC Water HQ 6 125 O St., SE DC Water 151,300 $60 Q4 18
8 2100 K Street 2 2100 K St., NW Blake Real Estate 150,000 Q1 19
9 U.S. Department of Commerce 2 1401 Constitution Ave., NW General Services Administration 109,800 $83 Q3 18
- Herbert Hoover Building (Ph IV)
10 1701 Rhode Island Avenue 2 1701 Rhode Island Ave., NW Akridge 100,000 $90 Q1 19
11 1101 16th Street 2 1101 16th St., NW Akridge 100,000 $95 Q1 19
TOP OFFICE PROJECTS UNDER CONSTRUCTION
12 The Wharf (Phase II) 6 Southwest Waterfront Hoffman & Associates / Madison Marquette 547,504 $1,200 Q3 22
13 Sentinel Square III 6 45 L St., NE Trammell Crow Company 545,000 $250 Q2 20
14 250 Massachusetts Avenue 2 250 Massachusetts Ave., NW Property Group Partners 507,764 $275 Q4 19
15 2100 Pennsylvania Avenue 2 2100 Pennsylvania Ave., NW Boston Properties / George Washington 423,562 $360 Q2 22
University
16 2050 M Street 2 2050 M St., NW Tishman Speyer 353,200 Q4 19
17 1900 N 2 1900 N St., NW JBG Smith 259,000 $230 Q4 19
18 Signal House 5 350 Morse St., NE Carr Properties 214,000 $135 Q1 21
19 Cannon House Office Building 6 27 Independence Ave., SE Architect of the Capitol 206,500 $188 Q3 19
Renewal (Ph I)
20 Cannon House Office Building 6 27 Independence Ave., SE Architect of the Capitol 206,500 $188 Q4 20
Renewal (Ph II)
21 1901 L Street 2 1901 L St., NW The Meridian Group 202,000 Q4 19
TOP OFFICE PROJECTS PIPELINE
22 900 New York Avenue 2 900 New York Ave., NW Gould Property Company / 575,000 $250
Oxford Properties Group
23 1700M 2 1700 M St., NW JBG Smith 315,435 2021/22
24 The Yards (Parcel G) 6 1275 New Jersey Ave., SE Brookfield Properties 290,422
25 Reunion Square (Building 4) 8 Shannon Place & W St., SE Four Points / Curtis Development 281,242 2022
26 25 M 6 25 M St., SE Akridge / Brandywine Realty Trust 223,000 $85
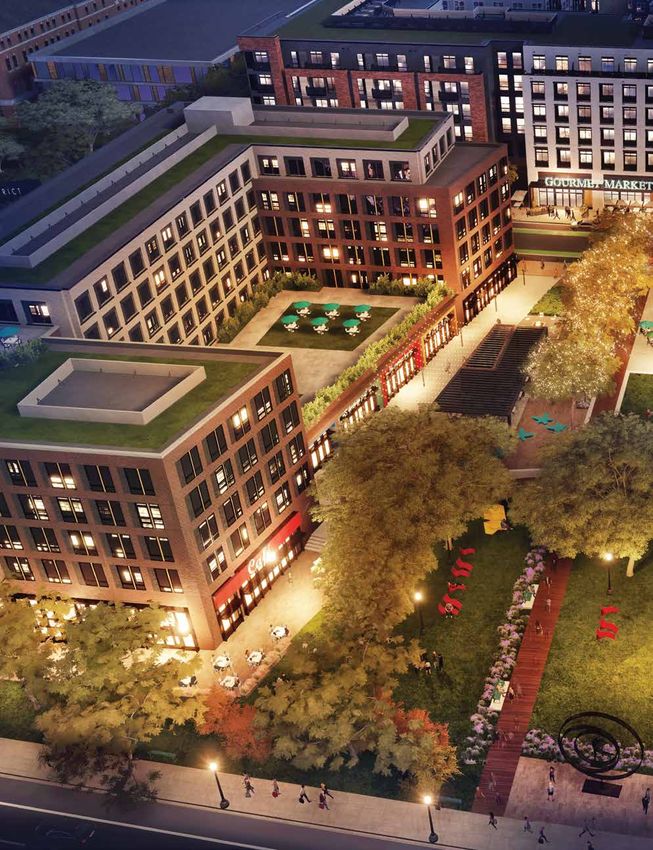
27 South Building (Union Market) 5 1309 5th St., NE EDENS 222,255 $92
28 Saint Elizabeths East (Phase I) 8 Saint Elizabeths East Campus Redbrick LMD / Gragg Cardona Partners / 220,000 $200 2022
DMPED
29 300 7th Street 6 300 7th St., SW Jair Lynch Real Estate Partners 203,414 $122 2021/22
30 Saint Elizabeths East Parcel 15 8 Saint Elizabeths East Campus Redbrick LMD / Gragg Cardona Partners 200,000 $219 2023
31 Embassy of Australia 2 1601 Massachusetts Ave., NW Commonwealth of Australia 133,244 $237 2022
1) may include non-office components & pipeline values may include additional phases ($ in millions)
2) delivery date may reflect phase I delivery or final phase delivery for pipeline projects.
DC DEVELOPMENT REPORT • 2019 / 2020 EDITION 27DEVELOPMENT
HIGHLIGHTS
Image courtesy of Four Points
WARD 6 WARD 8
655 NEW YORK AVENUE REUNION SQUARE (BUILDING 4)
LOCATION: 655 New York Avenue, NW LOCATION: Shannon Place & W Street, SE
DEVELOPER(S): Douglas Development / Brookfield Properties DEVELOPER(S): Four Points / Curtis Development
ARCHITECT(S): Shalom Baranes Associates ARCHITECT(S): Hickok Cole Architects
CONTRACTOR(S): James G. Davis Construction Corp. CONTRACTOR(S): James G. Davis Construction Corp.
LEED: Gold EST. VALUE: $185 million LEED: Gold
STATUS: Completed STATUS: Near Term
TARGETED DELIVERY: Q1 2019 TARGETED DELIVERY: Q2 2022
SPECS: 655 New York Avenue offers 653,000 sq. ft. of office space and up to SPECS: Building 4 is part of the 1.57 million sq. ft. Reunion Square development. It
80,500 sq. ft. of retail space. WeWork has leased 100,000+ SF of office space in will consist of 281,000 sq. ft. of office space and 6,600 sq. ft. of retail space.
the building and the retail is anchored by Leon Restaurants, Compass Coffee,
and Rumi’s Kitchen. The site is an assembly of 19 historic buildings that were
incorporated into the overall development.
WARD 2 WARD 2
1701 RHODE ISLAND AVENUE 250 MASSACHUSETTS AVENUE
LOCATION: 1701 Rhode Island Avenue, NW LOCATION: 250 Massachusetts Avenue, NW
DEVELOPER(S): Akridge DEVELOPER(S): Property Group Partners
ARCHITECT(S): Hickok Cole Architects ARCHITECT(S): Kevin Roche John Dinkeloo & Associates
CONTRACTOR(S): Whiting-Turner Contracting CONTRACTOR(S): Balfour Beatty
EST. VALUE: $90 million LEED: Platinum EST. VALUE: $275 million
STATUS: Completed STATUS: Under Construction
TARGETED DELIVERY: Q1 2019 TARGETED DELIVERY: Q4 2019
SPECS: The former YMCA building was transformed into a 100,000 sq. ft. SPECS: 250 Massachusetts Avenue is a 12-story, 566,000 sq. ft. trophy office
boutique office building leased entirely to WeWork. The new building features building with up to 58,000 sq. ft. of retail space. It is located on the north block
four sides of floor-to-ceiling glass with a range of amenities including a of Capitol Crossing, a three-block, 2.2 million sq. ft. mixed-use development that
landscaped rooftop terrace and conference facilities. will be built above I-395. The office buildings are designed for LEED Platinum
and the entire project will feature an on-site co-generation and stormwater
treatment facility.
28 © 2019 WASHINGTON DC ECONOMIC PARTNERSHIPDEVELOPMENT
HIGHLIGHTS
Image courtesy of Trammell Crow
WARD 2 WARD 6
1900 N SENTINEL SQUARE III
LOCATION: 1900 N Street, NW LOCATION: 45 L Street, NE
DEVELOPER(S): JBG Smith DEVELOPER(S): Trammell Crow Company
ARCHITECT(S): Kohn Pedersen Fox & Associates ARCHITECT(S): SmithGroup
CONTRACTOR(S): Harvey Cleary Builders CONTRACTOR(S): Clark Construction Group / Rand Construction
LEED: Gold LEED: Silver EST. VALUE: $250 million
STATUS: Under Construction STATUS: Under Construction
TARGETED DELIVERY: Q4 2019 TARGETED DELIVERY: Q2 2020
SPECS: 1900 N is an 11-story, 271,400 sq. ft. office building with up to 10,000 sq. SPECS: The third building of the 1.3 million sq. ft. Sentinel Square development
ft. of retail space. The building features an 8,000 sq. ft. indoor/outdoor rooftop will be an 11-story, 556,000 sq. ft. office building, anchored by the Federal
amenity space. Goodwin Procter is the lead tenant leasing 80,000 sq. ft. The Communications Commission, with 11,000 sq. ft. of retail space. Phase I
unique steel truss and cable suspension system supports a third of the building delivered in 2010 and Phase II delivered in 2013.
and allows for a triple-height, entirely column-free lobby experience.
Image courtesy of Gould Property Company
Image by Tomorrow AB, courtesy of Carr Properties & of Gensler
WARD 2 WARD 5
900 NEW YORK AVENUE MARKET TERMINAL (SIGNAL HOUSE)
LOCATION: 900 New York Avenue, NW LOCATION: 350 Morse Street, NE
DEVELOPER(S): Oxford Properties Group / Gould Property Company DEVELOPER(S): Carr Properties
ARCHITECT(S): Pickard
Chilton / Kendall Heaton Associates ARCHITECT(S): Gensler
LEED: Platinum EST. VALUE: $250 million CONTRACTOR(S): John Moriarty & Associates
STATUS: Long Term LEED: Gold EST. VALUE: $135 million
STATUS: Under Construction
SPECS: 900 New York Avenue will be a 610,000 sq. ft. office building with 30- TARGETED DELIVERY: Q1 2021
40,000 sq. ft. of retail space. The building is planned around an indoor/outdoor
garden feature that will flood the building with natural sunlight and feature a SPECS: Signal House (350 More Street, NE) will be an 11-story, 225,000 sq. ft.
150-foot glass atrium. office building with 11,000 sq. ft. of retail. Market Terminal is a 4.9-acre site that
encompasses 300, 325, and 350 Morse Street, NE. The site will be redeveloped
by Kettler, Carmel Partners, Grosvenor, and Carr Properties into a 1.4 million
sq. ft. mixed-use project with 435,600 sq. ft. of office, 1,074 residential units, and
54,700 sq. ft. of retail.
DC DEVELOPMENT REPORT • 2019 / 2020 EDITION 29DEVELOPMENT
HIGHLIGHTS
Image courtesy of Monument Realty
WARD 6 WARD 6
1 M STREET 300 7TH STREET
LOCATION: 1 M Street, SE LOCATION: 300 7th Street, SW
DEVELOPER(S): Monument Realty DEVELOPER(S): Jair Lynch Real Estate Partners
ARCHITECT(S): HOK ARCHITECT(S): Studios Architecture
CONTRACTOR(S): Lendlease CONTRACTOR(S): Gilbane Building Company
LEED: Gold LEED: Gold
STATUS: Under Construction STATUS: Near Term
TARGETED DELIVERY: Q4 2019 TARGETED DELIVERY: Q4 2021
SPECS: 1 M Street will be an 11-story, 131,000 sq. ft. office building with 4,100 sq. SPECS: The existing 149,700 sq. ft. class B office building (aka Reporter's Building)
ft. of ground floor retail space. It will be the new home for the 150-employee will be stripped to its structural concrete, reskinned, and completely renovated for
National Association of Broadcasters (NAB). the new headquarters for WMATA. There is also the possibility that three floors
(20,000 sq. ft. per floor) will be added to the top of the building as the site has a
redevelopment potential of up to 379,260 sq. ft.
Image courtesy of WC Smith
WARD 6 WARD 6
250 M AT CANAL PARK FOUR CONSTITUTION SQUARE
LOCATION: 250 M Street, SE LOCATION: 150 M Street, NE
DEVELOPER(S): WC Smith DEVELOPER(S): Stonebridge Associates / Walton Street Capital
ARCHITECT(S): Hickok Cole Architects ARCHITECT(S): HOK
CONTRACTOR(S): HITT CONTRACTOR(S): Balfour Beatty
LEED: Silver EST. VALUE: $125 million LEED: Platinum EST. VALUE: $250 million
STATUS: Under Construction STATUS: Completed
TARGETED DELIVERY: Q1 2021 TARGETED DELIVERY: Q2 2019
SPECS: 250 M at Canal Park will be a 189,000 sq. ft. Class A office building with SPECS: Four Constitution Square, the final phase of the 2.7 million sq. ft.
7,400 sq. ft. of ground floor retail. It will be the new headquarters for the District Constitution Square mixed-use development, is 100% occupied by the U.S.
Department of Transportation (DDOT). DOJ (4,800 employees across 1.4M sq. ft. in the development). Three & Four
Constitution Square are connected on floors one through six, creating one
860,000 sq. ft. building.
30 © 2019 WASHINGTON DC ECONOMIC PARTNERSHIPDEVELOPMENT
HIGHLIGHTS
WARD 2 WARD 2
2100 PENNSYLVANIA AVENUE ONE FREEDOM PLAZA
LOCATION: 2100 Pennsylvania Avenue, NW LOCATION: 1301 Pennsylvania Avenue, NW
DEVELOPER(S): Boston Properties / George Washington University DEVELOPER(S): Quadrangle Development
ARCHITECT(S): Pelli Clarke Pelli Architects / WDG Architects ARCHITECT(S): JAHN
CONTRACTOR(S): Balfour Beatty CONTRACTOR(S): Hensel Phelps Construction Company
LEED: Gold EST. VALUE: $360 million STATUS: Completed
STATUS: Under Construction TARGETED DELIVERY: Q1 2019
TARGETED DELIVERY: Q2 2022
SPECS: The previous 225,000 sq. ft. office building on the site was demolished
SPECS: The 2100 Pennsylvania Avenue development consists of a 454,000 sq. and a new 13-story, 283,000 sq. ft. office building with 13,000 sq. ft. of retail space
ft. trophy office building with 30,000 sq. ft. of neighborhood-serving retail. (fronting 13th Street) was built in its place. Kirkland & Ellis LLP's 200-attorney
The building will have two wings interconnected by a central atrium space. DC office is the anchor tenant.
WilmerHale is the anchor tenant leasing about 288,000 sq. ft. of office space.
Image courtesy of CoStar
WARD 2 WARD 2
699 14TH STREET AMERICAN GEOPHYSICAL UNION HQ
LOCATION: 699 14th Street, NW LOCATION: 2000 Florida Avenue, NW
DEVELOPER(S): Pearlmark Real Estate / Lincoln Property Company DEVELOPER(S): American Geophysical Union
ARCHITECT(S): Shalom Baranes Associates ARCHITECT(S): Hickok Cole Architects
CONTRACTOR(S): Manhattan Construction Company CONTRACTOR(S): Skanska USA Building
LEED: Gold LEED: Platinum EST. VALUE: $42 million
STATUS: Under Construction STATUS: Completed
TARGETED DELIVERY: Q3 2020 TARGETED DELIVERY: Q1 2019
SPECS: The historic National Bank of Washington building will be restored SPECS: The headquarters for the American Geophysical Union went through
and renovated and a 149,000 sq. ft. office building addition will be built on the a full-building renovation with the goal of becoming a net-zero building. The
adjacent lot. There is up to 25,000 sq. ft. of retail space available. upgrades include a solar array on the roof, a green wall, a municipal sewer heat
exchange system, and auto-tinting Sage Glass.
DC DEVELOPMENT REPORT • 2019 / 2020 EDITION 31DC BizCAP—Funding Your
Small Businesses. Helping You Succeed.
The District of Columbia Department of Insurance, Securities and
Banking offers District entrepreneurs and small business owners access
to capital through the DC BizCAP program. DC BizCAP provides
alternatives to traditional commercial financing and facilitates private
lending and investments.
DC BizCAP funds have helped businesses that range from food and
beverage, health and wellness and transportation to construction and
philanthropic organizations.
Access capital funding for your small business today!
Visit disb.dc.gov
1050 First Street NE, Suite 801 • Washington, DC 20002
(202) 727-8000You can also read