Focus #20 - March 2016 - Managing the consequences of macroeconomic and (geo)political risks - SCOR.COM
←
→
Page content transcription
If your browser does not render page correctly, please read the page content below
Focus
#20 - March 2016

Managing the consequences
of macroeconomic
and (geo)political risks
What role for (re)insurers?
The views and statements expressed in this publication are the sole responsibility of the authors.

CONTENTS
5 A FEW REMARKS ABOUT ASSET BUBBLES
Jean TIROLE, Chairman of the Toulouse School of Economics and Nobel Prize in Economics
8 MANAGING MACROECONOMIC RISKS
Denis KESSLER, Chairman & CEO, SCOR SE
14 MODELLING OF ECONOMIC SCENARIOS
AND THEIR IMPACT ON CAPITAL MANAGEMENT
Michel M. DACOROGNA, Senior Scientific Advisor to the Chairman and CEO, SCOR SE
19 THE VALUE OF TRADE-CREDIT (RE)INSURANCE
IN HIGH GROWTH/EMERGING MARKETS
Tobias POVEL, SCOR Global P&C Regional Credit & Surety Manager, Asia-Pacific, SCOR Global P&C
25 WHAT ROLE FOR (RE)INSURERS IN FINANCING
THE ECONOMY POST-2008 CRISIS?
François de VARENNE, CEO, SCOR Global Investments
30 MANAGING (GEO)POLITICAL RISKS: NEW RISKS,
NEW OPPORTUNITIES FOR (RE)INSURERS?
Victor PEIGNET, CEO, SCOR Global P&C
37 WHAT NEW DEAL BETWEEN THE INSURANCE
AND REINSURANCE INDUSTRY AND THE STATE
TO MANAGE THE RISKS OF THE XXI CENTURY?
Nicolas BAVEREZ, Partner at Gibson, Dunn & Crutcher LLP
41 MANAGING POLITICAL RISKS: AN INSURER’S POINT OF VIEW
Ian ROSS, Executive Director and Group Chief Underwriting Officer, Hollard
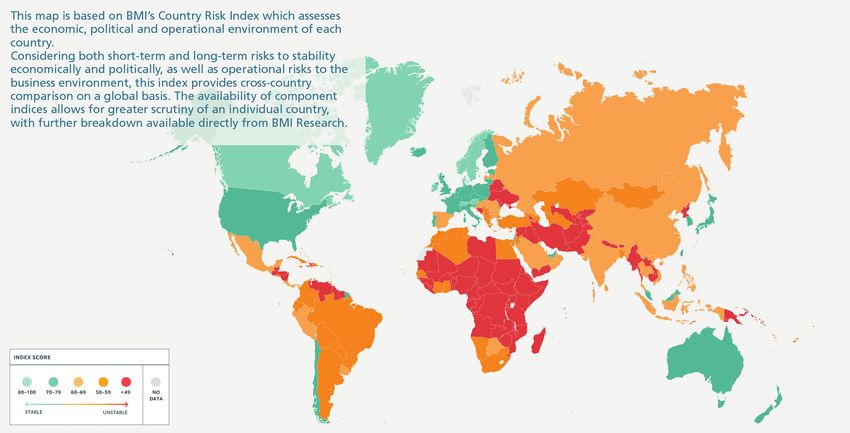
45 MACROECONOMIC AND GEOPOLITICAL RISKS
FOR GLOBAL COMPANIES: A CORPORATE’S POINT OF VIEW
François QUENTIN, Chairman France, HUAWEI
48 TRADITIONAL COVERS AND INNOVATION
IN POLITICAL RISKS INSURANCE
Tom CORFIELD, Chief Underwriting Officer, The Channel Syndicate
Kade SPEARS, Head of Specialty, The Channel Syndicate
51 HOW RISK MODELS HELP TO CREATE NEW (RE)INSURANCE MARKETS
BY SUPPORTING RISK QUANTIFICATION AND MANAGEMENT
Paul NUNN, Head of Risk Modelling and Global Natural Hazards, SCOR Global P&C
INTRODUCTION

      This 20th FOCUS publication is based on content shared at the SCOR Global P&C 2015 Annual Conference, which was held on
      1-2 October 2015 in Paris.

      SCOR Global P&C wishes to thank all the contributors.

4      SCOR GLOBAL P&C - FOCUS #20 - MARCH 2016
A FEW REMARKS ABOUT ASSET BUBBLES

A FEW REMARKS
ABOUT ASSET BUBBLES

                                Jean TIROLE
                                Chairman of the Toulouse School of Economics and Nobel Prize in Economics

        Jean Tirole is Chairman of the Toulouse School of Economics and of the Institute for Advanced Study in Toulouse,
        scientific director of the IDEI at the University of Toulouse Capitole, and visiting professor at MIT. He is the laureate of
        numerous distinctions, including the Sveriges Riksbank Prize in Economic Sciences in Memory of Alfred Nobel in 2014.

Introduction
Financial markets do not necessarily reflect the evolution of the          resurrection if they are in trouble or to get a shot at moving to
real economy. One aspect that has attracted much attention in              the top of the chart.
this respect is asset overvaluation. I will focus my presentation
on rational bubbles. You should be aware that overvaluation                When I started working on bubbles many years ago, I was
has been studied from other angles. Another approach that                  following in the footsteps of Allais, Samuelson and Diamond:
economists have used is based on disagreements about prior                 I applied their ideas to asset bubbles, which I defined as the
beliefs. For example, one investor may believe that a certain              difference between the price and the fundamental, as described
asset is valuable, while another may disagree, but may change              in the formula in Figure 1 in the case of investor risk neutrality
his mind in the future and believe the asset is extremely valuable.        and a safe bubble (a rather unrealistic case that is just meant to
This gives rise to some form of overvaluation. Another route to            simplify the exposition). The fundamental is then equal to the
overvaluation that economists have studied is based on agency.             present discounted value of future dividends. The bubble, which
Asset managers may be eager to buy a risky asset such as a                 is the residual or overvaluation relative to the fundamental,
bubbly asset just because it's risky, allowing them to gamble for          grows at the rate of interest.

FIGURE 1:
                               Focus on rational bubbles:                 pt = Ft+Bt       where

                                                                                             dt+T
                          FUNDAMENTAL                  Ft        Σ∞   T   =1
                                                                                 (1+rt+1 )...(1+rt+T )

                    BUBBLE COMPONENT
                                                       Bt+1       (1+rt+1 )Bt

                                                                                          SCOR GLOBAL P&C - FOCUS #20 - MARCH 2016              5
A FEW REMARKS ABOUT ASSET BUBBLES

    Detecting bubbles
    In practice, it is not easy to detect bubbles. Robert Shiller at Yale    FIGURE 2:
    has used two distinct strategies to detect them. The first consists      BUBBLE SUBSTITUTION:
                                                                             BUBBLE SHIFTS FROM ONE ASSET TO ANOTHER
    in noticing that the volatility of stock prices vastly exceeds what
    would be predicted from the time series of dividends (and thus
    the fundamental). Second, one can look, as he did for the real            Bubble per capita
    estate market, at the price-earnings ratio; the presence of a
    bubble may be suspected if the price substantially exceeds what                               ^
                                                                                                  b
    is expected from the likely earnings and interest rate evolution.

                                                                                                   ^                           g
    Only assets that are scarce and durable can support a bubble;                                 bt                          bt
    otherwise, they would be replicated (for assets that are not
    scarce) or rational participants would anticipate that someone
    will get stuck with the hot potato (if the horizon is finite). Limited
    short sales are also necessary for bubble, so as to ensure scarcity.                                                       s
                                                                                                                              bt
    It is also possible to end up with bubble substitutions, where
    individual bubbles burst, and then other bubbles appear                                                   Time
    elsewhere. Some have claimed that a bubble substitution,
    illustrated in Figure 2, may have occurred recently.
                                                                                                                             Source: Tirole 1985.
    The Standard & Poor Shiller index, which is based on the price-
    earnings ratio, suggests that we may have entered a bubble in
    2013. There can be various theoretical explanations for this,
    such as Quantitative Easing, the collapse of oil prices, or the
    collapse of bubbles in the emerging markets, creating bubble
    substitution across countries.

    What do we know about bubbles?
    First, bubbles fill a void. It is important to understand that assets    They looked at the relationship between capital income, which
    are stores of value. A shortage of stores of value leads to a rise       includes equity, bonds, etc., plus investment, and related the
    in their price, lowering the interest rate. Investors then reach for     following two inequalities:
    yield and look for assets to invest in, and that is when rational
    bubbles can arise.                                                                        rate of interest < rate of growth
    Such bubbles are indeed sustainable if the rate of interest is less                                      and
    than the rate of growth of the economy. Otherwise, the bubble                               capital income < investment
    would grow very fast relative to the economy, making it hard for
    people to buy and at some point; the bubble would necessarily            Their conclusion was that capital income was greater than
    burst.                                                                   investment for the US and the six other countries they studied,
    The implication of this is that a bubble on an asset is less likely      suggesting that such bubbles may not exist.
    to occur if there is an abundant supply of competing stores of
    value (for example public debt, a bubble on another asset such
                                                                             Using better statistics that were not available at the time of the
    as real estate, etc.).
                                                                             Abdel et al. paper, François Geerolf, a French assistant professor
    Is the rate of interest less than, or equal to the rate of growth?       at UCLA, showed recently that nowhere is capital income
    Given that there is a multiplicity of rates of interest, and that the    greater than investment. For countries like Japan and South
    rate of growth is not easy to measure or forecast, Abel, Mankiw,         Korea, capital income is much lower than investment, which
    Summers and Zeckhauser in a paper published in 1989 used                 suggests that the rate of interest is less than the rate of growth,
    another criterion.                                                       a condition that makes rational bubbles feasible.

6        SCOR GLOBAL P&C - FOCUS #20 - MARCH 2016
A FEW REMARKS ABOUT ASSET BUBBLES

Do bubbles substitute for, or promote capital accumulation? The          and the firms which own the bubble leads to a recession, which
literature of the 1980s concluded that bubbles, competing for            causes the central bank to lower the interest rate even further.
savings, crowd out productive investment.
                                                                         We know that it is probably much costlier to prick a bubble than
                                                                         to prevent one, especially if the bubble is held by a leveraged
                                                                         institution. Policy decisions should indeed take into account the
     With Emmanuel Farhi, a                                              type of bubble in question. If the bubble is held by retail banks,
     professor at Harvard, we showed                                     for example, this is cause for concern especially if they do not
     more recently that if firms or                                      possess enough capital and liquidity. If they are held by retail
     banks need stores of value,                                         investors in mutual funds which are not guaranteed, the risk is
     it becomes quite ambiguous                                          not big, investors will just lose money when it bursts.
     whether bubbles and capital are
     complements or substitutes.                                         Globalisation can transform excess demands for assets in
                                                                         countries with underdeveloped financial systems into capital
                                                                         flows. China has a lot of savings, but no solid financial market in
                                                                         which to invest. In academia, this situation is known as having
                                                                         ‘no parking spaces’. The US on the other hand can create
A bubble is a store of value, albeit a very risky one. It can compete    and offer more parking spaces; securitisation, besides evading
for savings with productivity investment, but at the same time it        prudential requirements, was also about creating more parking
has a liquidity effect.                                                  spaces that could be purchased by the investors. Of course, this
                                                                         migration of savings raises the price of assets in the US, thus
It has been observed that a bubble crash leads to a reduction in         lowering the rate of interest. With low rates of interest, bubbles
the interest rate. The reduction in the net worth of the banks           may emerge.

What don’t we know about bubbles?
First, it is difficult to predict a bubble… We know they are likely      long term, but it may not be possible to commit in the long term
to emerge if interest rates are low but it does not mean we              to a rise in interest rates, particularly if this creates a recession.
can predict them, because a bubble is based on a consensus.              The debate as to whether bubbles should be addressed with
Investors accept an overvaluation only because others do as              monetary policy or other tools (prudential regulation, loan-to-
well. For instance, a real estate bubble exists because we believe       income requirements for real estate bubbles, etc.) is still very
real estate prices are going to keep growing. There must be              lively.
some consensus, and this is something that economists are not
very good at predicting.                                                 There is still a lot of work to do and we definitely need more
                                                                         time and data to understand bubbles.
Second, we are not very good at detecting bubbles. To be
certain, the formula is very clear; there is a fundamental and
there is a bubble, but to detect a bubble, you have to know the
fundamental, which is no easy task.

Third, should central banks lean against the wind if they perceive
the existence of a bubble? In the Jackson Hole consensus 10                      ”THE DEBATE AS TO WHETHER
years ago, Bernanke, Gertler, Greenspan and others argued that
                                                                                 BUBBLES SHOULD BE ADDRESSED
bubbles are difficult to detect, and that, if that a bubble has
been identified, monetary policy should not be used. Bubbles are                 WITH MONETARY POLICY OR
associated with low rates of interest, so it is theoretically possible           OTHER TOOLS (...) IS STILL VERY
to raise the rate of interest and thereby try to prick the bubble.               LIVELY.”
But when raising the interest rate for a short period of time,
the bubble actually further inflates. In order for monetary policy
to be successful in pricking a bubble, it must be credible in the

                                                                                         SCOR GLOBAL P&C - FOCUS #20 - MARCH 2016                 7
MANAGING MACROECONOMIC RISKS

    MANAGING MACROECONOMIC RISKS

                                    Denis KESSLER
                                    Chairman & CEO, SCOR SE

            Denis Kessler, a French citizen, is a graduate of HEC business school (Ecole des Hautes Etudes Commerciales), holds a
            PhD in economics and advanced degrees in economics and social sciences, and is a Fellow of the French Institute of
            Actuaries. He was Chairman of the Fédération Française des Sociétés d’Assurance (FFSA), Senior Executive Vice‐President
            and member of the Executive Committee of the AXA Group and Executive Vice‐President of MEDEF (Mouvement des
            Entreprises de France). He joined SCOR as Chairman and Chief Executive Officer in 4 November 2002. In January 2016,
            he was elected to join the French Institute’s Academy of Moral and Political Sciences.

    Introduction: reinsurance and macroeconomic
    and macrofinancial risks
    SCOR likes to take calculated risks...                                It does not like to make bets (such as insuring Michael Jackson’s
    but it has no appetite for economic and financial risks.              last tour, for example). The probability distribution can be
                                                                          observed, inferred or modelled. Scenarios represent a way to
    Taking risks is intrinsic to the business of reinsurance. Each        infer probability distributions, even when historical data is scarce
    (re)insurance company has a risk appetite, whether it is low,         or not available. Emerging risks, such as cyber risks, create a
    moderate or high. Sometimes the risk appetite is not explicit,        problem of absorbability in the probability distribution, but even
    but it can be inferred from the risk portfolios the company           a hazy scenario will allow us to underwrite business. The more
    chooses to underwrite.                                                we accumulate knowledge and data, the more we enlarge the
                                                                          offering of coverage through (re)insurance.
    At SCOR, we define our risk appetite every three years, within
    the scope of our Strategic Plan. It is the responsibility of our      It is easier to insure well defined and observable events that
    board to define the level of our risk appetite and to ensure that     are accidental by nature, are not progressive, and whose
    we respect it. The risk appetite will then determine everything we    consequences and occurrences are properly identifiable and
    do with our partners and which lines of business we underwrite.       measurable (e.g. death, survival, fire and natural catastrophes),
    SCOR is one of the very rare companies to have a formal risk          than to insure serial events such as asbestos, or risks with moral
    appetite that is defined, approved and checked by its board.          hazard issues, which require extremely careful underwriting.
    That risk appetite is then translated into a series of well-defined
    metrics relating to risk drivers, lines of business, etc., which we   With regard to the latter type of events, millions of contracts
    are required to respect.                                              that were written 20 years ago are now generating small but
                                                                          increasing payouts over a very long period of time, because
                                                                          scientific knowledge has changed.
        SCOR is open to insuring risk,
        as long as it is associated with                                  The accumulative amounts generated by these payouts could
        a probability distribution.                                       create a serial risk, leading to a major catastrophe for insurers.

8       SCOR GLOBAL P&C - FOCUS #20 - MARCH 2016
MANAGING MACROECONOMIC RISKS

Events in the economic and financial world entail risks that could   Concerning more specifically Credit & Surety, SCOR provides
potentially cause huge losses, through:                              guarantees for individual failures and contains macroeconomic
                                                                     risk by underwriting only short-term guarantees.
› c ycles, booms, fluctuations and bubbles
› d
   isruptions, discontinuity and distress;                          At the same time, we believe that financial markets can offer
                                                                     agents tools to protect their assets from macroeconomic and
› f ailures, bankruptcies and systemic risk;
                                                                     macrofinancial risk, through options, swaps and derivatives. Such
› m
   arket closure and liquidity issues.                              tools allow agents to directly exchange or trade their respective
                                                                     risks. Reinsurance companies, however, should not play the role
At SCOR, we have deliberately chosen to refrain from offering        of the counterparty of macroeconomic or macrofinancial risks.
protection for macroeconomic and macrofinancial risks.
                                                                     Furthermore, we are exposed to the changes in the
However, SCOR is exposed to economic and financial risks             macroeconomic environment in which we operate. The
even if it has no appetite for them, and has to manage               value of what is insurable and insured is dependent on the
that exposure.                                                       macroeconomic environment. The values we protect will depend
                                                                     on the economic cycle and all the associated variables, such as
As a reinsurer, SCOR is a “risk absorber” and faces a multiplicity   Gross Domestic Product (GDP), inflation, interest rates, credit
of risks that vary by nature, by size and by frequency. However,     spreads and foreign exchange. These affect SCOR’s assets and
we only have an appetite for risks that are diversifiable and        liabilities, its net worth and its capacity to take risk.
proportionate to our absorbing capacities. The distinction
between gambling and reinsurance lies precisely in the capacity      Let us take a more in-depth look at four of these macroeconomic
of reinsurance to diversify its risk.                                risks: GDP evolution; inflation; interest rates; and foreign
                                                                     exchange rates.
We have no specific appetite for macroeconomic risks because
they are non-diversifiable by nature and too dependent on the
political decisions made by governments or central banks. These
decisions are not random but Diracian, and are altered by moral
hazard, which means that they have no quantifiable distribution
probability.                                                                ”THE DISTINCTION BETWEEN
                                                                            GAMBLING AND REINSURANCE
Furthermore, we have no appetite for interest rate risk. SCOR
does not provide guarantees for capital or investment returns.
                                                                            LIES PRECISELY IN THE CAPACITY
It does not underwrite variable annuity portfolios. SCOR has no             OF REINSURANCE TO DIVERSIFY ITS
appetite to cover any kind of market risks faced by the assets              RISK.”
associated with its clients’ liabilities.

Dependency on Gross Domestic Product (GDP)
Insurable amounts are proportionate to GDP. As shown in              Moreover, over the long term, there is a co-integration
Figure 1, insurance penetration increases with the GDP level per     relationship between insurable wealth, the level of GDP and the
capita. Therefore an increase in GDP is good for insurance. It       level of GDP per capita. Although economic development does
is also good for reinsurance, but not as much as for insurance,      provide more substance to insurance and reinsurance, we are
because reinsurance trades and deals more with stock variables       subject to macroeconomic risk.
(buildings, equipment, human capital, etc.) than with flow
variables (revenues, consumption, investment, etc.). Let’s take      A crisis is less negative for reinsurance than for many other
the example of a skyscraper in New York: even if it is standing      industries. But some lines of business, such as Marine, Credit
empty, the owner will insure it and the insurer will have to         & Surety and Construction, are significantly dependent on GDP
reinsure it because of the size of the potential losses.             fluctuations.

                                                                                    SCOR GLOBAL P&C - FOCUS #20 - MARCH 2016             9
MANAGING MACROECONOMIC RISKS

     On the asset side, the interest rate of fixed income assets, as             being highest in booms and lowest in busts.
     well as stock market and real estate values, fluctuates with GDP,

     FIGURE 1:
     INSURANCE PREMIUMS IN % OF GDP RISE FASTEST
     IN EMERGING MARKETS

                                                                                                                                               US
      4% Premiums as a % of GDP
                                                                                                                                  Canada            Switzerland

                                                                                                        Venezuela
                                                                                                                                           Germany
      3%                                                                                                                                   France
                                                                                                                               Spain
                                                                                             South Africa
                                                                                                                                          UK
                                                                                                                                 Japan
                                                                  Morocco              Namibia                      Portugal                Australia
      2%                                                                                                                             Italy
                                                                 Kenya                                Brazil
                                                                                                             Poland                     Ireland
                                                                                               Colombia
                                                                                              China                      United Arab Emirates
                                                                                                                                Hong Kong
                                                                                                           Russia   Greece
      1%                                                                                                               Saudi Arabia
                                                                                                        Mexico
                                                                                             Angola
                                                                                 Indonesia

      0%                                                                     Nigeria
            0.1                                      1                                             10                                                  100
                                                                                                                                   GDP per capita in USD 1000

                                                                                                            Source: Swiss Re Economic Research & Consulting

     Dependency on inflation
     Inflation is damaging for Property & Casualty (P&C) and Health              FIGURE 2:
     because of the lag between premiums and claims. However,                    INFLATION SHOCKS PUSH UP THE SIZE OF LOSSES FOR ANY
                                                                                 GIVEN LOSS DISTRIBUTION
     what is more damaging to these lines of business is not the actual
     level of inflation but a change of regime, i.e. an acceleration of               Loss
     inflation. As Figure 2 shows, inflation shocks push up the size of           probality (%)
     losses for any given loss distribution, whereas premiums have                                          Claims before                   Claims after
     been collected on the basis of the initial size of losses. So it is                                inflation resurgence           inflation resurgence
     not surprising that reinsurers usually prosper in locations with a
     history of low inflation.

     P&C and Health liabilities typically have an elasticity to inflation
     of two or more. Conversely, liabilities consisting of biometric
     risks are not correlated to inflation, except in the very long term,
     because they cover fixed nominal amounts which exclude, by
     construction, any link to inflation. The value of statistical Life is
     only slightly correlated to inflation, its main drivers being court
     decisions and income levels.                                                                                      Loss size ($)
                                                                                                                                                           Source: SCOR

10       SCOR GLOBAL P&C - FOCUS #20 - MARCH 2016
MANAGING MACROECONOMIC RISKS
On the asset side, the situation with regard to inflation is expert judgments. Based on ProBex, we estimate that there is
split: bonds are affected by inflation that induces interest rate only a 17.7% probability of a 1/100 years extreme inflationary
increases/capital losses, while equities/real estate offer good shock happening in the same year as a 1/100 years or worse
protection against inflation. extreme P&C loss.
SCOR has been able to profitably combine Life with P&C
reinsurance, because these two risks are not exposed to the
same type of economic variables. Moreover, we have worked
Thanks to diversification, the cost
out our diversification so as to diversify the risk of inflation in
P&C. To estimate P&C dependencies when data is too scarce, of a surge of inflation is minimised.
SCOR uses ProBex, its own statistical tool based on pooling
Dependency on interest rates
Interest rates and credit spreads are not independent variables: and real estate portfolios, inducing capital losses. But, if the
they are driven by and therefore correlated with other increase in interest rates is due to inflation and is proportionate
macroeconomic variables such as GDP, inflation and monetary to it, only the fixed-income asset portfolio will be negatively
policy. affected, while equities and real estate, which offer good
protection against inflation, will not.
SCOR’s dependency on interest rates does not come from any
macroeconomic guarantees it underwrites - we don’t supply The impact of an interest rate increase on Net Asset Value
such guarantees - but through the discounting of anticipated depends on the accounting standards used (IFRS versus
liabilities, discounting which uses the “risk free” interest rate. An economic) and on the direction and magnitude of the Asset-
increase in interest rates is good for reinsurance as it increases Liability Mismatch, if any. In terms of Solvency 2 accounting
the discounting of our liabilities, especially of those liabilities standards, which are economic and therefore more accurate
with the longest duration in P&C and Life (long tails). It shrinks for assessing economic consequences, SCOR is well protected
the liability side of the company. against an increase in interest rates thanks to a shorter duration
of assets compared to liabilities: an increase in interest rates
With regard to assets, these are highly dependent on the interest would increase the economic net asset value and the available
rate. An increase in interest rates increases the remuneration of capital, decrease the required capital and increase the solvency
new investments in bonds, but reduces the value of the existing ratio, allowing us to take more risk.
fixed-income asset portfolio as well as the value of the equity
Dependency on foreign exchange rates
Foreign exchange rates are volatile (Figure 3) and driven by other we avoid exposure to foreign exchange rate fluctuations.
macroeconomic variables such as the current account, the share
of foreign debt, interest rates, GDP, inflation and monetary The Group is nevertheless affected in the following cases:
policy. As SCOR is an international group, all the items on our
income statement and balance sheet are built from different › W
hen claims in one currency area deviate beyond the capital
currencies, especially the dollar and the euro, and are therefore of the local entity, requiring the support of the Group and the
affected by the fluctuations of these currencies. injection of cash from a different currency area;
Structurally, however, the Group is well protected against foreign › B
ecause we book them in euros , the Net Income, Net Asset
exchange rate fluctuations as it is congruent, i.e. assets in one Value, Available Capital, SCR and Solvency Ratio are sensitive
currency cover our liabilities in the same currency (reserves + risk to foreign exchange rates whose impact is positive when the
margin + own funds). By not gambling on the exchange rate, euro weakens with regard to the other currencies.
SCOR GLOBAL P&C - FOCUS #20 - MARCH 2016 11MANAGING MACROECONOMIC RISKS
FIGURE 3:
WIDE UNPREDICTABLE SWINGS
OF (REAL EFFECTIVE) FX RATES 140
120
100
80
Euro
60
USD
Yen
40
Sep Apr Nov Jun Jan Aug Mar Oct May Dec Jul Feb Sep Apr Nov Jul Jan Aug
70 73 75 78 81 83 86 88 91 93 96 99 01 04 06 09 12 14
(100= long term average for each currency) Source: SCOR
E
COD CTION
DE
LA
U
STRET DE
CON TIO
N
BITA
L’HA
Concluding remarks
Taking macroeconomic risks into account helps us to Group has remained well positioned throughout the crisis to
anticipate shocks and to absorb them with limited stress. absorb all the macroeconomic and macrofinancial shocks that
have impaired the global economy since 2007.
SCOR has a well-defined strategy of avoiding unnecessary macro-
economic risks, which consists of: (Re)insurers should protect themselves against macroeconomic
and macrofinancial variables through the way in whichCOCIVDIL they
E
› a voiding insuring global macroeconomic risks, i.e. importing manage their assets and liabilities.
the asset risks of our clients into our liabilities (for example,
we don’t reinsure variable annuities);
› a nticipating and mitigating macroeconomic shocks.
The Group’s strategic plan plays a key role in the process of In this regard, (re)insurers have an
anticipating macroeconomic shocks, through: incredible role to play in smoothing
out macroeconomic fluctuations Articl
e
L. 11 :
1-1
› t he careful analysis of the current economic and financial
3-1
and financial situations, and helping
situation and its risks (the Chinese slowdown, the decoupling
to absorb macroeconomic shocks.
of Europe, Asia and the US and the consequences thereof
for underwriting, the uncertainties of monetary policies and
their impact on the yield curve, the resulting international
financial instability and its impact on FX rates);
› s tress testing of the company under extreme scenario
assumptions of activity, inflation, interest rates and FX rates. The nature of (re)insurance makes this possible. (Re)insurance
covers catastrophe shocks, and thanks to its global reach
Articl
e:
it is
L. 11
1-1
able to mitigate their induced macroeconomic consequences. 3-1
When looking at the net asset value of SCOR over the last 10
Because of its long-term liabilities and its positive cash flow
years, it is not a straightforward matter to identify the impact of
business, (re)insurance is not forced into the hasty / distressed
the economic and financial crisis on the Group, as SCOR’s value
disposal of assets. It can wait and, over the longer term,
(Figure 4) and ratings have been steadily increasing. Thanks to
manage the mean reversion of those assets that are temporarily
diversification and active macroeconomic management, the
12 SCOR GLOBAL P&C - FOCUS #20 - MARCH 2016MANAGING MACROECONOMIC RISKS
depressed by a financial shock. Reinsurers, especially Tier 1 During the financial crisis, insurance demand for long-term
reinsurers, are better equipped than other financial institutions risk-free bonds has increased their price, while durations have
to absorb very large deviations and shocks, because they have increased due to the fall in interest rates, and the share of stocks
a structural excess of capital compared to prudential standards. in European insurer portfolios has slightly increased. Moreover,
in 2008, nine of the largest reinsurers incurred USD 30 billion
This ability to smooth and absorb macroeconomic shocks has in investment-related losses but, thanks to their robust liquidity
been confirmed throughout the past few years. Around 60% positions and excess capital (estimated at USD 25 billion by
of the losses generated by the World Trade Center attacks have Standard & Poor's), few reinsurers were forced to crystallize
been paid by companies whose headquarters are outside the these investment losses, which were carried forward unrealized
US. High ratios of international participation can also be found and began to be reversed in 2009.
for the losses generated by Katrina-Rita-Wilma, the Tohoku
earthquake and Tsunami, Hurricane Sandy, and so on.
FIGURE 4:
SCOR'S SHAREHOLDERS' EQUITY SINCE 2006
In € millions
7000 Liquidity crisis European Sovereign
debt crisis € 6.0 bn
6500 Oct-12: Hurricane Sandy
Oct-11: Floods in Thailand
6000 Nov-06: Acquisition Jun-15: Chinese
of Revios Jun-13: Acquisition
slowdown
May-10: Greece bailout Aug-11: Acquisition of Generali US
5500 of Transamerica Re
May-15:
Aug-07: Acquisition of Converium Feb-10: Earthquake Greek crisis
5000 in Chile
Jan-07: European storm Kyrill End of 14: EUR
depreciation
4500
Oct-07: Fires in Jan-09: European Aug-13: German Hailstorms
4000 Southern California storm Klaus
Jan & Feb-11: Floods in Australia Jun-13: European
3500 Feb & Jun-11: Earthquakes in New Zealand & Alberta Floods
Mar-11: Earthquakes and tsunami in Japan
Sept-08: Hurricanes
3000 Gustav & Ike in the US
Aug-07: Aug-11: Loss of AAA rating by the US
Beginning
2500 of the Sept-08: Lehman Jan-12: Loss of AAA rating by France
subprime crisis Brothers bankruptcy
2000
Dec06 Jun07 Dec07 Jun08 Dec08 Jun09 Dec09 Jun10 Dec10 Jun11 Dec11 Jun12 Dec12 Jun13 Dec13 Jun14 Dec14 Jun15
SCOR shareholders equity
SCOR GLOBAL P&C - FOCUS #20 - MARCH 2016 13MODELLING OF ECONOMIC SCENARIOS AND THEIR IMPACT ON CAPITAL MANAGEMENT
MODELLING OF ECONOMIC SCENARIOS
AND THEIR IMPACT ON CAPITAL
MANAGEMENT
Michel M. DACOROGNA
Senior Scientific Advisor to the Chairman and CEO, SCOR SE
Michel Dacorogna, is scientific advisor to the Chairman of SCOR. He conducts research in the field of insurance
mathematics, capital management and risks. He is also involved in presenting to management and to customers SCOR
models and capital management techniques. Member of the board of the SCOR Science Foundation and of the joint
Research Center on Insurance Risk with the Nanyang Technical University of Singapore, he makes sure that SCOR
sponsorship is well put in use and known in the academic world and recognized by the industry. Until July 2013, Michel
was deputy group Chief Risk Officer in charge of Solvency II and the internal model. He was at the origin of SCOR’s
internal model, which he developed for more than 10 years.
Influence of the economy on insurance business
and investments
We all know that the World economy has direct impacts on › C
redit cycles affect credit and surety insurance, as well
insurance business and investments. In Figure 1, we list the most as the corporate bonds held by the company, perhaps even
important ones. the equity and the default of the insurer or reinsurer. All of
this will affect the balance sheet, both on the liability and
› Interest rates have an effect on bonds, affecting the value asset side.
and the risk. When facing a distant risk 10 years down the
road whilst able to earn a 5% interest in the meantime, the Indirectly, economy also affects the price of (re)insurance
risk will look smaller than if there was zero interest. because if a certain target rate is fixed for a business without
getting any related return on investment, underwriting will be
› Inflation impacts insurance because the claim inflation changed in order to get a higher return. All of this has complex
indices follow the Consumer Price Index (CPI) and are usually effects on the balance sheet of an insurance company.
much higher. Moreover, inflation affects the price of houses, The dependencies between these macroeconomic variables
goods and services as well as the contracts which include make it even more complex and hard to handle. The real Gross
stabilisation clauses. Domestic Product (GDP) will necessarily affect the investment
indices as they move together but on the other hand, if there
› Investment indices have an impact on the insurance are problems on a market, central banks will try to fight the
market. The assets that back the reserves must be placed on recession, which will in turn affect the interest rate. There are
the market. A 0% interest on a risk-free rate has an impact complex and dynamic dependencies which are very difficult to
on reserves. If an investment is lagging, the bottom line will model for. Yet, to capture well the risks, an Economic Scenario
also inevitably be lagging. Generator (ESG) must be able to include all those dependencies.
14 SCOR GLOBAL P&C - FOCUS #20 - MARCH 2016MODELLING OF ECONOMIC SCENARIOS AND THEIR IMPACT ON CAPITAL MANAGEMENT
FIGURE 1:
INFLUENCE OF THE ECONOMY ON AN INSURANCE COMPANY
INTEREST RATES INVESTMENT INDICES
Value of bond investments Value of
- Government bonds - Equity investments
- Corporate bonds - Hedge fund investments
(Re)Insurance business - Real estate investments
- Life business - Structured products
- Discounting of the reserves - Index Derivatives
WORLD
ECONOMY
INFLATION CREDIT CYCLE
Severity of the credit and
Severity of (Re)Insurance losses surety business
- Prices of houses and goods Value of corporate bonds
- Prices of services (defaults and credits
spreads)
- Value of stabilisation (index)
clauses in reinsurance treaties Defaults of reinsurers or
retrocessionaires
Source: SCOR
The Economic Scenario Generators (ESG),
motivation and purpose
The economy can directly affect certain lines of business, like In order to assess risk with the ESG, several things must be
for example recession impacting the severity of aviation losses considered:
if people travel less and provide less premium while aviation
companies try to save money by easing up in maintenance; › A
consistent economic scenario: modelling asset and
liability affected by the Global economy, computing
or the dependency between mortality and financial risk which
the expected return of investment, the risk and the full
could reduce the investment return made on the market in case
distribution and to taking a business decisions based on that.
of very big pandemic, precisely when the company would have
to pay big claims. › A
very demanding set of variables to model: taking
into account economic variables (yield curves, asset classes,
inflation, GDP) plus several currency zones and calculating
correlations and dependencies between all economic
variables
It is necessary to take into
› M
odel additional known effects: taking in to account the
account both sides of the
heavy tails of distributions and the autoregressive volatility
balance sheet -the liabilities clusters. In order to price business, an arbitrage-free yield
and the assets- to build an curve and a dynamic behaviour are needed.
internal model. These are
› S
hort term and long term scenarios: the scenarios should
linked not only through cash
not only deliver expectation and risk for up to a year, but
flow but are interdependent should be able to provide consistent scenarios over much
through various risk drivers. longer periods like 30 years, if they were to be used for
valuing long-term life business.
SCOR GLOBAL P&C - FOCUS #20 - MARCH 2016 15MODELLING OF ECONOMIC SCENARIOS AND THEIR IMPACT ON CAPITAL MANAGEMENT
There are essentially two types of ESG: parametric and non- It is to be noted that the CIR gives mostly an inverted yield curve
parametric models. Parametric models are scenarios based while, in the market, it is only the case in 20% of the time,
on calibrated models. They require a special calibration for usually being a sign of an upcoming recession. It turns out that
the initial state of the model. The non-parametric models are CIR gives 66% of the time an inversted yield curve on the long-
direct simulation models for the future, using historical data. run. This is due to the fact that it was developed mostly for
The method used at SCOR is semi-parametric models, or short-term valuation of swaptions and is used here for one year
bootstrapping, wherein shocks must be added to the system forecast.
and somehow smooth the yield curve.
Putting an inverted yield curve as an average yield curve into
The parametric model that is most often used in this kind of an internal model would be a bad idea, because it would
ESG is the Cox Ingersoll Ross model (CIR) which was designed to encourage setting a low duration on the bond portfolio in order
price interest rate swaptions over three months. By employing it to get the highest yield, which is not realistic since, most of the
on the Swiss yield curve of 2003, one can see how its dynamics time, the highest yield is for the longer maturities. Therefore the
evolved over the quarters (Figures 2 and 3). We display in these CIR model needs to be replaced by other methods, such as the
graphs, the average of 1’000 simulated yield curves over three bootstrapping one that is used at SCOR.
quarters as produced by the CIR calibrated on the current yield.
FIGURE 2: FIGURE 3:
QUARTERLY BEHAVIOUR OF THE CHF YIELD CURVE: QUARTERLY BEHAVIOUR OF THE CHF YIELD CURVE:
REAL BEHAVIOR COX INGERSOLL ROSS SIMULATION
Rate Rate
4,5% 4,5%
4,0% 4,0%
3,5% 3,5%
3,0% 3,0%
2,5% 2,5%
2,0% 2,0%
1 2 3 4 5 6 7 1 2 3 4 5 6 7
Time to maturity [Y] Time to maturity [Y]
The bootstrapping method, simulating and testing
When the dependency between the variables is unknown, the A weak mean reversion must also be added to the historical
bootstrapping method gambles that the future behaviour of the data. This prevents interest rate from being left to drift for over
dependence will be similar to the one seen in the data (Figure 30 years so that it reaches 120% or fails to minus 10%, for
4). For this reason, the data set must be limited to a period example.
where the dependency is accurately describing the current
situation. It would not make sense, for instance, to use data of For keeping the historical dependence between the data, they
the beginning of the 20th century or of the great depression of must be all taken simultaneously on a quarter, to build vectors of
the thirties, as the dependences between the various economies synchronised data. The last data vector will be used as the initial
were very different at that time. So, our choice is limited to state, from which to start the simulation. The scenarios are then
the most recent period. This makes it necessary to introduce built by adding innovation vectors to this initial state.
artificially a tail correction to make sure that a sufficient number
of financial crises is included in the projected scenarios as they The innovation is the difference between the expected price of
are not already present in the considered history. the next step and the true price. It is built by looking at the
16 SCOR GLOBAL P&C - FOCUS #20 - MARCH 2016MODELLING OF ECONOMIC SCENARIOS AND THEIR IMPACT ON CAPITAL MANAGEMENT
FIGURE 4: Historic Innovation vectors Last known Future simulated
date vectors vector vector data vectors
THE BOOTSTRAPPING METHOD:
economic economic economic
DATA SAMPLE, INNOVATIONS, variables variables variables
SIMULATION
USD equity
EUR FX rate
GBP 5 year IR
time time scenarios time
change between two of these vectors. In this example based Pound and verify that if USD-CHF goes down GBP-USD goes up
on 120 quarters and going back to about 30 years of data, the in the simulation (Figure 6) as the exchange rates are inverted.
resulting innovations are randomly picked and a new scenario We indeed see this in Figure 6 and we also see that EUR-USD
is built starting from the last observed vector. As many other goes up as expected, while the USD-JPY goes down. On the
innovations as we want can be added the same way to obtain side, you also note that the US stock index goes down deeply
various scenarios. Since innovations have been taken on the which is also related to the foreign exchange movements.
same day, at the same moment, they will present the same data
dependency, this is a simple way to build consistent scenarios. In However the aim of an ESG is not to forecast the outcome of the
Figure 5, we have schematized this procedure. future of financial returns. The ESG is not here to play the role of a
crystal bowl or to replace the specialists of macro-economics. We
Once this has been done, it is possible to choose the desired are rather trying to assess the risk of the future. The model will
parameters. The tail factor alpha will show how heavy the tail usually not produce very good economic forecasts. This is more
must be for those scenarios, and this gives scenarios for the the task of international bodies like the OECD or the IMF. We
future. In Figure 6, we show a consistent example of a simulated leave this task to more sophisticated macro-economic models.
yield curve over time. Another way to check that a scenario is Here, we are more interested in the distribution of the various
consistent is to look simultaneously at the simulated patterns of economic variables. This is the important outcome of an ESG and
the US dollar, the Swiss Franc and the British pound at one point this is what will have to be statistically tested to assess its quality.
when the US dollar drops against the Swiss Franc and the British
FIGURE 5: FIGURE 6:
EXAMPLE OF ONE SIMULATED EUR YIELD CURVE SCENARIO EXAMPLE OF ONE ECONOMIC SCENARIO, BOOTSTRAPPING,
(ZERO COUPON, RISK-FREE), DEVELOPMENT OVER TIME, SEVERAL VARIABLES. FOREIGN EXCHANGE RATES, CPI;
2007Q3 ➜ END 2008 EQUITY INDICES 2002 - 2007
EUR/USD
Interest rate level 2.0
6% USD/100JPY
1.8 GBP/USD
USD/CHF
5% 1.6
US Index
1.4 JP Index
CH Index
4%
1.2 CPI US
Curve of 2007Q3
Simulation end of 2007 CPI EU
1.0
3% Simulation 2008Q1 CPI JP
Simulation 2008Q2
Simulation 2008Q3 0,8 CPI UK
Simulation end of 2008 CPI CH
2% 0,6
1 2 3 4 5 6 7 8 9 10 11 12 13 14 15 16 17 18 19 20 1 3 5 7 9 11 13 15 17 19 21 23 EU Index
Maturity [Y] Quarter (1=2002Q2, total: 5.5 years) UK Index
SCOR GLOBAL P&C - FOCUS #20 - MARCH 2016 17MODELLING OF ECONOMIC SCENARIOS AND THEIR IMPACT ON CAPITAL MANAGEMENT
Enhancements to the method: a full yield curve model,
volatility clustering, tail correction and mean reverting effects
The ESG includes a complete yield curve model which is arbitrage- variables. Extreme shocks such as a “1 in 200 years” event are
free and uses forward interest rates as market expectation probably missing in the recorded history except maybe now,
values. It models forward interest rates as economic variables, for financial institutions, since the financial crisis of 2008/2009.
using the bootstrapping method, accounting for the asymmetry In its ESG, SCOR applies a tail correction to the innovation to
of interest rates1, in order to produce realistic, smooth forms of account for those possible shocks where η is a positive random
yield curves using the current yield curve as starting point for the variable with a mean of 1 and a Pareto-shaped upper tail (with
simulation, allowing for long-run simulations (using weak mean a realistic tail index):
reversion) and modelling yield curves of many countries, with
dependencies. corrected innovation vector = innovation vector * η
These properties make it a multi-purpose model which can be Most of the time, η will be below one, thus reducing slightly
considered as a serious alternative to other models. the innovations, while from time to time, it will be much bigger
than one shocking the whole vector. These corrections to the
The toughest challenge for any ESG is to calculate interest rates bootstrap method are needed to go beyond the data period
and yield curves as they follow a complex dynamic process. Most we use. They allow us to include other properties that are not
advanced models deal with forward interest rates for fixed dates directly present in the bootstrapping data and to control the
(as in futures markets), mapping them in a nonlinear way to dynamics of the scenarios. That is why we qualify our ESG to
avoid too negative interest rates. Holding long-term deposits is semi-parametric since these corrections use parameters like the
risky: “term premium”. This is why the standard form of yield tail index or the speed of mean reverting. Those parameters
curves is upward slanting. are calibrated via empirical studies on longer data sets, for the
Bootstrapping covers some market shocks and extreme price mean reverting, or on data measured at higher frequency than
moves, however this sticks to those contained in historical quarterly for the tail index.
data which is limited, particularly when in need of it for many
Conclusions and perspectives
In conclusion, ESGs are basic tools for building credible and A special care to the mean reversion effects allows short-term
realistic internal models. They are difficult to produce because of simulations (with exact initial conditions) as well as long-term
the large number of variables which need a good dependence simulations (where mean reversion plays an important role). The
structure between them. treatment of heavy tails and volatility clustering are included
through refinements of the method. The method is essentially
non-parametric and requires no large calibration procedures.
ESG's importance is often neglected Expert opinion (e.g. expected equity index performance) can be
by insurance companies as they are integrated and used instead of the model forecast. The model is
fully integrated in the internal model landscape and the scenarios
not part of the core knowledge of
and results reflect real-world probabilities. However, they can be
actuaries. However, they lie at the
used to compute risk-neutral scenarios and probabilities. Those
centre of the model and influence scenarios can then be used for valuation of life contracts.
both the assets as well as the liabilities.
Finally, in order to improve the flexibility of the model, the ESG
should be able to integrate forecast for the expected values of
The ESG based on bootstrapping has several advantages. It inflation and interest rates coming from expert opinions. Using
covers a wide range of economic variables, and is flexible and these opinions as input, the ESG will be able to provide the
modular when adding new variables, automatically preserving risk around these forecasts and thus allow for better strategic
dependences which exist between variables. discussions.
7
Interest rates are usally positive, thus their behavior is essentially asymmetric.
18 SCOR GLOBAL P&C - FOCUS #20 - MARCH 2016THE VALUE OF TRADE-CREDIT (RE)INSURANCE IN HIGH GROWTH/EMERGING MARKETS
THE VALUE OF TRADE-CREDIT
(RE)INSURANCE
IN HIGH GROWTH/EMERGING MARKETS
Tobias POVEL
Regional Credit & Surety Manager, Asia-Pacific, SCOR Global P&C
Tobias Povel started his career in Reinsurance as a Pricing Actuary in the area of P&C Structured Solutions, and joined
SCOR’s Credit & Surety team as an Underwriter in 2004. In 2011, he was seconded to SCOR Asia-Pacific to build up a
Credit & Surety team based in Singapore, and to develop SCOR’s presence and portfolio in Asia-Pacific for this Line of
Business. Tobias holds a PhD in Mathematics from the Swiss Federal Institute of Technology (ETH) in Zurich.
Introduction to Trade Credit Insurance (TCI)
Trade credit insurance is more than just a way to protect a seller
against financial loss; it is a real credit risk management and
claims prevention tool that a credit insurer offers to its client.
Figure 1 illustrates the way in which Trade Credit Insurance
(TCI) covers the seller against non-payment by the buyer of ”TRADE CREDIT INSURANCE
undisputed (short-term) accounts receivable, stemming from an SELLS MORE THAN JUST
underlying sales contract of goods or services between the two INDEMNIFICATION. IT ALSO ACTS
parties.
AS A LOSS PREVENTION SERVICE,
FIGURE 1: HELPING TO BUILD UP PROFITABLE
THE TRADE CREDIT INSURANCE (TCI) SCHEME-ENABLING
(INTERNATIONAL) COMMERCE (CROSS BORDER) TRADE
RELATIONSHIPS.”
Selling goods
on credit
SELLER BUYERS
Payment
for goods
Premium TCI increases sales to new markets, facilitates (global) trade
and, most importantly, alleviates the seller’s financing needs,
improving financing by insuring a significant portion of their
trade receivables on the asset side of the balance sheet.
CREDIT
INSURER
The list of covered non-payment risks can include insolvency,
Credit Rights of
insurance subrogation protracted default or even political risk for international trade.
SCOR GLOBAL P&C - FOCUS #20 - MARCH 2016 19THE VALUE OF TRADE-CREDIT (RE)INSURANCE IN HIGH GROWTH/EMERGING MARKETS
The underlying credit periods mostly go from short to medium The estimated global TCI short-term market in 2015 is around
terms and the generic underlying types of policy include: EUR 10 bn, 55% of which is shared by only three private
players. Some alternatives to TCI are especially used in emerging
› W
hole Turnover countries. They include factoring, payment guarantees,
› S ingle Buyer/Contract letters of credit, self-insurance and of course, the “cash and
carry” approach. Trade Credit Insurance sells more than just
› P re-Shipment Coverage
indemnification. It also acts as a loss prevention service, helping
› B
uyer Credit Policy, insuring the Bank which is financing the to build up profitable (cross border) trade relationships.
underlying transaction
› L etter of Credit Policies, underlying trade secured by Letters
of Credit
› E tc.
Trade Credit Insurance versus Merchandise Trade
The conventional way of measuring the penetration of TCI Looking at the evolution of the regional contribution to GMT,
is to relate it to Gross Domestic Product (GDP). However, in Figure 3 clearly shows that, while the Americas still remain the
the equation of GDP it can be quite difficult to untangle the largest contributors to the regional share of GDP, the regional
components potentially subject to TCI. distribution of GMT has switched over the past ten years. Asia-
Pacific has become the major regional contributor to GMT,
An alternative approach would be to measure the TCI penetration having experienced phenomenal growth at a CAGR of 12.2% in
versus a country’s Merchandise Trade, which is defined as the nominal merchandise trade. Similarly, the Europe, Middle East &
sum of its merchandise exports and imports. This approach also Africa (EMEA) region, excluding the European Union, recorded a
has obvious shortcomings. Firstly, merchandise trade does not CAGR of 13.4% in nominal terms, while Latin America’s nominal
capture services. As the latter only represents a small share of CAGR stood at 11.8%.
the global exposure insured by credit insurance (possibly in the
range of 5-10%), the effect is considered to be second order.
FIGURE 3:
Secondly, using merchandise trade could overestimate the REGIONAL SHARE OF GLOBAL MERCHANDISE TRADE
penetration rate if the domestic merchandise trade is much Regional Share of Global Merchandise Trade
larger than the merchandise imports of a given country. In any 45.0%
case, as can be seen from Figure 2, Global Merchandise Trade 40.0%
(GMT) and GDP are highly correlated.
35.0%
30.0%
FIGURE 2:
25.0%
GLOBAL MERCHANDISE TRADE VERSUS GLOBAL GDP GROWTH
20.0%
Global Merchandise Trade versus GDP Growth 15.0%
1.50 10.0%
1.00 5.0%
0.50
2003 2004 2005 2006 2007 2008 2009 2010 2011 2012 2013
2004 2005 2006 2007 2008 2009 2010 2011 2012 2013
(0.50) Americas EU Asia-Pacific EMEA (excl. EU)
(1.00)
Source: The World Bank
(1.50)
(2.00) On a nominal basis over that period of time, Global TCI has
(2.50) been growing at a CAGR of roughly 6.7%, to around USD 10
(3.00) billion. When comparing the above regional merchandise trade
growth rates to their TCI counterparts, it should be noted that
GDP (at current USD) YoY Growth - Normalised series
Global Merchandise Trade (at current USD) YoY Growth - Normalised series
the highest increase in terms of regional weight comes from
Asia-Pacific, which in 2013 held a 22% share of global short-
Source: The World Bank term TCI Premium, compared to 7.1% in 2003.
20 SCOR GLOBAL P&C - FOCUS #20 - MARCH 2016THE VALUE OF TRADE-CREDIT (RE)INSURANCE IN HIGH GROWTH/EMERGING MARKETS
The regional TCI Premium Weight has grown in the Americas Clearly, penetration in that part of the world has significantly
region too, mainly thanks to Latin America (with 14.1% in 2013 increased, showing that TCI has helped to facilitate global and
versus 11% in 2003), albeit at a significantly slower rate. While domestic trade.However, Figure 5 highlights that there is still a
the Europe, Middle East & Africa market continues to be by discrepancy in the contribution of GMT, with Asia contributing
far the most important contributor to the global TCI market, one third, versus 22% in TCI, clearly proving that TCI is still
its regional weight has been shrinking quite significantly (minus underrepresented in Asia-Pacific.
18.1 pts between 2003 and 2013) to a regional weight of
63.9%.
FIGURE 5:
CONTRIBUTION TO GMT VERSUS TCI
It is interesting then to compare the compound annual growth
rates of GMT and TCI between 2003 and 2013 (Figure 4), which
show that Asia-Pacific’s regional TCI weight grew almost five 2013 Share of GMT 2013 Share of TCI
times faster than its respective GMT weight over the period from
2003-2013 (CAGR of 12.0% versus 2.6%).
EMEA Americas Asia-Pacific
70% 63.9%
FIGURE 4: 60%
COMPARISON OF CAGR FOR GMT VERSUS TCI REGIONAL 50% 47.6%
WEIGHTS
40% 33.1%
30%
19.4% 22.0%
20% 14.1%
CAGR in GMT (2003-2013) CAGR in TCI (2003-2013)
10%
EMEA Americas Asia-Pacific
14%
12.0% Source: SR Economic Research & Consulting, October 2014;
12%
10% SCOR Estimate
8%
6%
4% 2.6%
2.6%
2%
-
-2% -1.0% -1.3%
-4% -2.5%
Source: SR Economic Research & Consulting, October 2014;
SCOR Estimate
Property & Casualty penetration
This prevailing underrepresentation of TCI in Asia-Pacific and an earlier stage of P&C market development). According to this
the Americas can be analysed in more detail. An initial way to perception, the credit insurance market will develop naturally at
look at this is to compare it to P&C Insurance penetration rates. a later stage in emerging/not yet fully mature markets.
Indeed, there is the perception that there should be a natural It turns out, however, that this perception is not completely
evolution of Property & Casualty (P&C) products in emerging or accurate for the Chinese and Indian markets. Figure 6 illustrates
not yet fully mature (Asia-Pacific) markets. this well, by comparing P&C country penetration rates over a
mature market benchmark rate with its respective counterpart
This is supported by a comparison of the prevailing mix of P&C for TCI.
Products in mature markets (for instance the United States)
with emerging/not yet fully mature markets (for instance the Figure 6 uses the “Advanced Europe, Middle East & Africa
Chinese P&C market), which suggests a natural evolution of (EMEA)” P&C penetration rate as a benchmark (4.2% of GDP in
P&C insurance products depending on the immediate pressing 2013) and, for TCI, uses the penetration rate of 0.052% of the
needs (e.g. motor insurance prevails over liability insurance at merchandise trade for that same region as a benchmark.
SCOR GLOBAL P&C - FOCUS #20 - MARCH 2016 21THE VALUE OF TRADE-CREDIT (RE)INSURANCE IN HIGH GROWTH/EMERGING MARKETS
FIGURE 6: Looking now at mature markets and comparing the penetration
P&C AND TCI PENETRATION RELATIVE TO ADVANCED EMEA of TCI (for TCI generated – not consolidated – in the respective
REGION BENCHMARK
countries) over the Advanced EMEA benchmark rate of 0.052%,
versus Domestic Credit to the Private Sector over the Advanced
2013 P&C Penetration 2013 TCI Penetration EMEA benchmark rate of 129% (Figure 7), seems to indicate
versus Benchmark versus Benchmark that the higher the availability of funding, the lower the TCI
1.20 penetration.
1.00
0.80
0.60 FIGURE 7:
DOMESTIC CREDIT (I.E. LIQUIDITY AND FUNDING) TO PRIVATE
0.40 SECTOR VS TCI PENETRATION BENCHMARKS
0.20 (MATURE MARKETS)
North Latin Korea, 2013 Domestic Credit to 2013 TCI Penetration
America America Australia China India Indonesia Japan Rep. SingaporeThailand
Private Sector vs. Benchmark vs. Benchmark
1.60
Source: Insurance Fact Book 2015
1.40
1.20
1.00
Comparing those ratios for P&C and TCI per country or region
0.80
suggests that TCI in China and India is (significantly) ahead of
P&C penetration. The situation is clearly different for Southeast 0.60
Asian countries, for which the P&C product “evolution theory” 0.40
seems to be applicable. It turns out that export credit insurance 0.20
in China and India has been the main driver of the phenomenal
United Australia Japan Korea, Austria United
penetration. States Rep. France Germany Italy Netherlands Kingdom
The above comparison gives rise to various other questions. Source: Insurance Fact Book 2015
Why is TCI underrepresented compared to P&C in some mature
markets such as North America: is it related to the overall
availability and level of funding/liquidity in the market? Or, for A linear regression analysis (x-axis: availability of funding/liquidity
emerging markets, how is the evolution of TCI related to the relative to advanced EMEA benchmark; y-axis: TCI penetration
dissemination of the banking industry, and to the significance relative to the advanced EMEA benchmark; see Figure 8 below)
of the private sector? Finally, what are the prevailing alternatives indicates a negative correlation of -0.8 (we should point out that
to TCI in emerging markets, and will TCI eventually be able to this value is independent of the respective choices of benchmark
replace them? values).
To address these questions, it is first necessary to look at the This seems to suggest that, in mature TCI markets, the easier it
availability and significance of “Domestic Credit to the Private is for a company to find alternative financing sources the lower
Sector” (see e.g. The World Bank for data series). According to the TCI penetration tends to be.
the World Bank, Domestic Credit to the Private Sector in terms
of GDP for North America is at a significant level, standing at
Even though the above does not pretend to be a fully-fledged
around 200% in 2013, followed by Asia-Pacific and Advanced
model (e.g. one should be analysing a time series), applying the
EMEA (138% and 130% respectively), which is roughly at the
regression analysis to Asia-Pacific indicates that TCI is about
same level, and Latin America, significantly lagging behind at a
“half way” to its (theoretical) potential for that region, as shown
level of 50%.
in Figure 9.
“Domestic Credit to the Private Sector” refers to “financial
resources provided to the private sector by financial corporations On the other hand, and coming back to emerging markets,
such as through loans, the purchase of non-equity securities and Figure 9 also seems to indicate that it is necessary to have a
accounts receivable”. This serves as an indicator of the availability critical level/depth to both the financial and the private markets
of financial resources and the significance of the private sector. in the first place, in order to “kick-start” TCI.
22 SCOR GLOBAL P&C - FOCUS #20 - MARCH 2016You can also read