2020-2024 Analysis of Impediments to Fair Housing Choice Study - City of Phoenix, Arizona JUNE 1, 2020
←
→
Page content transcription
If your browser does not render page correctly, please read the page content below
2020-2024
Analysis of Impediments to
 Fair Housing Choice Study
 City of Phoenix, Arizona
 JUNE 1, 2020

 Prepared for the City of Phoenix
 By
 LeSar Development Consultants
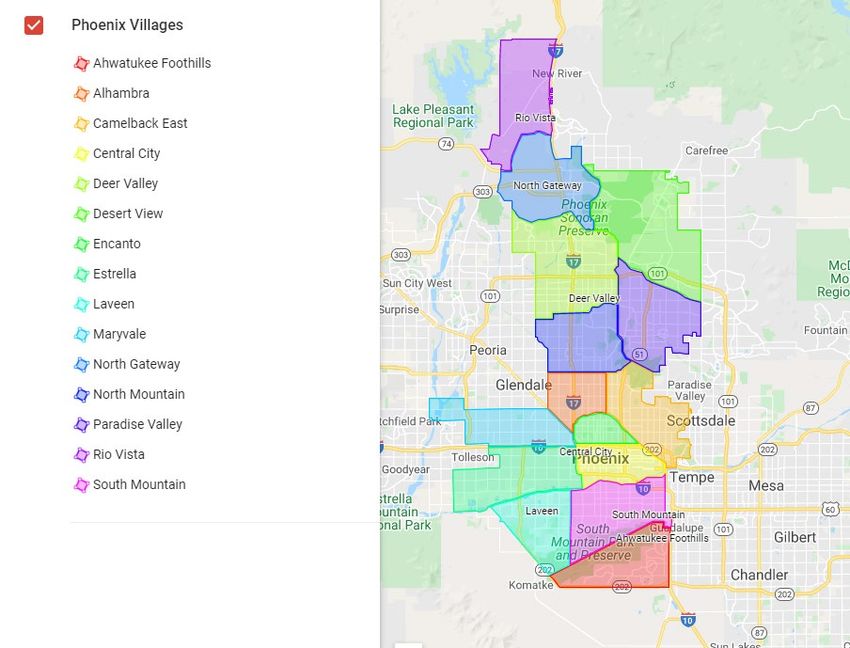
Table of Contents
Executive Summary....................................................................................................................................... 6
 Purpose of Analysis of Impediments ........................................................................................................ 6
 Organization of Report ............................................................................................................................. 6
Methodology and Definitions ....................................................................................................................... 8
Background ................................................................................................................................................. 10
 History of Phoenix ................................................................................................................................... 10
 Fair Housing Framework ......................................................................................................................... 11
 Federal Law ......................................................................................................................................... 11
 State and Local Law................................................................................................................................. 13
 Limitations of this Analysis...................................................................................................................... 13
 Community Meetings.............................................................................................................................. 14
 Community Needs Survey ....................................................................................................................... 15
 Focus Groups........................................................................................................................................... 15
 Consultations .......................................................................................................................................... 15
 Public review ........................................................................................................................................... 16
 Public Hearing ......................................................................................................................................... 16
 Key Issues Identified ............................................................................................................................... 16
Community Profile ...................................................................................................................................... 18
 Demographic Overview .......................................................................................................................... 18
 Population Growth .............................................................................................................................. 19
 Age Composition ................................................................................................................................. 20
 Race/Ethnicity ..................................................................................................................................... 21
 National Origin .................................................................................................................................... 22
 Large households ................................................................................................................................ 23
 Single-parent households ................................................................................................................... 24
 Persons with disabilities...................................................................................................................... 24
 Persons with HIV/AIDS ........................................................................................................................ 25
 Persons experiencing homelessness................................................................................................... 26
 Housing Overview ................................................................................................................................... 26
 Housing stock ...................................................................................................................................... 27
 Home values........................................................................................................................................ 27

 1
Housing conditions.............................................................................................................................. 28
 Household Overview ............................................................................................................................... 29
 Housing tenure.................................................................................................................................... 29
 Household composition and size ........................................................................................................ 29
 Household income .............................................................................................................................. 30
 Housing cost burden ........................................................................................................................... 33
Segregation Analysis ................................................................................................................................... 34
 Dissimilarity Index ................................................................................................................................... 35
 Exposure Index ........................................................................................................................................ 37
 Isolation Index ......................................................................................................................................... 39
 Entropy Index .......................................................................................................................................... 40
 Lending Practices ................................................................................................................................ 42
 Background ............................................................................................................................................. 42
 Conventional and Government-Backed Financing ................................................................................. 44
 Lending Patterns ..................................................................................................................................... 44
Public Policies.............................................................................................................................................. 59
 Zoning Ordinance .................................................................................................................................... 59
 Variety of Housing Opportunity .............................................................................................................. 65
 Affordable Housing Development .......................................................................................................... 68
 Public Transit........................................................................................................................................... 72
Fair Housing Profile ..................................................................................................................................... 74
 Fair Housing Services .............................................................................................................................. 74
 Fair Housing Statistics and Enforcement ................................................................................................ 75
 Hate Crimes............................................................................................................................................. 82
Fair Housing Action Plan ............................................................................................................................. 83
 Assessment of Past Goals and Actions.................................................................................................... 83
Impediments ............................................................................................................................................... 85
 2020-2025 Goals and Actions ................................................................................................................. 88
 Conclusion ............................................................................................................................................... 90

 2
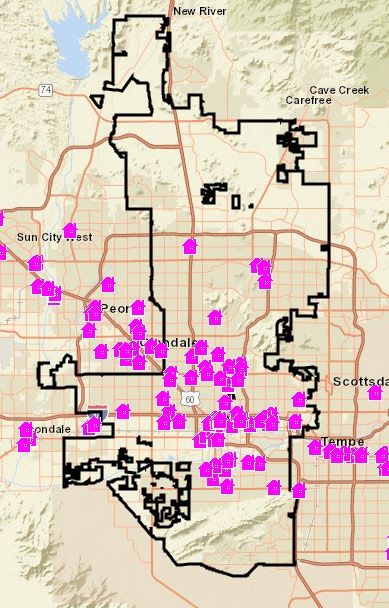
TABLE OF TABLES

Table 1-Historical Population by Decade .................................................................................................... 19
Table 2- Recent Population Trend .............................................................................................................. 19
Table 3- Age Distribution ............................................................................................................................ 20
Table 4- Population by Race/Ethnicity ........................................................................................................ 21
Table 5- National Origin .............................................................................................................................. 23
Table 6- Large Family Households .............................................................................................................. 24
Table 7- Single-Parent Households (HHs) ................................................................................................... 24
Table 8- Disability Status ............................................................................................................................. 25
Table 9- 2019 Point-in-Time Count ............................................................................................................. 26
Table 10- Housing Stock Composition ........................................................................................................ 27
Table 11- Owner-occupied Home Values ................................................................................................... 28
Table 12- Age of Housing Stock .................................................................................................................. 28
Table 13- Housing Tenure ........................................................................................................................... 29
Table 14- Housing Tenure ........................................................................................................................... 30
Table 15- Composition of Households by Income ...................................................................................... 30
Table 16-2019 Phoenix MSA Income Limits................................................................................................ 31
Table 17-Households by Income Level ....................................................................................................... 32
Table 18- Housing Cost Burden > 30 percent ............................................................................................. 33
Table 19- Housing Cost Burden > 50 percent ............................................................................................. 34
Table 20- Dissimilarity Index for City of Phoenix ........................................................................................ 36
Table 21- Exposure Index in the City of Phoenix ........................................................................................ 37
Table 22- Isolation Index in the City of Phoenix ......................................................................................... 40
Table 23- All Loan Applications by Race Ethnicity ...................................................................................... 45
Table 24- All Loan Applications by Income Level ........................................................................................ 46
Table 25- Disposition of All Home Loans Compared to Population by Race/Ethnicity............................... 46
Table 26- Disposition of All Home Loans Compared to Income Level ........................................................ 47
Table 27- Home Purchase Loans ................................................................................................................. 47
Table 28- Home Purchase Loans by Type ................................................................................................... 48
Table 29- Home Purchase Loans Denial Rates ............................................................................................ 48
Table 30- Home Purchase Loans by Income Level ...................................................................................... 48
Table 31- Home Purchase Loans by Type ................................................................................................... 49
Table 32- Home Purchase Loans Denial Rates by Income Level ................................................................. 49
Table 33- Home Improvement Loans by Race/Ethnicity ............................................................................ 50
Table 34- Home Improvement Loan Denial Rates ...................................................................................... 50
Table 35- Home Improvement Loans by Income Level .............................................................................. 50
Table 36- Home Improvement Loans Denial Rates by Income Level ......................................................... 51
Table 37- Refinancing Loans by Race/Ethnicity .......................................................................................... 51
Table 38-Refinancing Loan Denial Rates ..................................................................................................... 52
Table 39- Refinancing Loans by Income Level ............................................................................................ 52
Table 40- Refinancing Loans Denial Rates by Income LevelRefinancing Loans Denial Rates by Income
Level ............................................................................................................................................................ 52
 3
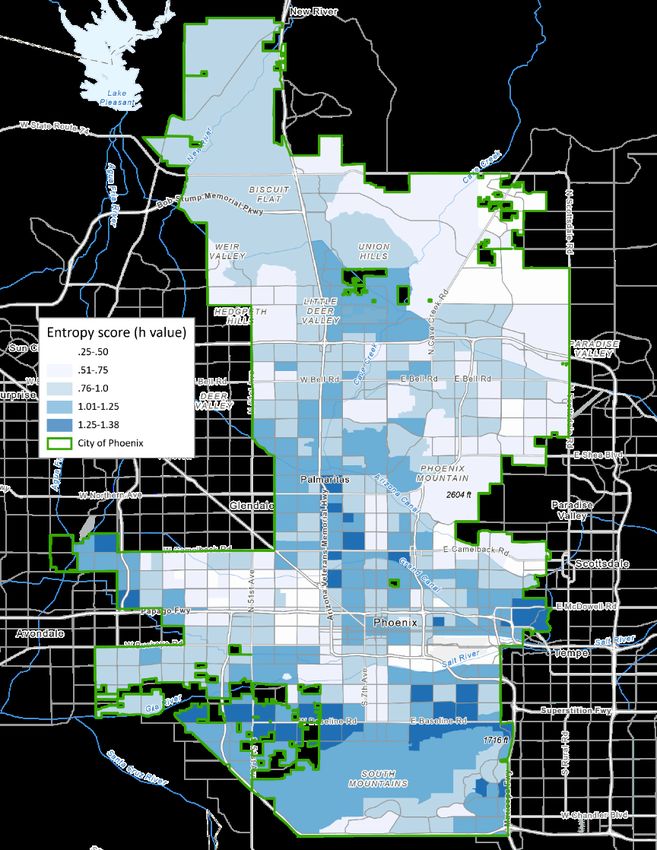
Table 41- Lending by Census Tract by Minority Population ....................................................................... 53
Table 42- Lending by Census Tract Income................................................................................................. 53
Table 43- Spread on Loans with First Lien Status by Race/Ethnicity .......................................................... 57
Table 44- Housing Stock Composition ........................................................................................................ 65
Table 45- Housing Inventory Count, 2018 .................................................................................................. 68
Table 46- TOD Stakeholders........................................................................................................................ 73
Table 47- Fair Housing Complaints by Protected Class ............................................................................... 79
Table 48- Fair Housing Complaints by Issue ............................................................................................... 79
Table 49- Fair Housing Cases by Result ....................................................................................................... 79
Table 50- Fair Housing Cases by Basis of Claim .......................................................................................... 80
Table 51- Fair Housing Outreach, Calendar Years 2014-2019 .................................................................... 80
Table 52- Fair Housing Intakes, Calendar Years 2014-2019........................................................................ 80
Table 53- Fair Housing Advertising, Calendar Years 2014-2019 ................................................................. 82
Table 54- City of Phoenix Hate Crime Statistics by Bias Motivation, 2015-2018........................................ 82

 4
TABLE OF FIGURES
Figure 1 Phoenix Villages ............................................................................................................................ 18
Figure 2 Concentration of White Population by Census Tract.................................................................... 22
Figure 3 -Low-Mod Block Groups................................................................................................................ 32
Figure 4- Dissimilarity Index for City of Phoenix ......................................................................................... 36
Figure 5- Exposure Index in the City of Phoenix ......................................................................................... 38
Figure 6-Isolation Index in the City of Phoenix ........................................................................................... 40
Figure 7- Diversity Index by Census Tract in the City of Phoenix, 2018 ...................................................... 41
Figure 8- Phoenix HOLC Redlining Map, 1930’s .......................................................................................... 43
Figure 9- Concentration of Extremely Low-Income Households by Census Tract ...................................... 54
Figure 10- Concentration of Low-Income Households by Census Tract ..................................................... 55
Figure 11- Concentration of Moderate-Income Households by Census Tracts ........................................ 56
Figure 12- LIHTC Properties ........................................................................................................................ 70

 5
Executive Summary
The City of Phoenix (City) boasts a population of over 1.6 million people, making it the fifth largest city in
the United States. As the county seat of Maricopa County and the capital of Arizona, Phoenix has
experienced near continuous growth since its incorporation in 1881, spurred on by its diverse economy,
warm climate, and relatively low cost of living. To further nurture economic growth and increased
access to opportunity, the City presents this Analysis of Impediments to Fair Housing Choice (AI).

Purpose of Analysis of Impediments
Fair housing is the right to choose housing free from unlawful discrimination. This right has been
codified in federal law since 1968 through the Fair Housing Act and has been incrementally
strengthened and expanded since then. The Americans with Disabilities Act of 1990 further cemented
the right of fair housing for all Americans.

Central to providing and protecting fair housing choice is the concept of affirmatively furthering fair
housing. This means undertaking a three-pronged Fair Housing Planning (FHP) process. The AI is one
component of the FHP required by the U.S. Department of Housing and Urban Development (HUD) as
part of a jurisdiction’s five-year Consolidated Plan. The other components are taking actions to eliminate
identified impediments to fair housing choice and the maintenance of fair housing records.

This AI presents a demographic profile of Phoenix, assesses the extent of housing needs among specific
income groups, and evaluates the range of available housing choices for residents. The AI also analyzes
the conditions in the private market and public sector that may limit the range of housing choices or
impede a person’s access to housing. More importantly, this AI identifies impediments that may prevent
equal housing access and develops solutions to mitigate or remove such impediments.

Organization of Report
This report is divided into seven sections:

 • Methodology and Definitions – outlines the data sources and key concepts of the AI.
 • Background – provides a brief history of Phoenix, defines fair housing, and explains the purpose
 and context of this report.
 • Community Outreach – summarizes the community engagement process the City undertook to
 solicit feedback on fair housing issues in Phoenix.
 • Community Profile - presents the demographic, housing and income characteristics in Phoenix.
 The relationships among these variables are discussed.
 • Lending Practices – analyzes private lending activities that could impede fair housing choices in
 Phoenix.
 • Public Policies – evaluates various public policies and actions that could impede fair housing
 choice in Phoenix.
 • Fair Housing Profile – evaluates the fair housing services available to residents and identifies fair
 housing complaints and violations in Phoenix.
 • Impediments and Recommendations – summarizes the findings regarding fair housing issues in
 Phoenix and provides recommendations for furthering fair housing practices.

 6
A page is attached at the end of this report that includes the endorsement of the City Manager and a
statement certifying that the AI represents Phoenix’s official conclusions regarding impediments to fair
housing choice and the actions necessary to address these impediments.

 7
Methodology and Definitions
This report was prepared by LeSar Development Consultants (LDC) on behalf of the City of Phoenix. The
City’s Neighborhood Services Department is responsible for Phoenix’s Fair Housing Planning, to include
this AI.

The following include, but are not limited to, data sources and resources that were used to complete
this AI:

 • American Community Survey (ACS), U.S. Census Bureau
 • City of Phoenix 2015-2020 Consolidated Plan
 • City of Phoenix Draft 2020-2025 Consolidated Plan
 • Decennial Census, U.S. Census Bureau
 • Fair Housing Planning Guide, U.S. Department of Housing and Urban Development
 • FBI Hate Crime statistics
 • Home Mortgage Disclosure Act (HMDA) data on lending activities
 • PEOD data
 • PlanPHX General Plan (2015)
 • U.S. Department of Housing and Urban Development, Comprehensive Housing Affordability
 Strategy (CHAS)

The following concepts are found throughout this document and are the basis on which the AI is
developed:

Affirmatively Further Fair Housing – In keeping with the latest proposed guidance from HUD, to
Affirmatively Further Fair Housing Choice (AFFH) is to comply with “the 1968 Fair Housing Act’s
obligation for state and local governments to improve and achieve more meaningful outcomes from fair
housing policies, so that every American has the right to fair housing, regardless of their race, color,
national origin, religion, sex, disability or familial status.” 1

Affordable Housing – Housing for which the occupant spends no more than 30 percent of their gross
income on costs. For rental housing, the 30 percent amount is inclusive of any tenant-paid utility costs.
For homeowners, the 30 percent includes mortgage costs, property taxes, homeowner’s insurance, and
any homeowners’ association fees.

Fair Housing –A condition in which individuals of similar income levels in the same housing market have
a like range of choice available to them regardless of race, color, ancestry, national origin, religion, sex,
disability, age, marital status, familial status, sexual orientation, source of income, or any other category
which may be defined by law now or in the future. For the purposes of this AI, federally protected
classes are examined, which may differ from local standards.

1U.S. Department of Housing and Urban Development. “HUD Publishes New Proposed Rule on Affirmatively Furthering Fair Housing Choice.”
Press Release No. 13-110. July 19, 2013.

 8
Impediments to Fair Housing Choice - As adapted from the Fair Housing Planning Guide, impediments
to fair housing choice are understood to include: 2

 • Any actions, omissions, or decisions taken because of race, color, religion, sex, disability, familial
 status, or national origin which restrict housing choices or the availability of housing choices.
 • Any actions, omissions, or decisions which have the effect of restricting housing choices or the
 availability of housing choices on the basis of race, color, religion, sex, disability, familial status,
 or national origin.

Protected Classes - Title VIII of the Civil Rights Act of 1968 prohibits housing discrimination based on
race, color, national origin or ancestry, sex, or religion. The1988 Fair Housing Amendments Act added
familial status and mental and physical disability as protected classes. State and local laws may add
additional protected classes, such as sexual orientation, gender identity, and source of income;
however, for the purposes of this AI, information is primarily provided on federal protected classes.

2
 U.S. Department of Housing and Urban Development Office of Fair Housing and Equal Opportunity. Fair Housing Planning Guide: Volume 1
(Chapter 2: Preparing for Fair Housing Planning, Page 2-17). March 1996.
 9
Background
History of Phoenix
As one of the largest cities in the United States, Phoenix (City) has experienced near continuous
population and economic growth since its modern founding in 1867 by John W. (Jack) Swilling. In just
the last 20 years, the City’s population has increased 25.7 percent and its gross domestic product – the
total value of goods produced and services provided – has almost doubled during that time. 3

Prior to the inhabitance of the Swilling and others, various populations, both modern and prehistoric,
lived in and contributed to the development of Phoenix. These groups adapted to the environment,
modifying the land and soil as necessary to survive. Most notably, the Hohokam people, who inhabited
Phoenix and surrounding areas for over 1,500 years, developed an irrigation system still used today.
Early pioneers expanded on the Hohokam’s irrigation system, which led to an adequate water supply for
longer crop seasons. As with the rest of Arizona, copper, cattle, cotton, citrus, and the climate have
played a major role in the growth of Phoenix. These five commodities were the economic and social
foundations of the territory and early statehood of Arizona.

With a brief decline following the Great Depression in 1930’s, Phoenix’s economy regained footing by
the 1940s due to the United States’ involvement in World War II. The Arizona deserts attracted many air
bases, testing stations, and training camps. Nearby soldiers on active duty visited Phoenix for recreation,
frequenting local businesses. Following this postwar growth, many of those stationed near Phoenix
remained and relocated with their families to nearby suburban areas which led to an economic boom in
the 1940s that has remained relatively steady over the years.

The City of Phoenix has maintained a Council-Manager government since 1913. This varies from the
previous Mayor-Council structure in that significant administrative authority is vested in the City
Manager. The City Manager is responsible for overseeing the delivery of public services and the
management of City departments while the council acts as a legislative body serving on behalf of the
community. Both the Mayor and City Council members are elected into office and serve four-year terms,
whereas the City Manager is appointed by the Mayor and City Council. In 1993, Phoenix captured the
international Bertelsmann Award for being one of the best managed cities in the world and was
regarded as “employee-centered and responsive to the public’s needs.” Today, the City continues to
maintain its organized approach to government and strong political leadership.

While economic growth has brought prosperity to the region, social and economic challenges persist.
Relevant to this report, barriers to fair housing choice continue to frustrate residents’ ability to secure
accessible and affordable housing.

Equal access to housing is fundamental to meeting essential needs and pursuing personal, educational,
and employment goals. In recognizing equal housing access as a fundamental right, the federal
government established fair housing choice, defined as the right to choose housing free from unlawful
discrimination, as a right protected by law. 4 Through many of its policies, programs, and services, the
City of Phoenix works diligently to ensure fair housing choice for its residents.

3
 https://fred.stlouisfed.org/series/NGMP38060
4 http://www.fhcwm.org/whatisfairhousing
 10
Conducting an Analysis of Impediments to Fair Housing Choice (AI) became a requirement for
entitlement jurisdictions in 1995. Entitlement jurisdictions are those that receive U.S. Department of
Housing and Urban Development (HUD) funding under the Community Development Block Grants
(CDBG), HOME Investment Partnership (HOME), Emergency Solutions Grants (ESG), and Housing
Opportunities for Persons with AIDS (HOPWA) programs. Phoenix receives funding under each program
and as such is required to conduct an AI.

Included in the report is a demographic profile of the City, an assessment of the extent of housing needs
among specific income groups, and an evaluation of the availability of a range of housing choices for
residents. It also analyzes the conditions in the private market and the public sector that could limit the
range of housing choices or impede a person’s access to housing.

Fair Housing Framework
Federal Law
The Fair Housing Act of 1968 is the foundation of the United States’ commitment to fair housing. Along
with the Civil Rights Act of 1964, it is one of the landmark federal laws that protects all Americans from
discrimination based on race, color, religion, sex, and national origin. The Fair Housing Amendments Act
of 1988 expanded the scope of civil rights by banning discrimination based on familial or disability
status.

The statuses that fall within the scope of fair housing – race, color, religion, sex, national origin, familial
composition, and disability status – are referred to as “protected classes.” Not all seemingly unfair
treatment, whether in housing or in other areas, is prohibited. For example, young families can be
lawfully rejected for tenancy if a rental property qualifies as senior housing. 5 But protected classes
receive special consideration under the law and with few exceptions, such as when families are
disqualified from senior housing, discriminating against someone based on any of the protected classes
is prohibited.

The areas to which the Fair Housing Act (as amended) are applicable are as follows:

 • Selling or renting housing. Refusing to rent or sell a home based on a protected class is perhaps
 the clearest example of housing discrimination, but there are many other actions that are
 expressly prohibited. These include offering different rental terms as compared to other
 tenants, falsely claiming there are no housing units available, or providing a person with
 different housing services or facilities.
 • Mortgage lending. Refusing to make a mortgage loan, imposing different loan terms, and
 unfairly appraising a home, among other actions related to mortgage lending, are all illegal
 under federal fair housing law.
 • Forms of harassment. Many laws and policies make different forms of harassment illegal across
 sectors, but the Fair Housing Acts expressly prohibit harassment, especially sexual harassment,
 as it relates to housing.

5 Ron Leshnower, “The Fair Housing Act’s Protected Classes: What Landlords Need to Know,” Nolo.com.
 11
• Advertising. Advertisements for and marketing of housing must be compliant with the Fair
 Housing Acts’ prohibition on discrimination. For example, phrases such as “no children” or “no
 wheelchairs” may be in violation of the federal Fair Housing Acts.
 • Interference of rights and protections under fair housing legislation. According to HUD, it is
 illegal to “threaten, coerce, intimidate or interfere with anyone exercising a fair housing right or
 assisting others who exercise the right.” It is also illegal to retaliate against a person who has
 filed a fair housing complaint or assisted in a fair housing investigation. 6

What is not included in fair housing protections at the federal level is a prohibition of discrimination
based on source of income. This usually refers to the treatment of those who are recipients of Housing
Choice Vouchers (commonly referred to as Section 8). For example, it is not uncommon for landlords to
advertise a rental unit as “no Section 8.” To address this, many states and cities have passed laws that
make discriminating against source of income unlawful. Where applicable, landlords are barred from
marketing their properties as “no Section 8” and cannot reject prospective tenants based on their
source of income alone. Some jurisdictions, including Phoenix, report that tenants are sometimes
denied housing based on a past criminal record or other negative history; however, this type of
discrimination is not addressed in federal fair housing laws.

Central to the Fair Housing Acts is the concept of affirmatively furthering fair housing (AFFH). It is
defined in part as “taking meaningful actions to overcome historic patterns of segregation, promote fair
housing choice, and foster inclusive communities that are free from discrimination.” 7 In other words, it
is not enough to simply declare housing discrimination illegal. Instead, HUD program participants,
including the City of Phoenix, must actively address and mitigate barriers to fair housing choice.

The major step toward remedying past injustices is ending various discriminatory lending practices
based on race, color, religion, sex, or national origin (discussed in greater detail in Lending Practices
section). The amendments to the Fair Housing Act enacted in 1988 added familial status and disabilities
as protected classes and the passage of the Community Reinvestment Act (CRA) in 1977 further
improved access to credit for all members of the community. The CRA is intended to encourage
regulated financial institutions to help meet the credit needs of LMI communities. The CRA also
authorizes federal regulators to assess depository institution’s record in helping meet the credit needs
of LMI communities.

The Home Mortgage Disclosure Act (HMDA), which was initially enacted in 1975 and substantially
expanded in 1989, requires lending institutions to make annual public disclosures of their home
mortgage lending activity. The law aims to curb discrimination by compelling banks, savings and loan
associations, and other lending institutions to report annually the amounts and geographical distribution
of their mortgage applications, origination, and denials. Lending institutions must also report the race,
gender, and annual income of its applicants.

Such data is collected and disclosed by the Federal Financial Institutions Examination Council (FFIEC). It
also makes HMDA data available to the public and financial regulators to determine if lending practices
are lawful and are serving the housing needs of all communities. It should be noted that HMDA data can

6
 https://www.hud.gov/program_offices/fair_housing_equal_opp/fair_housing_act_overview
7 https://www.hudexchange.info/programs/affh/
 12
indicate potential problems, but such data alone cannot definitively conclude that discriminatory
lending practices occurred.

Fair Housing Planning and Impediments to Fair Housing Choice

The federal government defines impediments to fair housing choice as:

 • Any actions, omissions, or decisions taken because of race, color, religion, sex, disability, familial
 status, or national origin that restrict housing choices or the availability of housing choice.
 • Any actions, omissions, or decisions that have this effect.

The AI identifies these impediments and serves as one of the three principles of Fair Housing Planning
(FHP) that the federal government requires. Another principle includes actions to overcome the effects
of identified impediments. This relates to AFFH previously discussed. The last principle of FHP is
maintaining records to support the AFFH certification, of which this AI and documentation of actions to
AFFH is a part.

State and Local Law
Federal fair housing law applies to all states. Arizona has also codified its own fair housing law in the
Arizona Civil Rights Act, which is substantially equivalent to the federal Fair Housing Act. The Arizona
Civil Rights Act is enforced by the Civil Rights Division of the Arizona Attorney General’s Office, and it
includes the same protected classes as the federal Fair Housing Act. The Phoenix City Code also includes
fair housing protections in Chapter 18, Article III, for persons who live in Phoenix, and it is enforced by
the City of Phoenix Equal Opportunity Department. The Phoenix City Code is also substantially
equivalent to the federal Fair Housing Act, but it additionally prohibits discrimination based on sexual
orientation, gender identity, and gender expression.

Limitations of this Analysis
HUD’s primary guidance for developing AIs is found in the Fair Housing Planning Guide, published in
1996. Since that time, HUD’s approach to fair housing has evolved, but formal guidance has largely yet
to reflect contemporary legal, political, and technological developments. In 2015, HUD implemented a
new a rule titled “Affirmatively Furthering Fair Housing” that outlined significant changes to the
development of AIs. The new rule would have required jurisdictions to more finely analyze housing
discrimination and segregation and allowed the federal government to better enforce the Fair Housing
Acts. However, the AFFH rule was waived indefinitely in 2018. Because the AFFH was not fully
implemented, the methodology and components of this AI, to the greatest extent possible, meet the AI
requirements found in HUD’s Fair Housing Planning Guide.

Additionally, the impediments to fair housing choice identified in this report should not be interpreted
as an indication of unlawful discrimination. Though licensed attorneys with land use and fair housing
experience have helped developed this document, no portion of this AI shall constitute or be relied upon
as legal advice or as a legal opinion.

Finally, while actions to address impediments to fair housing choice are outlined in this report,
additional research, ongoing analysis, and legislative action that are extraneous to the AI may be
required. Community Outreach

 13
This AI was developed to provide an overview of laws, regulations, conditions or other possible
obstacles that could affect access to housing. As part of this effort, the report incorporates the issues
and concerns of residents, housing professionals and service providers. To assure that the report
responds to community needs, the development of the AI included:

 • Five community workshops;
 • A focus group with various City staff;
 • Five consultations with key stakeholders, including a representative of the City’s Equal
 Opportunity Department;
 • Presentation at City Council Land Use and Livability Subcommittee informing the
 Councilmembers of the start of the Consolidated Plan process;
 • Online community needs survey;
 • 30-day public comment period; and,
 • Public hearings.

According to HUD’s Fair Housing Planning Guide, citizen participation relating to Fair Housing Planning
(FHP) is a component of the Consolidated Plan governed by 24 CFR § 91. Accordingly, the City’s FHP
outreach occurred in conjunction with its Consolidated Planning process.

Community Meetings
Five community workshops were conducted to introduce residents to the City’s Consolidated Plan
(ConPlan) and FHP process, familiarize them with federal funding, and to solicit input. The workshops
sought to obtain broad input from the City’s diverse communities. A total of 86 community members
participated in the workshops and provided feedback on their housing, economic and community
development priorities. The workshops were held at the following locations:

 Meeting Date Location
 1 November 4, 2019 South Mountain Community Center
 5:30 – 7:00 PM 212 E. Alta Vista Road, Mesquite Room
 2 November 5, 2019 Burton Barr Library
 10:00 AM – 12:00 PM 1221 N. Central Avenue, Auditorium
 3 November 5, 2019 Broadway Heritage Neighborhood Resource Center
 5:30 – 7:00 PM 2405 E. Broadway Road, Large Conference Room
 4 November 6, 2019 Maryvale Community Center
 5:30 – 7:00 PM 4420 N. 51st Avenue, Auditorium
 5 November 7, 2019 Adam Diaz Senior Center
 5:30 – 7:00 PM 4115 W. Thomas Road, Multipurpose Room

Information about the ConPlan and FHP processes were presented at each meeting. The presentation
included the purpose of the ConPlan and AI, the funding programs with which it is associated, and an
economic and demographic profile of Phoenix to frame the next ConPlan and AI cycle.

The presentation was followed by a series of facilitated small group discussions in which attendees
discussed how the City can make a positive impact in supporting its residents and communities. They
were also asked to rank their top four priorities in their communities using “dot voting” by placing
stickers on their preferred goals and priorities listed on a poster. Priorities included infrastructure, jobs,
 14
affordable housing, fair housing), addressing homelessness, public service, workforce and economic
development.

Community Needs Survey
To supplement the community workshops and to further understand the needs of the City’s LMI
residents, a Community Needs Survey was offered in English and Spanish. In order to gather feedback
from residents, the City engaged in inclusive community engagement and an emphasis was placed on
making the survey widely available and gathering as many responses as possible. The survey was
available online on the City’s website and hardcopies were made available at community workshops as
well as at senior centers. It was also publicized in the following ways:

 • A link to the online survey was placed on the City’s website.
 • Organizations, agencies, and persons were emailed a link to the survey.
 • Staff posted the link to the survey through the City’s social media accounts, along with
 Facebook.

During the two-month survey period from October to December there were a total of 2,026 responses,
1,875 in English and 151 in Spanish. Four of the questions pertained to fair housing. Of the 1,425 people
who answered the question, 20 percent (296 people) said they or someone they know encountered a
form of housing discrimination. Of those that answered affirmatively, a majority believe race was the
basis for discrimination. The most common form of discrimination was refusing to rent or sell a home.

The final fair housing question asked if respondents felt they are well-informed on housing
discrimination. A little more than a third (37.2 percent) said yes, while roughly 20 percent of
respondents said no. The rest felt they are somewhat informed on housing discrimination. Overall,
however, the full survey results reveal affordable housing is the top concern among respondents, and
fair housing undoubtedly plays a part in that.

Focus Groups
The City held a focus group with staff from several city departments including Neighborhood Services,
Housing, Equal Opportunity, Planning and Development, and Human Services. A total of 52 staff
participated. This focus group held a similar structure to the community workshops with a presentation
on the Consolidated Plan, AI, and community data, followed by small group discussions. The focus group
feedback placed an emphasis on the ConPlan and AI needing to address affordable housing,
homelessness, and services for special needs 8 populations.

Consultations
The City conducted comprehensive outreach to key stakeholders to enhance coordination, solicit
feedback, and discuss new approaches and efficiencies with public and assisted housing providers,
private and governmental health, mental health and service agencies, and stakeholders that utilize

8The term “special needs” covers a broad spectrum of sub-populations ranging from those with disabilities, those currently
homeless, those with health and mental health needs, persons with HIV/AIDS, seniors, transition age youth, female-headed
households and veterans (amongst others). HUD does not provide a specific definition for special needs, but puts many groups
into this category.

 15
funding for eligible activities under HUD’s entitlement programs, including fair housing services. These
organizations included:

 Organization Type Topic
 Compliance and Enforcement City Department Fair housing
 Division, Equal Opportunity
 Department, City of Phoenix
 Maricopa Association of Continuum of Care Homelessness
 Governments
 Housing Department, City of City Department Housing Opportunities for
 Phoenix Persons With HIV/AIDS
 Digital divide
 Human Services Department, City Department ESG
 City of Phoenix
 Fair housing Advocacy Group Fair housing
 Southwest Fair Housing Council

Public review
During a 5-day public review period from June 1, 2020 to June 5, 2020 the draft AI and ConPlan
document was made available at the Neighborhood Services Department and the Equal Opportunity
Department, both located in Phoenix City Hall, 200 W. Washington St., Phoenix, and posted on the City
of Phoenix’s website. The public comment period was reduced from 30 days to 5 days through a COVID-
19 related waiver.

Notice of public review was published in the Arizona Republic May 29, 2020. During the 5-day public
review period from June 1, 2020 to June 5, 2020, XX written comments were received on the AI.

Public Hearing
A virtual public hearing was held online via Web-Ex on June 2, 2020 to obtain public comment on the
draft documents and a City Council meeting was scheduled on June 3, 2020 to consider adopting the
City’s proposed 2020-2025 Consolidated Plan, 2020-2021 Action Plan, and 2020-2025 Analysis of
Impediments to Fair Housing Choice

Key Issues Identified
Key issues identified from public outreach efforts offered insight into the following issues and recent
trends related to fair housing in Phoenix:

 • A significant number of people – a fifth of respondents to the fair housing survey questions –
 believe they or someone they know has experienced housing discrimination.
 • Among those who felt they or someone they know experienced housing discrimination; race
 was believed to be the primary factor.
 • According to the City’s Equal Opportunity Department, a vast majority of fair housing cases in
 the region involve discrimination against people with disabilities. Most often, this involves
 refusing to provide reasonable accommodations.
 • An increasing number of fair housing complaints involve sexual harassment.
 16
• Just 37 percent of survey respondents believe they are well-informed on housing discrimination.
• Over 60 percent of respondents reported had difficulty finding an affordable home.

 17
Community Profile
This section presents demographic, economic, and housing information collected from the Census
Bureau, the Bureau of Economic Analysis, the Bureau of Labor Statistics, and other sources. Data were
used to analyze a broad range of socioeconomic characteristics, including population growth, race,
ethnicity, disability, employment, poverty, and housing trends. Ultimately, the information presented in
this section helps illustrate the underlying conditions that shape the housing market and fair housing
choice in Phoenix.

The City of Phoenix is divided into 15 villages: Ahwatukee Foothills, Alhambra, Camelback East, Central
City, Deer Valley, Desert View, Encanto, Estrella, Laveen, Maryvale, North Gateway, North Mountain,
Paradise Valley, Rio Vista, and South Mountain. The figure below shows the boundaries of these villages:
Figure 1 Phoenix Villages

Demographic Overview
The population and demographic data in this section summarize the City’s residents falling within
protected classes, as well as the characteristics of the general population. These data help determine
whether racial and ethnic minorities or lower income households are concentrated in certain areas.
They also provide context for analyzing in later sections the fair housing environment in Phoenix.

 18
Population Growth
In the nine years since the 2010 Census, Phoenix’s population has increased 12 percent, eclipsing
Arizona’s growth of 7.6 percent over that same time period. Since 2000, the City’s population has grown
nearly 26 percent, and the population is expected to continue to grow. Since 1870, Phoenix has seen at
least double-digit growth every decade except for one (2000’s), and it has been one of the fast-growing
American cities since the Great Recession. 9
Table 1-Historical Population by Decade
 Census Population Population Change Change (in %)
 1870 240 240 -
 1880 1,708 1,468 611.7
 1890 3,152 1,444 84.5
 1900 5,544 2,392 75.9
 1910 11,314 5,770 104.1
 1920 29,053 17,739 156.8
 1930 48,118 19,065 65.6
 1940 65,414 17,296 35.9
 1950 106,818 41,404 63.3
 1960 439,170 332,352 311.1
 1970 581,572 142,402 32.4
 1980 789,704 208,132 35.8
 1990 983,403 193,699 24.5
 2000 1,321,045 337,642 34.3
 2010 1,445,632 124,587 9.4
Source: U.S. Census Bureau

Table 2- Recent Population Trend
 Year Population Change (in %)
 2010 1,449,242 -
 2011 1,451,966 0.2
 2012 1,464,727 0.9
 2013 1,485,751 1.4
 2014 1,506,439 1.4
 2015 1,527,509 1.4
 2016 1,559,998 2.1
 2017 1,579,253 1.2
 2018 1,597,738 1.2
 2019 1,617,344 1.2
Source: Population Estimates, Arizona Office of Economic Opportunity

9 Brenda Richardson, “Census Reveals the Fastest-Growing Cities in the U.S.: Here’s Why Phoenix is So Hot,” Forbes, May 28, 2019.
 19
Age Composition
Table 3 below shows the age distribution of Phoenix compared to the State of Arizona. The working
adult age group (ages 25 to 64 years) represents over half (53.1 percent) of Phoenix’s total population,
while school-aged youth (5 to 24 years) represent almost one-third (29.2 percent). Seniors (65 years and
over) accounted for 9.8 percent of the local population. In comparison, working age Arizonans comprise
50.1 percent of the statewide population and school-aged youth and seniors account for 27.3 percent
and 16.2 percent of the state population, respectively. This indicates that the local population is younger
than the State’s.
Table 3- Age Distribution

 Age Phoenix Arizona
 Group Number % of total Number % of total
 Under 5 118,568 7.5 316,189 6.0
 5-9 119,946 7.6 334,939 6.4
 10-14 115,691 7.3 342,602 6.5
 15-19 109,046 6.9 353,293 6.7
 20-24 116,847 7.4 366,650 7.0
 25-39 125,721 8 343,292 6.6
 30-34 122,228 7.8 326,573 6.2
 35-39 110,376 7 311,297 5.9
 40-44 108,183 6.9 311,856 6.0
 45-49 104,604 6.6 309,878 5.9
 50-54 100,018 6.4 326,410 6.2
 55-59 88,771 5.6 324,280 6.2
 60-64 77,312 4.9 319,014 6.1
 65-69 57,201 3.6 305,398 5.8
 70-74 38,865 2.5 243,468 4.7
 75-79 25,960 1.6 178,118 3.4
 80-84 16,205 1 116,526 2.2
 Over 85 18,879 1.2 105,742 2.0
Source: 2013-2017 American Community Survey, U.S. Census Bureau

Analyzing the age distribution is important because it affects the need for jobs, housing, and other social
services. More than half of the City’s population is under the age of 35, and includes young children,
students, recent graduates, or adults just entering the job market. Planning efforts may need to
incorporate additional schools, entry-level jobs, and starter homes. On the other hand, adults over 35-
years old may prefer larger homes to accommodate larger families, whereas seniors may prefer smaller
units that have lower costs and are closer to services.

Age and fair housing intersect when managers or property owners make housing decisions based on the
age of residents. For example, property owners or managers may prefer to limit the number of children
in their complex or discourage older residents due to their disabilities. Although a housing provider may
establish reasonable occupancy limits and set reasonable rules about the behavior of tenants, those
rules cannot single out children or refuse to make reasonable accommodation.

 20
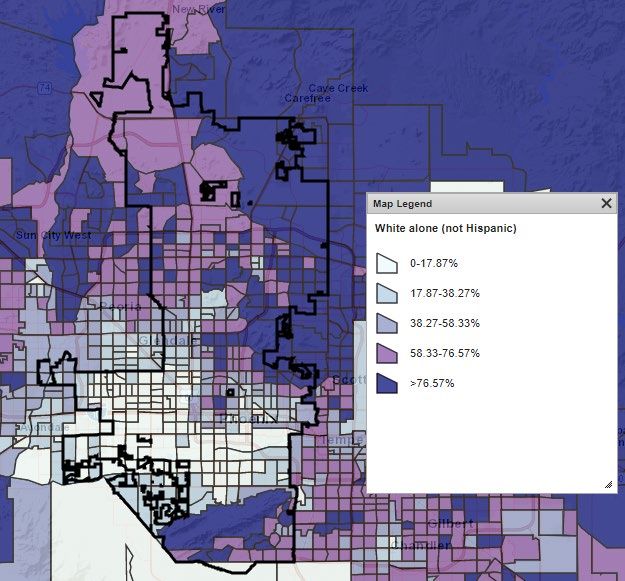
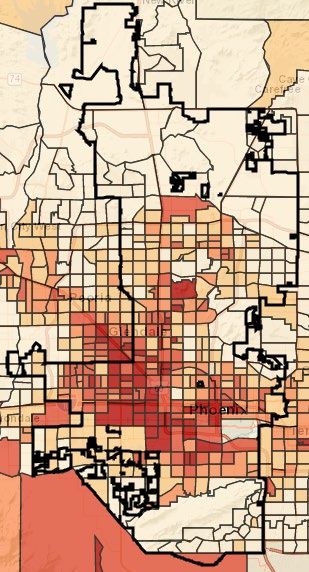
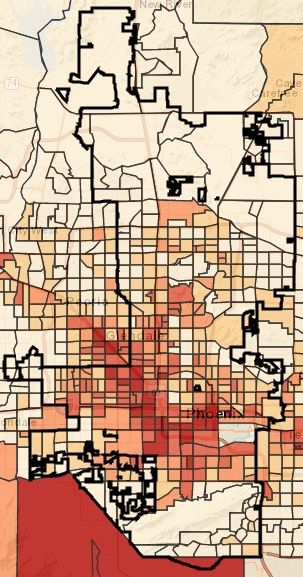
Race/Ethnicity
Table 4 illustrates the racial/ethnic breakdown of Phoenix residents. Since 2000, the fastest growing
racial/ethnic group in the City is the Hispanic population. By 2017, it lagged the share of white
population by less than one percent. More broadly, Phoenix has become much more diverse over time,
and is a now majority-minority city, with all minorities but the American Indian and Alaska Native race
increasing its population share.
Table 4- Population by Race/Ethnicity
 Share of population (by %)
 Race/Ethnicity 2000 2010 2017
 White 55.8 46.5 43.3
 Hispanic/Latino 34.1 40.8 42.5
 Black/African American 5.1 6.0 6.6
 Asian 2.0 3.0 3.5
 Native Hawaiian and Pacific Islander 0.1 0.1 0.2
 American Indian and Alaska Native 2.0 1.6 1.6
 Two or more/other 3.3 1.7 2.2
Source: 2013-2017 American Community Survey, U.S. Census Bureau

Ethnic and racial composition of a region is useful in analyzing housing demand and related fair housing
concerns. Research by the National Fair Housing Alliance (NFHA) and HUD Department of Fair Housing
and Equal Opportunity (FHEO) show that race-based discrimination ranks second behind only disability
in the number of fair housing complaints between 2000 and 2017. 10 Therefore, understanding the
number and concentration of minority populations can inform fair housing practices. Figure 1 depicts
the white alone population by census tract.

10 “Fair Housing by the Numbers,” National Low Income Housing Coalition, February 25, 2019.
 21
Figure 2 Concentration of White Population by Census Tract

Source: U.S Department of Housing and Urban Development

The map from HUD above represents the distribution of the City’s white population. Counterintuitively,
the census tracts highlighted in white represent those that are more than 83 percent non-white. This
map shows a clear pattern – the southern part of the City is largely non-white, while the northern part is
predominately white.

National Origin
Phoenix’s population is about 19.6 percent foreign born. This is above the foreign-born population share
of the Metropolitan Statistical Area (MSA) (13.8 percent), state (13.2 percent) and U.S. (14 percent), but
since the 2000 Census, the latter three areas added more foreign-born people than did the City of

 22
You can also read