Scoping Climate Change Risk for MBRC - August 2009 - Climate Risk - Moreton Bay ...

Page created by Floyd Barker
 
CONTINUE READING
Scoping Climate Change Risk for MBRC - August 2009 - Climate Risk - Moreton Bay ...
A Climate Risk Report
                        Scoping Climate Change
                        Risk for MBRC

                        			                      August 2009

                        Climate Risk Pty Ltd provides specialist professional services to business
                        and government on risk, opportunity and adaptation to climate change.        Climate Risk
                        www.climaterisk.net
Scoping Climate Change Risk for MBRC - August 2009 - Climate Risk - Moreton Bay ...
Climate Risk Pty Limited (Australia)
Sydney:         + 61 2 8243 5767
Brisbane:       + 61 7 3040 1621
www.climaterisk.net

Climate Risk Europe Limited
London:        + 44 752 506 8331

This report was prepared by:

Donovan Burton B.Env.Plan (Hons), PhD Cand.
donovan@climaterisk.com.au

Dr Karl Mallon BSc, PhD
karl@climaterisk.com.au

Pazit Taygfeld B.Env.Plan (Hons)
pazit@climaterisk.com.au

Erin Laurie
erin@climaterisk.com.au

Lauren Bowra LLB / B.Env.Plan
lauren@climaterisk.com.au

Acknowledgements:
The authors would like to sincerely acknowledge Evan Raymond for his valuable input into this
report. We would also like to acknowledge the contributins from Moreton Bay Regional Council staff,
CLIMsystems and other external stakeholders.

Disclaimer:

Climate Risk Pty Ltd provides professional services in relation to climate change risks and opportunities.
Our technical and professional staff endeavour to work to international best practice standards using
experienced scientists, sector specialists and associated experts. This document is intended to stimulate
ideas and generate discussion for Moreton Bay Regional Council. While the information contained is
drawn from reputable sources in the public domain, Climate Risk cannot take responsibility for errors
or inaccuracies within original source material. This report does not consider individual investment
requirements or the particular needs of individuals, corporations or others and as such the report should
not be relied upon as the basis for specific commercial or other decisions. To the extent permitted by
law, Climate Risk Pty Ltd accepts no liability for decisions made, losses, expenses, damages or costs
associated direct and/or indirectly from this report.

Climate Risk supports a constructive dialogue about the ideas and concepts contained herein.

© Copyright Climate Risk Pty Ltd, 2009. This document is protected by copyright. Reproduction is
authorised provided that Climate Risk Pty Ltd is appropriately cited and any diagrams used retain the CR
logo if it is present. The rights of the authors have been asserted.
Scoping Climate Change Risk for MBRC - August 2009 - Climate Risk - Moreton Bay ...
Climate Risk Team

              Donovan Burton
              Donovan heads Climate Risk’s Local Government and Urban Planning section where
              he works closely with local government and industry to help develop climate change
              adaptation and mitigation strategies. He has a degree in Environmental Planning and
              achieved a First Class Honours for his thesis on local climate change mitigation. He has
              received a scholarship from the Wentworth Group of Concerned Scientists as well as a
              range of other academic awards. Donovan has facilitated numerous local government
              climate change risk assessments throughout Australia and is regarded as one of the
              country’s leading professionals in this field. Donovan is currently also undertaking his
              PhD at Griffith University where he is researching strategies to mainstream climate
              change adaptation, linking insurers with developers, lenders and local government.

              Dr. Karl Mallon
              Dr. Karl Mallon is director of Science and Systems at Climate Risk Pty Ltd. He is a First
              Class Honours graduate in Physics and holds a Doctorate in Mechanical Engineering. Karl
              has worked in climate change mitigation, policy and technical analysis since 1991. He
              is editor and co-author of a book on climate and energy policy published by Earthscan
              (London) and has worked with various international government and non-government
              organisations since 1997. He currently specializes in climate change impacts risk to local
              government, insurance, institutional investment and works with large corporations on
              opportunities for operation under carbon and climate constraints.

              Pazit Taygfeld
              Pazit is an Environmental Planner with experience in oil vulnerability (peak oil) research.
              Pazit graduated from Griffith University, with a first class honours on Local and State
              Government responses towards oil vulnerability and constraints. During her work for the
              Griffith University Urban Research Programme Pazit was the lead author of a report on oil
              vulnerability for the Queensland Department of Transport and is also the co-author of a
              number of reports on environmentally and economically optimised tourism. Pazit has also
              worked for Redland Shire Council, developing land management plans for conservation
              areas. Before joining Climate Risk, Pazit worked as an environmental consultant for
              a Brisbane based organisation, assisting them to identify methods to reduce their
              greenhouse gas emissions and improve environmental performance.

              Erin Laurie
              Erin works for Climate Risk as a Climate Change Planning Analyst. She holds a Bachelor
              of Environmental Planning and a Bachelor of Environmental Science, majoring in
              Ecology and Conservation Biology. She has received awards for academic achievement
              throughout her studies and graduate with the University Medal for Environmental
              Planning. Erin has experience working for both state and local government in
              Queensland, working in water allocation and regional planning, respectively. Erin has
              developed plans for, and worked with, local communities in northern Queensland
              to ensure the efficient management and allocation of water, including establishing a
              framework for water trading in the region.

              Lauren Bowra
              Lauren works in the Brisbane office working on Local Government, Regional Planning
              and ICT sectors. Lauren holds a double degree in Environmental Planning and
              Environmental Law. Lauren’s passion for climate change adaptation has seen her
              undertake her honors research studying the role of insurance in main streaming climate
              change adaptation. Lauren’s recent studies at Griffith University include climate change
              law and climate change planning policy.
Scoping Climate Change Risk for MBRC - August 2009 - Climate Risk - Moreton Bay ...
Executive Summary
The scientific consensus is that                                    The main findings of this report highlight
climate change is real, it is affecting                             that Moreton Bay Regional Council
society now and if left unchecked will                              (MBRC) is exposed and vulnerable to
cause immense socio-economic and                                    many projected impacts from climate
environmental impact (Garnaut 2008).                                change. In this report, we highlight
Climate is very relevant to Moreton                                 that MBRC’s risks stem from primary,                         Council will need to
Bay Regional Council. The most recent                               secondary and tertiary hazards (Figure                       make challenging
edition of the Intergovernmental Panel                              i); the exposure to those hazards; and                       decisions regarding
on Climate Change (IPCC) highlights                                 council’s vulnerability should the                           the cost-benefit of
that the South East Queensland (SEQ)                                hazards materialize.                                         early, mid and late
Region’s unchecked development and                                                                                               term adaptation
rapid growth “is projected to exacerbate                                                                                         options.
                                                                    Primary hazards
risks from sea-level rise and increases
in the severity and frequency of storms                             The scoping risk assessment highlights
and coastal flooding by 2050” (IPCC                                 that MBRC (or parts ofMBRC) is exposed
2007, p.509).                                                       to all of the main primary climate
                                                                    change hazards, including sea level rise,
                                                                    storm surge, precipitation change, heat
                                                                    waves, flooding and extreme weather

                                                                               Primary Hazards (direct physical effects)
                                                                               examples:                                            Figure i. Primary,
                                                                               1. Temperature                                       secondary and
                                                                               2. Precipitation                                     tertiary climate
                                                                               3. Drought                                           change hazards
                                                                               4. Wind                                              discussed in this
                                                                               5. Fire weather (increased bushfire conditions)
                                                                                                                                    report.
                                                                               6. Sea-level rise
                       Climate Risk
                                                                               7. Severe weather (e.g. hail and lightning)

                                                                               Secondary Hazards (regulatory) examples:
                                                                               1. Hazards from planning regulation
                                                                               2. Carbon constraints and markets
                                                                               3. Building and infrastructure standards
                                                                               4. Insurance industry regulatory change

                                                                               Tertiary Hazards (social response) examples:
                                                                               1. Changing demographics
                                                                               2. Population shift
                                                                               3. Changing consumer spending patterns
                                                                               4. Changing energy use

                                                                                                                                                         ii
               Moreton Bay Regional Council Climate Change Risk Assessment
Climate Risk
Scoping Climate Change Risk for MBRC - August 2009 - Climate Risk - Moreton Bay ...
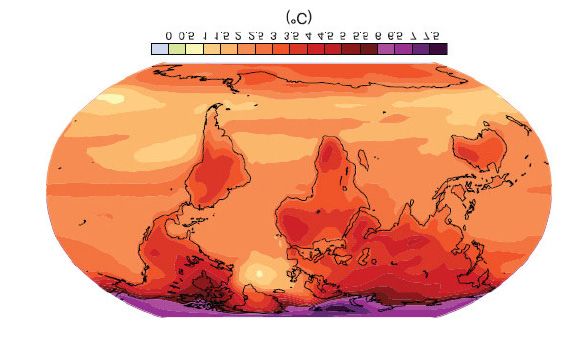
events. This will have a material impact                            patterns and population shift to and
on Council because of the exposure                                  from the region. These actions have the
of its assets and the exposure and                                  potential to alter the demographic of the   The Moreton Bay
vulnerability of much of the community                              region and either increase or decrease      Region is highly
it represents. The required adaptation                              Council’s ability to foster a resilient     vulnerable to
actions will introduce short-medium                                 community.                                  decisions which
term increased operational costs.                                                                               the community and
Failure to adapt will result in ongoing                                                                         businesses make in
                                                                    Economic Ramifications
long term economic challenges.                                                                                  response to climate
                                                                    Each of the sectors of Council and the      change.
                                                                    community are exposed in various ways,
Secondary Hazards
                                                                    but all these risks present significant
This report also shows that Council is                              economic challenges for Moreton Bay
significantly exposed to and vulnerable                             Regional Council, which include:.
to secondary risks, such as regulatory
and policy changes, and changes                                     •    Increased insurance costs – Insurers
to insurer expectations. The most                                        no longer wish to shoulder the
pressing secondary hazards stem                                          increased cost associated with
from the Commonwealth’s Carbon                                           climate change. It is anticipated
Pollution Reduction Scheme (CPRS), the                                   that insurers will use a range of
Queensland Government’s Planning                                         incentives (including increased
Reform (including the South East                                         premium costs or withdrawal) to
Queensland Regional Plan 2011-2031),                                     reduce Council’s climate change
and any insurance related change. Each                                   related risks. ,
of these will add increased compliance
related strains on Council and may                                  •    Increased operational costs
present potential legal ramifications.                                  – Primary, secondary and tertiary
The CPRS will also ultimately result                                     hazards present an array of
in increased operational costs until                                     increased costs for Council. In the
Council finds viable alternatives to fossil                              short term Council will require
fuel based costs.                                                        additional resources to ensure
                                                                         compliance to new standards
                                                                         and regulations as well as cost
Tertiary Hazards
                                                                         associated with upgrading assets
The MBRC region is highly vulnerable                                     and services required to deal with
to decisions which the community and                                     the change. Increased costs may
businesses make in response to climate                                   also arise from increased damage
change. These actions include building                                   and cleanup costs associated with
design and quality, business location,                                   extreme weather events.
air-conditioner use, changing consumer

                                                                                                                                      iii
               Moreton Bay Regional Council Climate Change Risk Assessment
Climate Risk
Scoping Climate Change Risk for MBRC - August 2009 - Climate Risk - Moreton Bay ...
•              Increased energy costs - Council                     adaptation, expenses will increase due
               spends a considerable portion of                     to climate change, although evidence
               its budget on energy. Emissions                      suggests that these can be reduced
               trading will be implemented within                   substantially.
               two years and the cost of carbon will
               continue to increase substantially                   It is our view that if additional resources
               over the coming decades. Until                       for climate change are not embedded
               Council reduces its dependence on                    into the existing Council budget Council
               fossil fuels a carbon constrained                    will either,                                  MBRC operation
               economy will see significant                                                                       expenditure may
               increases in its energy related costs.               a)   Ultimately become less financially       increase by over $5
               MBRC operation expenditure may                            viable as it attempts reactionary        million per annum
               increase by over $5 million per                           short term measures, or                  and $17 million
               annum and $17 million within the                                                                   within the first few
               first few years of carbon trading.                   b) Require increased resources from           years of carbon
                                                                       its ratepayers and/or State and            trading.
•              Potential litigation –Legal costs often                 Commonwealth funding.
               present challenges for councils. It
               is envisioned that climate change
               and associated strategies may lead
               to increased planning challenges
               and potential tort-based litigation.
               As the science surrounding climate
                                                                                       2070                       50 days
               change strengthens there will be                                                                   45
               increasing pressure on Council to                                                                  40
               make appropriate decisions on the                                                                  35
                                                                                                                  30
               type and location of development.                                                                  25
                                                                                                                  20
                                                                                                                  15
Adaptation challenges                                                                                             10
                                                                                                                  5
Council will need to make challenging                                                                             0

decisions regarding the cost-benefit
of early, mid and late term adaptation                                                                               Figure ii. 2070 Average
                                                                                                                     no days max temp >
options. Increased insurance, energy                                                                                 35ºC (annually) A1FI,
and maintenance costs are virtually                                                                                  Ensemble, Medium
certain, placing strains on Council’s                                                                                Sensitivity .

ability to provide other adaptive
measures to support community (e.g.
increased public transport provisions).
Increased maintenance and operational
costs will likely run into millions of
dollars (and even more if tort based
litigation occurs). Even with appropriate

                                                                                                                                               iv
               Moreton Bay Regional Council Climate Change Risk Assessment
Climate Risk
Scoping Climate Change Risk for MBRC - August 2009 - Climate Risk - Moreton Bay ...
Next steps                                                          6.   Increase and maintain adaptive
                                                                         capacity

Although climate change presents
                                                                    7.   Make representation to state and        Until Council
significant challenges for MBRC there
                                                                         federal government for areas where      reduces its
are many opportunities that can be
                                                                         Council has responsibility              dependence
utilized to reduce these risks. These
                                                                                                                 on fossil fuels a
actions, which have a range of ancillary
                                                                    8.   Be prepared to set a precedent          carbon constrained
benefits include:
                                                                         by challenging development on           economy will see
1.             Develop a climate change working                          adaptation principles                   significant increases
               group with supporting resources                                                                   in its energy related
                                                                    9.   Identify potential cocktail effects     costs.
2.             Add climate risks to the council risk                     from multiple coincident impacts
               register
                                                                    10. Explore public / private partnerships
3.             Undertake detailed assessment of                         towards economic resilience
               high priority risk
                                                                    11. Raise community awareness of risks
4.             Engage with insurers to discuss risk                     and support for adaptive measures
               management and cover                                     by Council

5.             Embed climate change into the                        12. Focus on identifying sources to help
               corporate plan and planning scheme                       fund the required adaptation
                                                                                                                 Figure iii. Mean
                                                                                                                 number of days with
                                                                                                                 precipitation of less
                                                                                                                 than 1 mm (annually)
                                                                                                                 A1FI, Ensemble,
                                                                                                                 Medium Sensitivity.
                                                                                                                 (CLIMSystems & Climate
                                                                                                                 Risk 2009)
           1960-2000                          2030                           2050                         2070
                                                                                                                        2400 mm
                                                                                                                        2100
                                                                                                                        1800
                                                                                                                        1600
                                                                                                                        1200
                                                                                                                        1100
                                                                                                                        1000
                                                                                                                        900
                                                                                                                        800
                                                                                                                        700
                                                                                                                        600

                                                                                                                                          v
               Moreton Bay Regional Council Climate Change Risk Assessment
Climate Risk
Scoping Climate Change Risk for MBRC - August 2009 - Climate Risk - Moreton Bay ...
Contents
1 Introduction 										                                1
Scope											                                         1
Limitations										                                    2

2 Climate Change Overview								                        3
Climate Change in Australia								                      5
Climate Change in SEQ									                           6
South East Queensland									                           6

3 Methodology										                                  9

4 Hazards										                                      11
Primary Hazards										                                12
Secondary Hazards										                              25
Tertiary Hazards										                               39

5 Exposure										                                     40
Asset Planning and Delivery								                      40
Asset Maintenance and Construction							                42
Community and Cultural Services							                   45
Strategic Planning and Development							                48
Moreton Bay Water										                              50
Environment and Local Laws								                       50
Office of the CEO										                              53
Corporate Services										                             55

6 Vulnerability										                                57
Responsibilities of Council								                      57
Council’s Assets and Operational Costs							            58
Community Demographic and Socio-Economic Structure				   58
The Resilience of the Local Economy							               60
Developmental Controls								                           60
Council Capacity to Deliver Adaptive Change						        61

7 Adaptation Options									                            71

References										                                     78

APPENDIX 1										                                     81
APPENDIX 2										                                     82
Scoping Climate Change Risk for MBRC - August 2009 - Climate Risk - Moreton Bay ...
1 Introduction

“Climate change will impact                                                       often lack resources and capacity to
 future city spatial patterns,                                                    implement them.
 growth, and development”
(World Bank 2008, p.5)                                                           The aim of this report is to provide a
                                                                                 scoping assessment of the potential
The scientific concern is that climate
                                                                                 climate change specific risks facing
change is real, it is affecting society
                                                                                 Moreton Bay Regional Council (MBRC).
now and if left unchecked will cause
                                                                                 This report also presents a range
immense socio-economic and
                                                                                 of adaptation option pathways for
environmental impacts (Garnaut
                                                                                 MBRC to help foster a climate resilient
2008). The most recent edition of
                                                                                 community.
the Intergovernmental Panel on
Climate Change (IPCC) adaptation
report highlights that the South East                                             Scope
Queensland (SEQ) Region’s unchecked
development and rapid growth “is                                                 This report was commissioned by MBRC
projected to exacerbate risks from sea-                                          to raise the awareness of potential
level rise and increases in the severity                                         climate change risks for the Council
and frequency of storms and coastal                                              and the community it represents. In
flooding by 2050” (IPCC 2007, p.509).                                            particular, Climate Risk Pty Ltd was
This view on SEQ’s vulnerability has                                             asked to focus on the exposure to:
been recently supported by the Garnaut
Review, which highlights that tens of                                             Council Operations
billions of dollars worth of assets and
services in SEQ are exposed to severe                                            •       Potential Operational Impacts – how
weather events (Garnaut 2008).                                                           will climate change impact on the
                                                                                         Council’s operational activities
The Queensland Government has
recently acknowledged these climate                                              •       Potential Litigation1 – what is the
change risks and are undertaking                                                         level of liability that may occur from
policy and regulatory changes to                                                         climate change; and
consider climate change mitigation and
adaptation.                                                                      •       Planning – what implications will
                                                                                         climate change have for planning
As will be discussed in this report, the                                                 decisions
State and Commonwealth response to
climate change also presents an array of                                          Community Exposure
regulatory risks to Local Governments,
who are at the forefront of climate                                              •       Economic – what business and
change management strategies but                                                         industry sectors will be exposed to

1       It is important to note that Climate Risk Pty Ltd cannot offer legal advice and that the discussion on potential litigation
        will derive from a broad literature review of existing views surrounding potential litigation risk. We have access to a
        broad range of papers that have discussed legal exposure for Councils in Queensland.

                                                                                                                                      1
               Moreton Bay Regional Council Climate Change Risk Assessment
Climate Risk
Scoping Climate Change Risk for MBRC - August 2009 - Climate Risk - Moreton Bay ...
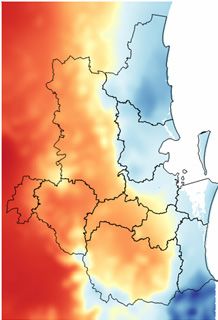
climate change impacts in the region

•              Community - assess the risk and
               impact to the region’s residents from
               climate change

Environment

•           What are the potential impacts of
            climate change on the environment
           – biodiversity, weeds, water
            availability

Insurance

•              What is the potential impact on
               insurance premiums for Council and
               community

Costs

•              Identify the potential costs of
               climate change for the above themes

Limitations
All information in this discussion paper
is drawn from credible sources in the
public domain and internal analysis.
However, all existing climate change
science has an element of uncertainty
regarding regional impacts.

This report provides an initial
assessment of the type and significance
of risks to MBRC. It is not a detailed
examination of the Council’s specific
risks and vulnerabilities and cannot be
used as the basis of any financial or legal
decisions.

                                                                             2
               Moreton Bay Regional Council Climate Change Risk Assessment
Climate Risk
2 Climate Change Overview

There is now overwhelming evidence                                  other regions. Evidence that increase
that global average temperatures are                                in the earth’s global temperatures is
increasing as a result of anthropogenic                             already affecting terrestrial biological
interference of the earth’s climatic                                systems is mounting, with changes
system (Stern 2006; Pittock 2005;                                   being recorded in numerous scientific
Stefan 2006). The latest data reveals                               publications and international reports
a clear trend in the rate of carbon                                 (IPCC 2007; Rosenzweig et al. 2008).
emissions across the globe, which is                                The fourth assessment report by the
contributing significantly to global                                IPCC Working Group II has warned that
warming. Data released by the Global                                the consequences of climate change,
Carbon Project (2008) shows that since                              including sea level rise and increased
2000 anthropogenic CO2 emissions                                    frequency and intensity of weather
have grown at a rate four times faster                              events, will result in ‘adverse effects on
than during the previous decade and                                 human and natural systems’ (IPCC 2007,
are exceeding the worst case scenario                               p. 52).
projected by the IPCC’s long term
scenarios.                                                          Current international negotiations are
                                                                    attempting to reduce greenhouse gas
The Earth’s global temperature has                                  emissions to a level that is significantly
warmed significantly over the past                                  below the 1990 levels (up to 80% by
100 years (IPCC 2007). On average                                   2050). However, latest data suggest that
the world is currently 0.74oC warmer                                CO2 emissions are growing faster than
than what is was a century ago (IPCC                                ever, mainly as a result of increased
2007) (Figure 1). Furthermore the rate                              wealth, the rapid economic growth
of change has not been uniform across                               experienced by China and India and
the globe, with the northern latitudes                              the declining efficiency of the world’s
seeing much more warming than                                       natural carbon sinks (Global Climate

                              0.6
                                                                                                                 Figure 1. Temperature
                                                                                                                 anomaly from pre-
                              0.4
                                                                                                                 industrial times. This
       Temperature                                                                                               graph highlights that the
                              0.2
       anomaly (oC)                                                                                              Earth has experienced
 (change over time)           0.0
                                                                                                                 a significant increase
                                                                                                                 in average temperature
                                                                                                                 since the 1990s.
                             - 0.2

                             - 0.4

                             - 0.6

                                     1860     1880      1900       1920          1940   1960   1980   2000

                                                                          Year

                                                                                                                                             3
               Moreton Bay Regional Council Climate Change Risk Assessment
Climate Risk
project 2008; Canadell et al. 2007).                                            and a 19% - 40% likelihood of irreversible
                                                                                melting of the Greenland Ice Sheet
Regardless of existing efforts to curb                                          (leading to significant sea level rise). An
greenhouse gas emissions by countries                                           increase of 1.5oC - 2.5oC is also likely to
which are signatories to the Kyoto                                              have negative impacts on ecosystems
Protocol, it is now widely accepted that                                        services (e.g. water and food supply),
global world temperatures will continue                                         and have serious consequences for
to rise for the remainder of this century                                       human and animal health (IPCC 2007,
at least. This is because we still have the                                     p.26). Some argue that 2oC of average
locked in impacts, due to the existing                                          warming leads to the beginnings
carbon loading in the atmosphere.                                               of “runaway” climate change, where
Latest projections by the IPCC suggest                                          positive feedback mechanisms are
that average global temperatures will                                           triggered (such as the drying of the
increase by approximately 1.8oC and                                             Amazon Rainforest or melting of
4.4oC by 2100 (IPCC 2007). However                                              permafrost), leading to the higher end
James Hansen the director of the                                                of climate change projections (i.e. 6oC
NASA Goddard Institute for Space                                                increase of 1990 levels and 2 metres sea
Studies believe that these projections                                          level rise by 2100)(Hansen et al. 2008).
are conservative and that global
temperatures can rise by up to 6oC by                                           Strategies to deal with climate change
the end of the century (Hansen et al. in                                        generally consist of two elements:
press; IEA 2008)2.                                                              adaptation and mitigation (Pittock 2005,
                                                                                p.7). The IPCC defines adaptation as an
 Although these figures may not seem                                           ‘adjustment in natural or human systems
 significant, an increase of only 2oC can                                       in response to actual or expected
 have devastating consequences. As                                              climatic stimuli or their effects, which
 shown by Garnaut (2008, p.139) 1.8oC                                           moderates harm or exploits beneficial
- 2.3oC warming may mean 10%-17% of                                             opportunities’ ( Metz et al. 2001, p.708).
 the world’s species becoming extinct

                                                                                                                                 Figure 2. Projected
                                                                                                                                 surface warming for end
                                                                                                                                 of 21st Century (IPCC
                                                                                                                                 2007); temperatures are
                                                                                                                                 relative to the period
                                                                                                                                 1980-1999.

2       Hansen et al. (in press) and Rind (2008) argue that standard climate models (including the widely used Charney
        Sensitivity model) do not consider significant factors such as changes in glaciation and vegetation and the ability of
        oceans to absorb CO2, which diminishes as sea water temperature rises.

                                                                                                                                                           4
               Moreton Bay Regional Council Climate Change Risk Assessment
Climate Risk
This definition is expanded on by                                       average global warming, the global
 Adger, et al. (2005) who state that                                    greenhouse emissions continue to rise.
‘adaptation can involve both building                                   This pattern is projected to continue
 adaptive capacity … and implementing                                   without a concerted global effort to
 adaptation decisions’ (p.77).                                          contain emissions growth (Figure 3).

Mitigation is defined by the IPCC (Metz
                                                                        Climate Change in Australia
et al. 2001, p. 716) as ‘an anthropogenic
intervention to reduce the sources or                                    Australia is vulnerable to a changing
enhance the sinks of greenhouse gases.’                                  climate. The past century has seen
                                                                         Australia experience an average
In a summary for the IPCC Banuri et al.                                  warming of 0.7oC and a significant
(2001, p.52) advocate that adaptation                                    reduction in coastal precipitation
and mitigation need to be considered                                     (Preston & Jones 2006). This warming
together in any climate change response.                                 trend is set to continue with predictions
The connection between adaptation                                        that by 2030 average Australian
and mitigation is often overlooked.                                      temperatures could increase from 0.4oC
Environmental lag time means that                                       - 2oC above 1990 temperatures and 1oC
climate change is already here and that                                 - 6oC by 2070 (Preston & Jones 2006).
we have to adapt to current and future                                   According to the Australian Department
changes that are already locked in.                                      of Climate Change, climate change will
Mitigation strategies attempt to reduce                                  place considerable strain on Australia’s
the severity of the impacts and ensure                                   coastal communities including
that any climatic change occurs within                                   sea level rise and increased storm
our capacity to adapt (Pittock 2005).                                    surges, changes to marine and coastal
                                                                         biodiversity and changes to fisheries
Although international discussions are                                   (Voice et al. 2006, p.2).
underway with the objective to contain
                                                                                                                     Figure 3. Recent ABARE
                                            160           giam                                                       modelling shows that
                                                          a1fi                                                       current emission rates
                                                          a2                                                         (GIAM) are outpacing
                                                          a1b                                                        previous IPCC
                                                          b2                                                         projections.
                                            120           a1t
                                                          b1
                                 GtCO2-eq

                                            80

                                            40

                                                  2000   2020    2040   2060   2080   2100

                                                                   Year

                                                                                                                                              5
               Moreton Bay Regional Council Climate Change Risk Assessment
Climate Risk
Climate Change in SEQ                                                    natural and built environment is under
                                                                         considerable pressure to cater for the
“Queensland’s coastal                                                    increasing population. The changing
                                                                         climate is and will continue to increase
 settlements are anticipated to
                                                                         this pressure, whilst decreasing the
 suffer extreme infrastructure                                           region’s resilience. There are potentially
 impacts from increased storm                                            several important effects of climate
 surge and localised flash                                               change in SEQ including reduced water
 flooding.”                                                              quality and availability; vegetation
                                                                         loss; increased weed invasion; threats
(Garnaut 2008, p.126)
                                                                         to grazing; impacts on the pasture and
                                                                         forestry industry; and a broad range of
SEQ is one of Australia’s fastest                                        effects arising from heat stress. A more
growing regions with a population set                                    detailed description of SEQ climate
to increase by over one million over                                     change variables is included in chapter
the next twenty years (QDLGPSR 2005)                                     four (see Figures 5,6 and 7 for SEQ
from its current level of 2.7 million. The                               projections).

                                                                                                                                Figure 4. Recent
                                                                                                  Increase                      science suggests that
                                                                                                 in annual        Number of     South East Queensland
                                                                     Brisbane
                                                                                               temperature        days >35 oC   will experience
                                                                                                    (oC)
                                                                                                                                significant challenges
                                                                      Present                                         1.0       from climate change
                                                                                                                                (Q.OCC 2008).
                                                                   2030 average
                                                                                                1.0 (0.7 - 1.4)     2 (1 - 2)
                                                                  (mid emissions)

                                                                   2070 average
                                                                                                1.6 (1.1 - 2.3)     3 (2 - 4)
                                                                  (low emissions)

                                                                   2070 average
                                                                                                3.1 (2.1 - 4.4)    6 (4 - 14)
                                                                  (high emissions)

         South East Queensland

         •        Marked drying trend since 1950s             •    Less water available in future for cities,
         •        Potential for more significant increases         industries, agriculture and natural
                  in inundation as a result of storm surges        ecosystems
                  due to higher mean sea level and more       •    Number of days over 35 oC expected to
                  intense weather systems                          increase in future, potentially affecting
         •        Increase in 1-in-100-year storm tide             peak energy demand
                  events projected to be 0.45 m along the     •    Less frost damage to crops and higher
                  Sunshine Coast, mostly due to sea-level          wheat yields but lower wheat quality
                  rise                                        •    Increased pest and disease risk

                                                                                                                                                         6
               Moreton Bay Regional Council Climate Change Risk Assessment
Climate Risk
1960-2000                       2030                          2050    2070
                                                                                             2400 mm
                                                                                             2100
                                                                                             1800
                                                                                             1600
                                                                                             1200
                                                                                             1100
                                                                                             1000
                                                                                             900
                                                                                             800
                                                                                             700
                                                                                             600

                                                                                             Figure 5. Mean
                                                                                             Precipitation - Annual
                                                                                             (mm) A1FI, Ensemble,
                                                                                             Medium Sensitivity.
                                                                                             (CLIMSystems & Climate
                                                                                             Risk 2009)

               1960-2000                      2030                           2050    2070

                                                                                             50 days
                                                                                             45
                                                                                             40
                                                                                             35
                                                                                             30
                                                                                             25
                                                                                             20
                                                                                             15
                                                                                             10
                                                                                             5
                                                                                             0

                                                                                             Figure 6. Average
                                                                                             no .days max temp
                                                                                             > 35ºC (annually)
                                                                                             A1FI, Ensemble,
                                                                                             Medium Sensitivity.
                                                                                             (CLIMSystems & Climate
                                                                                             Risk 2009)

                                                                                                                  7
               Moreton Bay Regional Council Climate Change Risk Assessment
Climate Risk
3 Methodology

The methods used in this report follow                              Crichton 2006). The risk triangle shows
 an amalgamation of risk frameworks                                 that the degree of risk is a function
 that are used throughout Australia and                             of three elements; Hazard, Exposure
 abroad. The framework of this report                               and Vulnerability. The size on the risk
 focuses on the three main elements of                              depends on the extent of these three
 risk, as defined by Crichton (1999) in the                         components and without all, the risk
‘Risk Triangle’ which is a useful starting                          does not exist. This framework’s
 point to build the framework for this                              simplicity lends itself to both simple
 report (Figure 8). The risk triangle has                           scoping of emergent risks as well as a
 a robust recognition in a broad range                              more comprehensive drilling down into
 of sectors including insurance, disaster                           each of the elements as time, resources
 management (Geosciences Australia                                  and data become more available.
 2007) and urban adaptation (Rolf &

                                                        exposure
                                                                                                              Figure 8. Crichton’s Risk
                                                                                                              Triangle (Crichton 1999).
                                                                               y

                                                            risk
                                                                              ilit
                                                                             rab
                                               ha
                                                zar

                                                                        lne
                                                   d

                                                                      vu

               THE RISK TRIANGLE

               1.   Risk is a potential loss, the occurrence, or the size of which, is uncertain.
               2.   Risk depends on hazard, vulnerability and exposure. If any one of those
                    elements is missing, there is no risk.
               3.   Hazard refers to the frequency and severity of an event or the severity of a
                    source of danger that may cause a loss (e.g. storm surge).
               4.   Exposure is the accumulated value and proximity of the subject matter (e.g.
                    number and value of houses within a storm surge risk zone).
               5.   Vulnerability measures the extent to which the subject matter could be
                    affected by the hazard (e.g. height of buildings from the ground level).
               6.   Subject matter is the life or health of people or animals, or the property,
                    data, or environmental assets that are under consideration. (adapted from
                    Crichton 2001, p.244)

                                                                                                                                          9
               Moreton Bay Regional Council Climate Change Risk Assessment
Climate Risk
The Risk Triangle model is used by                                  diagram below provides a framework of
Climate Risk Pty Ltd with its insurance                             the methods and inputs used to identify
clients and provides a simple way of                                a scoping assessment of MBRC’s
examining a complex issue. The                                      climate change risks.

                                                   •    Analysis of workshop results                                           Figure 9. Methods
                                                                                                                               used and their
                                                   •    Review of assets and expenditure
                                                                                                                               correlation to the
                                                   •    Review of Natural Disaster Assessment                                  risk triangle
                                                        (Granger 2008)
                                                   •    Review spatial information
                                                   •    Review statistical data

                                                                      exposure
                                                                                           y

                                                                             risk
                                                                                         ilit
                                                                                       rab
                                                            ha
                                                              zar

                                                                                     lne
                                                                 d

                                                                                    vu

               •    Review of recent climate change science                                     •   Analysis of workshop results

               •    Review of Australian and SEQ reports                                        •   Review statistical data
                    on climate change impacts                                                   •   Analyse survey findings
               •    Review of climate change maps for the                                       •   Assess adaptive capacity
                    SEQ region                                                                  •   Review potential confluence of risks
               •    Review of Commonwealth and State
                    regulations

                                                                                                                                                    10
               Moreton Bay Regional Council Climate Change Risk Assessment
Climate Risk
4 Hazards

                                                                    science behind climate change projections is
For this report a hazard is identified
                                                                    improving there is still a range of uncertainty.
as “a climate-change related event,
                                                                    There are twenty GCMs that are used
series of events or variation, or an
                                                                    throughout the world and each of these
action in response to these, which has
                                                                    have their own strengths and weaknesses for
the potential to result in a material
                                                                    climate change variables and spatial coverage.
economic, social or environmental loss”
                                                                    Further uncertainties arrive when the GCMs
(Climate Risk 2008).
                                                                    are downscaled to the regional level. However,
                                                                    as long as the uncertainties are recognised
For further clarification we present the                            GCMs provide a useful exploration into the
climate change hazards in three distinct                            possible future climate change scenarios.
themes of impacts; primary, secondary
and tertiary which are explained in detail
                                                                    Projections of climate change beyond
below (Figure 10).
                                                                    2030 are highly dependent on the
                                                                    global emissions pathway. At present
To identify primary climate change hazards                          the world’s emissions growth is about
specialists utilise projections from Global                         3.0% per year. This is well above the
Circulation Models (GCM). Although the                              A1FI (IPCC worst case) scenario of

                                                                               Primary Hazards (direct physical effects)
                                                                               examples:                                         Figure 10. Primary,
                                                                               1. Temperature                                    secondary and
                                                                               2. Precipitation                                  tertiary climate
                                                                               3. Drought                                        change hazards
                                                                               4. Wind                                           discussed in this
                                                                               5. Fire weather (increased bushfire conditions)
                                                                                                                                 report.
                                                                               6. Sea-level rise
                       Climate Risk
                                                                               7. Severe weather (e.g. hail and lightning)

                                                                               Secondary Hazards (regulatory) examples:
                                                                               1. Hazards from industry regulation
                                                                               2. Carbon constraints and markets
                                                                               3. Hazard mapping
                                                                               4. Building and infrastructure standards
                                                                               5. Insurance industry regulatory change

                                                                               Tertiary Hazards (social response) examples:
                                                                               1. Changing consumer demographics
                                                                               2. Changing consumer geographical distribution
                                                                               3. Changing consumer spending patterns

                                                                                                                                                       11
               Moreton Bay Regional Council Climate Change Risk Assessment
Climate Risk
2.5%. According to Garnaut (2008),                                  (Cai et al. 2005, Hennessy et al. 2006). As
the emissions trajectory for what                                   shown below, this increase can manifest
he describes as the Platinum Age is                                 itself in a range of ways.
projected to see global emissions
increase by 3.1% per year. As most
                                                                    Heatwave
current models follow the A2 scenario
(of 2% growth per annum) the IPCC                                   Probably the most significant
worst case scenario is looking more like                            temperature related hazard is the
being the new best case scenario.                                   change in return rate of extreme heat
                                                                    days (or heatwaves). The definition of
Primary Hazards                                                     a heatwave differs across the globe,
                                                                    but generally it “can be defined as a
                                                                    prolonged period of excessive heat.
Heat
                                                                    The difficulty in defining a heat wave
In general the climate of South East                                in Australia has been in establishing
Queensland (SEQ) is expected to                                     an appropriate heat index with an
become hotter and drier. It is also                                 acceptable event threshold and duration,
expected that SEQ will experience an                                and relating it to the climatology of
increase in the number of days over                                 the area under investigation” (BoM
35oC with less cold nights. By 2030 the                             2008). Heatwaves have caused more
average annual temperature in SEQ may                               fatalities than any other natural hazard
increase by 0.3oC - 1.6oC on 1990 levels                            in Australia (Granger & Haye 2000). In

                                                                                     0 - 13                       Figure 11. Map
                                                                                                                  highlighting a projected
                                                                                     14 - 26
                                                                                                                  number of days over
                                                                                     27 - 39                      35oC in 2070 (using
                                                                                     40 - 53                      SRES A1FI scenario and
                                                                                     54 - 65                      an ensemble of GCMs).
                                                                                     66 - 79                      The MBRC area is
                                                                                                                  projected to experience
                                                                                     79 - 92
                                                                                                                  up to 40 days over
                                                                                                                  35oC during this period
                                                                                                                  (CLIMsystems and
                                                                                                                  Climate Risk 2008).

                                                                                                                                             12
               Moreton Bay Regional Council Climate Change Risk Assessment
Climate Risk
SEQ, historical evidence suggests that                              the onset of climate change. Recent
the average recurrence interval (ARI) for                           science suggests that increased global
heatwaves is 5-6 years:                                             average temperatures may lead to
                                                                   “more intense, longer lasting, and/ or
Using a threshold for temperature that                              more frequent” heatwaves (Meehl
is within the top 5% of daily maximum                               & Tabaldi 2004, p.994). Heatwaves
temperatures for a continuous three-day                             can have serious human health
period in the South-East Queensland                                 ramifications, especially on the elderly
area, at least 18 heat wave events have                             and infirm. They can also place
been identified since 1899. (Granger &                              considerable strain on infrastructure,
Hayne 2000, p10.4)                                                  energy supply as well as increase
                                                                    livestock and crop losses (Granger &
This return rate may decrease (i.e.                                 Hayne 2000) (Figure 12).
heatwaves may occur more often) with

                                                                                                                          Figure 12. Influences
                                                                                                                          and effects of climate
                                                                                                                          change on human
                                                                                                                          health (McMichael
                                                                                                                          2003)

                                                                                 Modulating
                                                                                 influences                    Health Effects

                                                                                                       Temperature-related illness
                                                                                                              and death

                                             Regional                                                   Extreme weather-related
                                                                               Microbial
                                                                                                             health effects
                                             weather                         contamination
                                             changes                           pathways
                                                                                                       Air pollution-related health
                                        •    Heatwaves                        Transmission                        effects
                                                                                dynamics
               CLIMATE                  •    Extreme
                                                                                                         Water and food-borne
               CHANGE                        weather                              Agro-                         diseases
                                                                               ecosystems,
                                        •    Temperature                        hydrology
                                                                                                        Vector-borne and rodent-
                                                                                                             borne diseases
                                        •    Precipitation
                                                                             Socioeconomics,
                                                                              demographics              Effects of food and water
                                                                                                                shortages

                                                                                                      Mental, nutritional, infectious
                                                                                                        and other health effects

                                                                                                                                                   13
               Moreton Bay Regional Council Climate Change Risk Assessment
Climate Risk
3400                                                                                    35
                                                                                                                           Figure 13. Graph
                                         deaths
                                                                                                                           showing the correlation
                        3100             average max. temperature                                               30         between a heatwave
                                         (time lag 2 days)
    Number of deaths

                                                                                                                           in the Netherlands and
                                                                                                                           number of recorded
                        2800                                                                                    25
                                                                                                                     C
                                                                                                                     o
                                                                                                                           deaths (Munich Re
                                                                                                                           2007).
                        2500                                                                                    20

                        2200                                                                                    15

                        1900                                                                                    10
                               20   21       22     23     24     25      26      27   28     29    30     31

                                                                  Week

Bushfire                                                                    Westerling & Bryant 2008) (Figure
It is well documented that increased                                        14). Consequently, the negative social
temperatures are associated with                                            outcomes that may follow include loss
increased bushfire danger (William et                                       of property, damage to forests and
al. 2001; Hennessey et al. 2007; Pitman                                     wildlife, loss of life, loss of tourism,
et al. 2007). A recent Australian study                                     increased erosion due to watershed
predicted that under A2 emissions                                           damage, respiratory health problems,
scenario there could be a 100% increase                                     and a greater likelihood of business
in bushfire and grassland fires. The                                        disruption (Epstein & Mills 2006).
authors note the SEQ region as being
particularly “worrisome“(Pitman et al.                                         Human Health
2007, p.397). The increasing popularity
of rural residential living, as well as the                                 Temperature can also impact on
preservation of natural areas within                                        the health of humans. Increases
urban developments in SEQ, poses an                                         in temperature, especially during
increasing level of risk (Granger et al.                                    heatwaves, increase the incidence
2003).                                                                      of food and water borne illness. This
                                                                            comes from quicker spoilage of food
 In the US, bush fire models show that                                      (McMichael et al. 2006), decreased
if there is a significant increase of CO2                                   treatability of the water supply (Soh et al.
in the earth’s atmosphere, resultant                                        2008) and changes in the “distribution
impacts would include decreased                                             and activity of flies, cockroaches, and
fire containment, increased area                                            rodents” (IPCC 2001). As shown by the
at risk of burning, increased costs                                         IPCC (2001) “climate plays a dominant
for containment and, ultimately,                                            role in determining the distribution and
increased economic losses (Mills 2002;                                      abundance of insects and tick species”.

                                                                                                                                                     14
                       Moreton Bay Regional Council Climate Change Risk Assessment
Climate Risk
For the SEQ region it is anticipated that
increased temperatures may lead to a
shift in the range of disease harbouring
mosquitoes (e.g. Ross River fever) (Lyth
2005).

                                        70 000                                                   Figure 14. Correlation
                                                                                                 between large wildfires
                                                                                                 in California and
                                        60 000                                                   neighbouring states
                                                                                                 and average monthly
                                        50 000                                                   maximum temperature,
                                                                                                 1980-99 (Westerling and
                                                                                                 Bryant 2008).
                         Area burned    40 000
                           (hectares)

                                        30 000

                                        20 000

                                        10 000

                                            0
                                                    5      10     15         20   25   30   35

                                                           Maximum temperature (oC)

                                                                                                                           15
               Moreton Bay Regional Council Climate Change Risk Assessment
Climate Risk
Ground Level Ozone                                                                                        consolidation and removal of the natural
 Of particular concern in the urban                                                                       environment) and increased impervious
 environment are potential challenges                                                                     surfaces of the built environment absorb
 resulting from increased ozone levels.                                                                   and reflect more radiant energy than its
 According to the Royal Society (2008)                                                                    surrounding environment (Kolokotroni
‘ground-level ozone is a serious pollutant                                                                & Giridharan 2008). This leads to
 that affects human health, reduces crop                                                                  increased temperatures (compared to
 yields and damages natural ecosystems’.                                                                  surrounding environs) in the urban zone
There is a strong correlation between                                                                     (Figure 15).
 ground level ozone and temperatures
 above 32oC (IPCC 2001). As ground                                                                    The implications of the UHI effect can
 level ozone is a significant pollutant in                                                            lead to increased rates of human heat
 Australia, any increases in temperature                                                              stress and death (Devi 2006), reduced
 may see an increase in the associated                                                                productivity, increased water use
 health effects (Horton & McMichael                                                                   (Guhathakurta & Gober 2008), increased
 2003).                                                                                               energy use from air conditioners
                                                                                                      (Santamouris et al. 2007), as well as a
Urban Heat Island                                                                                     potential exacerbation of the other heat
                                                                                                      issues described above. According to
At the local level some areas of the built                                                            the IPCC (2007) heat related deaths in
environment contribute to the ‘urban                                                                  Brisbane for those over 65 years of age
heat island’ effect. The urban heat                                                                   could more than double (from 1115 per
island (UHI) effect is a phenomenon                                                                   year to 2300).
whereby the design (i.e. through

                                                       33                                                                                                Figure 15. An indicative
                                                                                                                                                         example of the
                                                                                                                                                         temperature differences
                     Late afternoon temperature (oC)

                                                       32                                                                                                between an urban area
                                                                                                                                                         and its surrounding
                                                                                                                                                         environment.
                                                       31

                                                       30

                                                            Rural   Suburban      Commercial   Downtown      Urban       Park   Suburban        Rural
                                                                    Residential                            Residential          Residential   Farmland

                                                                                                                                                                                    16
               Moreton Bay Regional Council Climate Change Risk Assessment
Climate Risk
Killer Heatwaves (Europe 2003)

                In August 2003 Europe experienced the warmest weather on record with
                temperatures up to 14oC above the average maximum temperature for
                ten consecutive days. More than 30,000 deaths are associated with the
                European heatwave, more than half of those in France. The heatwave
                highlights the vulnerability of the elderly and infirm to the impacts of above
                average maximum temperatures, with up to 80% of those who perished
                being over 75 years of age (Trigo et al 2005). The flow on effects of the
                heatwave was substantial with morgues and funeral parlours having to hire
                temporary staff and refrigerated buildings to manage the increased rate
                of deaths (Dorozynski 2003). The heatwave also was responsible for over
                US$12 billion in insured crop losses and over $US 1 billion in damage caused
                by bushfires (Schär & Jendritzky 2004). As Australia (and many parts of
                Moreton Bay) have an increasingly aging population, local councils will need
                to consider how the plan for anticipated increased frequency of heatwaves in
                our urban environment.

Roads
                                                                    including more frequent and intense
Extreme and increased average                                       coral bleaching and changes in species
temperatures also place a considerable                              distribution, abundance, phenology
strain on the built environment. For                                and physiology- the impacts are
roads, increased temperatures during                                hard to measure due to the complex
summer can prematurely crack the road                               interactions between species and
surface and damage its water proofing.                              the lack of comprehensive species
It is important to note however that road                           documentation (CSIRO 2007; Hughes
maintenance issues can also improve                                 2003).
for regions in northern and temperate
climates (Cechet 2007), due to less                                 Agriculture and Forestry
freeze-thaw events (IPCC 1997).
                                                                    These temperature impacts on the
Natural Environment                                                 natural environment also have large
                                                                    ramifications on agriculture and
The Australian Government Department                                forestry. While it is possible for
of Climate Change noted that rising                                 forestry to see better productivity (e.g.
temperatures have impacted Australian                               from increased CO2) and be used for
ecosystems and biodiversity. While                                  greenhouse gas abatement and local
some changes have been observed-                                    temperature control (Aussenac 2000),

                                                                                                                17
               Moreton Bay Regional Council Climate Change Risk Assessment
Climate Risk
it is also sensitive to a range of heat                             have significant impacts of the natural
related impacts, especially seedlings                               and built environment, especially in low
(DeYoe 1986). Other risks include                                   lying coastal regions.
increased number in pests, reduced
water availability and bushfire risks.                              Increased sea levels can have ecological
Similarly agriculture is exposed to heat                            impacts (e.g. through changing stream
through exposure to drought, reduced                                flow); economic impacts (e.g. through
water availability and heat stress on                               altered distribution of fisheries); and
equipment and livestock.                                            social impacts (e.g. through loss of
                                                                    sandy beaches) (Voice et al. 2006).
Sea Level Rise                                                      Furthermore sea level rise is expected
                                                                    to increase coastal flooding events, so
Sea level rise is perhaps the most                                  that “events that currently occur roughly
widely acknowledged climate change                                  once every 50 years might occur as
variable, especially in the media. The                              frequently as once or more per decade”
majority of sea level rise comes from the                           (Church et al. 2006).
thermal expansion of the ocean as the
global average temperatures increase                               These factors are important because
as well as melting glaciers and polar                               analysis indicates that coastal
ice sheets (IPCC 2007). Since 1900 the                              inundation is 50-100 times that of the
sea level has risen by 19cm (Hennesy                                predicted sea level rise, i.e. for every 1m
2007). At present sea levels are rising                             of sea level increase, the sea may claim
at approximately 3.1cm per decade                                   up to 100 metres of the foreshore (not
(3.1mm per year), this has increased                                including event based erosion). Hence
from the 1.8mm rate in the 1960s (Figure                            based on the less extreme IPCC sea level
12). The predictions of total future sea                            rise projections the current predicted
level rise range from 30cm to 2m by                                 sea level rise of 3-30 cm by 2040 and 9
the end of the century (IPCC 2007), with                           -88 cm by 2100 (IPCC 2007) could see the
current science anticipating the that the                           unprotected coastal foreshore retreat
probable range is between 80cm and                                  between 1.5 m - 30 m and 4.5 m – 88 m
2m (Pfeffer et al. 2008) (Figure 16). A                             respectively.
sea level rise of a few centimetres will

                                                                                                                  Figure 16. Sea level
                                                                                                                  rise since the mid 19th
                                                                                                                  Century (IPCC 2007).

                                                                                                                                            18
               Moreton Bay Regional Council Climate Change Risk Assessment
Climate Risk
Storms / Extreme Weather                                            rainfall (Department of Climate
Storms, also known as extreme weather                               Change 2008). Lightning strikes are
events, are a common occurrence in                                  also predicted to increase under
the Australian environment. According                               climate change by a factor of 1.4 for
to the Bureau of Meteorology (BoM                                   every degree increase in atmospheric
2008) “each year, on average, severe                                temperature (Mills 2005).
thunderstorms are responsible
for more damage (as measured by                                      A recent report that in SEQ “hail risk
insurance costs) than tropical cyclones,                            (hail-days per year) is projected to
earthquakes, floods or bushfires”. In                               increase in south-eastern Queensland
light of recent science it is anticipated                           by up to two days per year by 2030 and
that the intensity of these storms will                             four days per year by 2070” (Queensland
increase with a warming of Australian                               Department of Climate Change 2008).
average temperatures. The resultant                                 Hail damage is responsible for some
impacts would likely include an                                     of Australia’s largest single event
increase in disruption to key services                              insurance claims and as highlighted
such as electricity and transport,                                  by the Insurance Council of Australia
increased damage to infrastructure,                                 hailstorm are represent the highest
higher accident rates including road                                percentage of weather events (Figure
and aviation sectors, and increased                                 17).
outbreaks of post-event disease and
water-borne diseases from extreme

                                                                             Bushfire
                                                                              12%

                                                                                                              Figure 17. Percentage
                                                                                                              of Australian insurance
                             Tropical cyclone                                                 Flood           claims from natural
                                   32%                                                         8%             disasters (ICA 2007)

                                   Thunderstorm
                                       12%                                              Hailstorm
                                                                                          36%

                                                                                                                                        19
               Moreton Bay Regional Council Climate Change Risk Assessment
Climate Risk
9
                                                              Annual                                                             Figure 18. Graph
                                                   8          5 year average                                                     showing the increase
                                                                                                                                 occurrence of damaging
                        Damaging storms per year

                                                              Trend
                                                   7                                                                             storms.

                                                   6

                                                   5

                                                   4

                                                   3

                                                   2

                                                   1

                                                   0
                                                       1955     1965           1975           1985        1995

                                                                                  Year

Current Australian science predicts                                                   the NSW northern coast. As shown by
that climate change will see a southerly                                              the recent Garnaut Review if a category
movement of cyclones, as well as an                                                   3 cyclone was to hit the Gold Coast
increase in their intensity. As shown by                                              the damage to houses, businesses,
Leslie et al (2007, p.179) (Figure 19) it is                                          infrastructure and repercussions to the
projected that there will be an increased                                             national economy may be in the order
in the number of intense tropical                                                     of $25 billion (Garnaut 2008). According
cyclones along the Australian east coast                                              to Munich Re (2007) there has been a
with increasing numbers and severity of                                               marked increase in the number of global
impacts over southeast Queensland and                                                 windstorm catastrophes (Figure 20).

                                                                                                                                 Figure 19. A selection of
                                                                                                                                 model tropical cyclone
                                                                                                                                 tracks for the period
                                                                                                                                 2000-2050. The dashed
                                                                                                                                 lines are the control
                                                                                                                                 model tropical cyclone
                                                                                                                                 tracks, the full grey
                                                                                                                                 lines are the enhanced
                                                                                                                                 greenhouse gas model
                                                                                                                                 tracks (Leslie et al.
                                                                                                                                 2007).
                                                                                                                                 Queensland is exposed
                                                                                                                                 to numerous tropical
                                                                                                                                 cyclones per year - for
                                                                                                                                 more information on
                                                                                                                                 historical cyclone tracks
                                                                                                                                 visit www.bom.gov.au

                                                                                                                                                             20
               Moreton Bay Regional Council Climate Change Risk Assessment
Climate Risk
350
                                                                                                                                                                    Figure 20. Trend
                     Number of windstorm catastrophes

                                                                                                                                                                    highlighting the
                                                        300                                                                                                         increased occurrence of
                                                                                                                                                                    damaging windstorms
                                                        250                                                                                                         over the past three
                                                                                                                                                                    decades (Munich Re
                                                                                                                                                                    2003).
                                                        200

                                                        150

                                                        100

                                                        50

                                                         0
                                                              1980

                                                                     1982

                                                                            1984

                                                                                   1986

                                                                                          1988

                                                                                                  1990

                                                                                                           1992

                                                                                                                  1994

                                                                                                                         1996

                                                                                                                                1998

                                                                                                                                        2000

                                                                                                                                               2002

                                                                                                                                                      2004

                                                                                                                                                             2006
                                                                                                            Year

                                                        700
                                                                                                                                                                    Figure 21. Graph
                                                                                                                                                                    highlighting the
                                                        600
                                                                                    25% increase in peak wind                                                       nonlinear correlation
                                                                                    gust causes 650% increase                                                       between peak wind
                     % Increases in damages

                                                        500                               in building damages                                                       speeds and insurance
                                                                                                                                                                    losses (Hawker 2007).

                                                        400

                                                        300

                                                        200

                                                        100

                                                                 Under 20 knots     20-40 knots          40-50 knots      50-60 knots

                                                                                             Wind speed

                                                                                                                                                                                              21
               Moreton Bay Regional Council Climate Change Risk Assessment
Climate Risk
Precipitation                                                       more intense downfalls when they
                                                                    occur. Reduced rainfall, or number days
                                                                    between rainfalls can increase costs and
Australia is a dry continent. Any
                                                                    maintenance in the built environment
changes in precipitation are significant
                                                                    due to drying of soils affecting the
for human settlements and agriculture.
                                                                    foundations built infrastructure, through
According to the CSIRO, it is anticipated
                                                                    to reduced water affordability for
that South East Queensland will
                                                                    agriculture and environmental flows
experience an increase in the number
                                                                    (Figure 22).                                Figure 22. The range
of days between rainfall events and                                                                             of drivers (exacerbated
                                                                                                                by climate change)
                                                                                                                that place pressure
                                                                                                                on Australian water
                                                                                                                resources (Source DCC
                                                                                                                2008).

Flooding                                                            minute rainfall event can see a 1 in 100
With intense rainfall comes flood.                                  year flood event becoming a 1 in 17 year
Global flood catastrophes have                                      event.
increased over the past three decades
(Figure 23) and it is predicted to continue                         Over the past 40 years (since records
(especially with the onset of sea level                             were collected) the MBRC region has
rise and increased urban development).                              experienced five significant periods of
As shown by Hennesey et al (2006) a                                 flooding. According to the Bureau of
25% increase in the duration of a 30                                Meteorology (BoM 2008) ‘significant

                                                                                                                                          22
               Moreton Bay Regional Council Climate Change Risk Assessment
Climate Risk
350
                                                                                                                                                       Figure 23. Global flood
                                                                                                                                                       catastrophes have
                                               300                                                                                                     increased over the past
                Number of flood catastrophes

                                                                                                                                                       three decades.
                                               250

                                               200

                                               150

                                               100

                                               50

                                                0
                                                     1980

                                                            1982

                                                                   1984

                                                                          1986

                                                                                 1988

                                                                                        1990

                                                                                               1992

                                                                                                      1994

                                                                                                             1996

                                                                                                                    1998

                                                                                                                           2000

                                                                                                                                  2002

                                                                                                                                         2004

                                                                                                                                                2006
                                                                                                Year

flood events with major flooding were
reported in 1967, 1972, 1974, 1989 and
1991’ (Figures 24 and 25). In particular
the low lying regions of the Caboolture
District in MBRC are sensitive to flood
According to a recent study of natural
disaster risk in Caboolture the region
faces considerable flood risk with ‘at
least 110 sq km of the Shire exposed
to inundation at the 100 year ARI flood
level, at least 55.5 sq km of which is in
the Caboolture River and 46.3 sq km in
the Stanley River catchments’ (Institute
for International Development 2007, p.6).

                                                                                                                                                                                 23
               Moreton Bay Regional Council Climate Change Risk Assessment
Climate Risk
Figure 24. South Pine at Drapper Crossing Flood Peaks (BoM 2008).

                                   8

                                   7

                                   6
                                                                                                                              Major

                                                                                                                              Moderate
                Gauge height (m)

                                   5

                                                                                                                              Minor
                                   4

                                   3

                                   2

                                   1

                                   0
                                       1965     1970      1975      1980      1985       1990      1995          2000      2005

                                                                              Year
                                                                                                                                         Figure 24 and Figure 25.
                                                                                                                                         These graphs show that
                                                                                                                                         the MBRC region has
                                                                                                                                         experienced numerous
                                                                                                                                         major and moderate
                           Figure 25. Caboolture River Flood Peaks (BoM 2008).                                                           floods over the past 40
                                                                                                                                         years (BoM 2008).

                                   12

                                                                                                                              Major
                                   10

                                                                                                                              Moderate
                                   8
                Gauge height (m)

                                                                                                                              Minor

                                   6

                                   4

                                   2

                                   0
                                              1970     1975      1980      1985      1990       1995      2000      2005      2010

                                                                                  Year

                                                                                                                                                                    24
               Moreton Bay Regional Council Climate Change Risk Assessment
Climate Risk
Secondary Hazards                                                        to a low carbon future. It includes
                                                                         initiatives in: energy, industry,
Federal and State climate change                                         community, planning and building,
policies and regulations are being                                       primary industries, transport,
created at a rapid rate. In the past year                                adaptation, and government
the following significant Federal and                                    leadership’ (Queensland
State policies and regulations have been                                 Government 2008).
created and/or amended with respect to
climate change:                                                     •    ClimateSmart Adaptation Plan
                                                                        – ‘Queensland’s plan for increasing
Commonwealth                                                             our resilience to the potential
                                                                         impacts of climate change. Under
•              National Greenhouse and Energy                            the plan, government and business
               Reporting Act 2007 – this act is                          are required to consider the
               designed to support the collection,                       potential effects of climate change
               reporting and auditing of data by                         when they make decisions about:
               GHG polluters over a pre-define                           water planning and services,
               threshold. It is still ambiguous                          agriculture, human settlement,
               where Local Governments sit within                        natural environment and landscape,
               this act.                                                 emergency services and human
                                                                         health, tourism, business and
•           Mandatory Renewable                                          industry, finance and insurance’
            Energy Target 20 (MRET20)                                   (Queensland Government 2008).
           – Commonwealth’s commitment
            for 20% renewable energy by 2020                        •    SEQ Regional Plan Review 2009-
           (45,000 GW hours per year).                                   2031 – The latest review of the
                                                                         SEQRP has been brought forward,
•              Carbon Pollution Reduction                                and it has been widely reported
               Scheme (CPRS) – This is the                               that there will be a heavy focus
               Australian emissions trading                              on climate change mitigation and
               scheme. Companies who emit over                           adaptation.
               a predetermined threshold will have
               to purchase the right to pollute.                    •    SEQ Infrastructure Plan –
               These permits will be auctioned and                       Infrastructure plan supports the
               can be trading nationally.                                SEQRP review, will also consider
                                                                         climate change mitigation and
Queensland Government                                                    adaptation.

•              ClimateSmart 2050 – ‘establishes                     •    Planning Reform – there is a suite
               Queensland’s long term climate                            of anticipated changes to many of
               change goals and provides a                               Queensland’s planning instruments.
               platform for the Government,                              The reform agenda includes
               community and industry to move                            standardising planning schemes

                                                                                                               25
               Moreton Bay Regional Council Climate Change Risk Assessment
Climate Risk
and undertaking a risk-assessment                    The Queensland Government has
               approach to development                              attempted to embed adaptation
               applications. It is envisaged that                   to climate change in a number of
               many of the reforms will embed                       regulations and policies. At present
               climate change mitigation and                        there is a review of the South East
               adaptation.                                          Queensland Regional Plan (SEQRP),
                                                                    where it is anticipated that it will become
These new policies and policy changes                               the main mechanism for climate change
present a range of risks for Local                                  adaptation in the region.
Councils in three main areas:
                                                                    The current SEQRP provides some
                                                                    limited guidance to councils in regards
1.             Compliance - The enormity and                        to climate change adaptation. These
               speed of climate change specific                     include the following climate change
               policies create a substantial                        specific directions to:
               workload and cost for local
               governments to collate synthesise                    2.3.4 Assess the impact of potential
               and implement. Choosing to focus                     climate change in preparing planning
               on one policy over another (e.g.                     schemes and land use strategies.
               mitigation over adaptation) may see
               competition of resources and some                    2.3.5 Raise community awareness,
               measures being implemented more                      knowledge and understanding of air
               thoroughly than others.                              quality, greenhouse gas emissions and
                                                                    climate change impacts.
2.             Staffing challenges - there is
               a dearth of local government                         2.4.4 Ensure use and management of the
               professionals (such as planners                      coast provides for natural fluctuations in
               and engineers) and those with                        coastal processes, including storm tide
               climate change specific skills are                   inundation, climate change and sea level
               even scarcer. As all councils will                   rise.
               be responding to climate change
               policies simultaneously the cost                     Carbon Constraints
               of obtaining these key staff will
               increase substantially.                              The Commonwealth Government is
                                                                    committed to implementing a system to
3.             Regulatory Risks - changing policies                 reduce national greenhouse emissions
               also means changing regulatory                       under the Carbon Pollution Reduction
               risks from failure to comply,                        Scheme (CPRS) (currently scheduled
               litigation and planning challenges                   for 2011). This trading scheme is a
               (this will be discussed below in                     market based mechanism which aims
               further detail).                                     to reduce carbon pollution by creating
                                                                    a cap on total national greenhouse
                                                                    gas emissions across a wide range of

                                                                                                                  26
               Moreton Bay Regional Council Climate Change Risk Assessment
Climate Risk
You can also read