Finding Space. Assessing how planning responds to tiny houses for homeless populations
←
→
Page content transcription
If your browser does not render page correctly, please read the page content below
Finding Space.
Assessing how planning
responds to tiny houses for
homeless populations
Supervised Research Project
by Laura Furst

Submitted to
School of Urban Planning
McGill University
April 2017

Finding Space.
Understanding how planning responds to tiny houses for homeless populations

                    Supervised Research Project Report

                     Submitted in partial fulfillment of
                   the Masters of Urban Planning degree

                              by Laura Furst

                     Supervised by Ahmed El-Geneidy
                        School of Urban Planning
                             McGill University
                        Montréal, Québec, Canada

                                April 2017
EXECUTIVE SUMMARY

Although great strides have been made in reducing the homeless population in the United States, in January
2015 there were still over 549,000 people who were counted as homeless on one night. A variety of homeless
assistance responses exist, ranging from emergency shelters to supportive permanent housing. However the
response is not quick enough. In some cities, communities have taken it upon themselves to build tiny house
villages as a cost-effective and quick way to provide housing for homeless persons and families. Tiny house
villages are usually small neighborhoods of 30 to 200 dwellings that can range in size from 60 to 200 sq. ft.
Although communities are pursuing the model to address urgent homeless and housing crises, it is still unclear
from a sparse literature how well tiny house villages perform as a homelessness assistance and housing policy.
Nevertheless, several projects continue to be proposed nationwide and local planning agencies must continue to
respond. With these considerations in mind, the following research tries to answer:

To what extent do local planning practices facilitate unconventional affordable housing models such as tiny
house villages for homeless populations? This paper will not attempt to provide a comprehensive measure of
success for each village. Rather, as starting point for such discussions the report examines how tiny house
villages fit within the current housing and homeless assistance system, if they do at all. In order to understand
local planning’s response it is necessary to establish to what exactly planners are responding in each context.

Four cities and their respective tiny house villages in the Pacific Northwest region of the United States were
examined: Dignity Village, Portland, Oregon; Opportunity Village, Eugene, Oregon, Quixote Village, Olympia,
Washington; and Nickelsville 22nd and Union St. site, Seattle, Washington. The findings of this report were based
on information from in-depth interviews with village representatives and local government staff in planning or
social services departments.

Planners responded according to the political and social conditions of each case study. When political will was
cultivated and public support was rallied, the villages and their managing nonprofits were able to successfully
negotiate for allowances with building codes and zoning laws. In addition to facilitating the specific location of
each village, planning departments were found to have a broader role in developing policy that allows for tiny
house building forms for both the non-profit and for-profit housing sectors.

While trying to answer the main research question, it was found that there is some ambiguity in how tiny house
villages fit the traditional housing and homeless assistance systems. Only one village was found to closely fit a
formal category of housing within the federal homeless assistance system. Two were found to be linked to a form
of transitional housing and a fourth case is best described as an emergency response, not housing.

The villages are intentional communities, meaning that residents share a set of values which usually reflect self-
sufficiency, non-hierarchical structures, and peer support. It was found that this was a key feature of the model
that was facilitated by the villages’ built form.

Cities considering the use of tiny house villages for their homeless response strategy must take into account
their local regulatory environment, public support, current homeless services, and the goals they are trying to
meet. Accordingly, planners must understand the value that alternative housing forms like tiny house villages can
provide and be able to assess the model’s suitability for their local context.

                                                                                                        i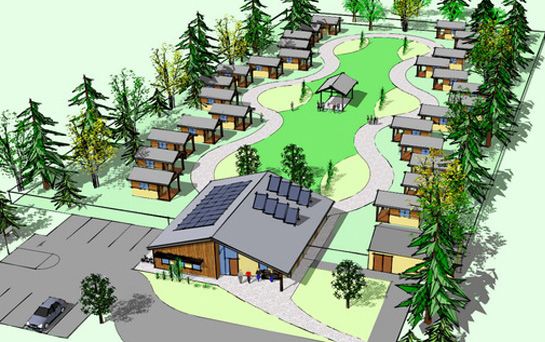
ACKNOWLEDGMENTS

First, I would like to thank my supervisor, Ahmed El-Geneidy, for his encouragement, patience, and support
throughout the development of this research project. I sincerely appreciate your dedication to your students and
your willingness to provide us with valuable learning experiences. I would also like to thank my second reader,
David Wachsmuth for delivering challenging and thought-provoking comments on this report, in a similar fashion
to his Urban Governance course where the idea for this research was first born.

This report would not have been possible without the information and opinions of village representatives,
residents, social service staff, planning staff, and nonprofit staff from Eugene, Portland, Olympia, Seattle, and
Vancouver, Washington.

Special thanks to fellow students with whom I commiserated throughout the wiring process. I am grateful for our
peer reviews and support sessions from which I learned a great deal.

Finally, thank you to my family, friends, and Jonathan. I would not be here if it were not for your love and support.

                                                                                                          ii
TABLE OF CONTENTS

i      Executive Summary
ii     Acknowledgments
iii    Table of Contents
iv     List of Figures and Tables
v      List of Acronyms
v      Ethics

1   1. INTRODUCTION
6   2. METHODS
6		         2.1 Methods
8		         2.2 Data
10  3.BACKGROUND
10		        3.1 Defining and Counting Homelessness
11		        3.2 Current Homeless Assistance System
12		        3.3 Current Housing Provision for the Homeless
13		        3.4 The Role of Municipalities
16		        3.5 Tiny Houses and Intentional Living
18  4. CASE STUDY PROFILES
18		        4.1 Dignity Village, Portland, Oregon
21		        4.2 Opportunity Village, Eugene, Oregon
23		        4.3 Quixote Village, Olympia, Washington
26		        4.4 Nickelsville 22nd and Union St. Site, Seattle, Washington
29		        4.5 Summary
30  5. FINDINGS AND DISCUSSION
30		        5.1 Physical and Built Environment
30			                5.1.1 Site Location
32			                5.1.2 Site Configuration
34			                5.1.3 Building the Villages
37		        5.2 Village Organization and Support
37			                5.2.1 Entry and Exit
39			5.2.2 Governance
41			                5.2.3 Social Services
42			                5.2.4 Community Support
44		        5.3 Villages in the Housing and Homeless Assistance Systems
51		        5.4 Planning Response
56  6. LESSONS LEARNED
61  7. CONCLUSION
61		        7.1 Limitations and Future Study
62		        7.2 Conclusion
64  8. REFERENCES
70      APPENDIX A

                                                                            iii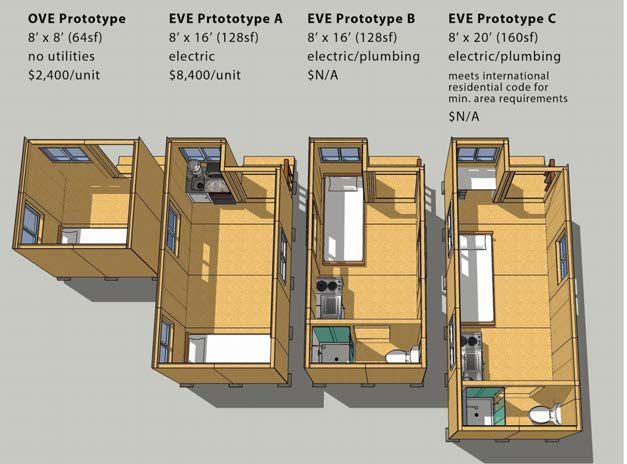
LIST OF FIGURES

1    1. Annual Homeless Population Count: United States
3    2.Tiny House Floor Plans from Opportunity Village Eugene (OVE)
4    3. Tiny House Villages for Homeless Populations (US)
7    4. Total Homeless Population Count: Washington and Oregon State
8    5. Research Process
18   6. Dignity Village
19   7. Multnomah County (Portland) Point-in-Time Count (2010-2016)
21   8. Opportunity Village
23   9. Lane County (Eugene) Point-in-Time Count (2010-2016)
23   10. Quixote Village
24   11. Thurston County (Olympia) Point-in-Time Count (2010-2016)
26   12. 22nd and Union St. Site
29   13. King County (Seattle) Point-in-Time Count (2010-2016)
32   14. Dignity Village Site Layout
32   15. Opportunity Village Site Layout
33   16. Quixote Village Site Layout
33   17. 22nd and Union St. Site Layout
44   18. Cost Burdened and Severely Cost Burdened Households (2009-2014)
49   19. Case Study Positions in the Housing System
51   20. Actor Participation throughout Village Implementation Process

     jghjg

     LIST OF TABLES

20   1. Portland-Vancouver-Hillsboro Metro Area Housing Statistics 2016
22   2. Eugene-Springfield Metro Area Housing Statistics 2016
25   3. Olympia-Tumwater Metro Area Housing Statistics 2016
27   4. Seattle-Tacoma-Bellevue Metro Area Housing Statistics 2016
29   5. Summary Population Statistics 2016
36   6. Summary Characteristics of Case Study Villages
46   7. HUD Habitability Standards for Emergency Shelters
55   8. Zoning Laws Pertaining to Tiny Houses

                                                                           iv
LIST OF ACRONYMS

ACS		         American Community Survey
ADU		         Accessory Dwelling Unit
CoC		         Continuum of Care
FEMA		        Federal Emergency Management Agency
HALA		        Housing Affordability and Livability Agenda
HUD		         U.S. Department of Housing and Urban Development
HMIS		        Homeless Management Information System
IBC		         International Building Code
IRC		         International Residential Code
LIHI		        Low Income Housing Institute
PIT		         Point-In-Time (Count)
SDC		         System Development Charges

ETHICS

Approval to conduct interviews was obtained from the McGill University Research Ethics Board I.
Interview questions can be found in Appendix A.
Reference #: 263-1116
Project Title of REB I Submission: Urban Planning and Homeless Housing Service Provision: a
Case Study through the Tiny Homes Movement

                                                                                            v

1. INTRODUCTION

The homeless assistance system in the United States has evolved from one that was initially

a reactionary crisis response executed by the Federal Emergency Management Agency

(FEMA) during the 1980s to the current system where the federal government engages local

stakeholders in strategic planning and research-based interventions. Targeted programming

for chronic, family, and veteran homelessness have led to a decline of these subpopulations. As

a result, the national homeless population has steadily fallen by 14% since 2007 (Henry, Watt,

Rosenthal, Shivji, & Abt Associates Inc., 2016). Despite an overall national reduction, in January

2015 there were still over 549,000 people who were counted as homeless on one night. Over a

third of these persons were unsheltered, living on the streets, in vacant lots, or in other locations

not fit for human habitation. While many Southern and Midwest states saw great decreases,

states such as Washington, Oregon, California, and New York continue to experience increases

in homelessness statewide that is concentrated in urban areas. (National Alliance to End

Homelessness, 2016).

            700,000

            600,000

            500,000                                                                                      549,928

            400,000
                                                                                                          373,571
            300,000

            200,000

                                                                                                          176,357
             100,000

                    0
                         2007     2008      2009     2010      2011    2012      2013     2014    2015        2016

                           Total Homeless Persons            Sheltered Persons          Unsheltered Persons

Figure 1. Annual Homeless Population Count: United States
          Source: U.S. Department of Housing and Urban Development

        Homeless issues and housing affordability are not one in the same. However, they

are linked by a concern for an individual’s ability to access stable housing which can affect

                                                                                                                     1
physical, mental, educational, and occupational outcomes for individuals. The national policy
response to homelessness has shifted from a “housing readiness” position which sets social
service prerequisites for individuals to access housing, to the Housing First philosophy which
emphasizes providing permanent housing to a person as soon as possible. This response
requires the production and management of different housing options to help provide for
the existing homeless populations and low-income households that are at risk of becoming
homeless. The federal government engages with local governments, nonprofit partners, and the
for-profit private sector to provide housing subsidies and units in order to meet communities’
needs.
By contributing over 25% of the country’s subsidized housing, the nonprofit sector is an
essential partner in the development of housing for homeless populations (Bratt, 2009). The
sector is also subject to a number of financial requirements and planning processes that delay
the construction of housing. Like other for-profit housing developers, nonprofits must incur
pre-development costs for site assessment, planning, and proposal formulation. Nonprofits
must also heavily invest in housing management and adhere to federal wage and habitability
standards if they are subsidized by the government. In light of these constraints, some
nonprofits around the country have produced innovative solutions such as the construction of
“tiny home” villages for homeless populations on shorter timelines and smaller budgets.
The tiny house movement has gained popularity in both the private and nonprofit housing
sectors because of the efficient nature of the homes’ design. The houses are typically no more
than 400 sq. ft. and no smaller than 100 sq. ft., serving as a low-cost means to home ownership
(Wyatt, 2016). These houses are environmentally sustainable in their compact design which
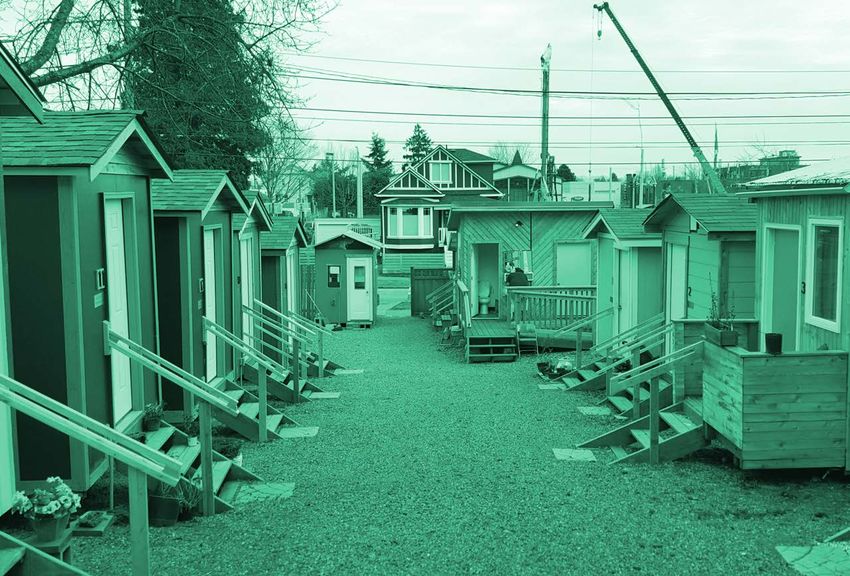
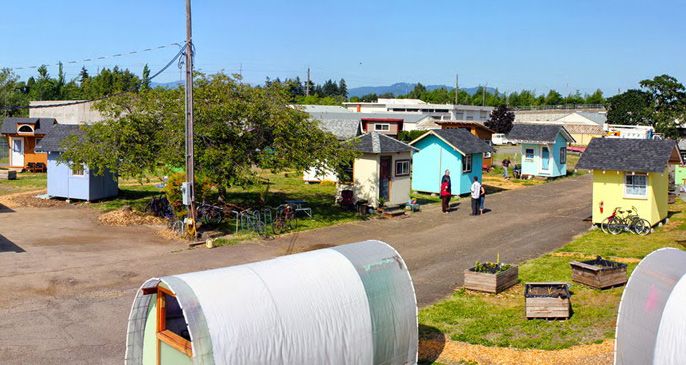
lowers their carbon footprint and demand for land (Mitchell, 2015). Nonprofits have used tiny
houses in pocket neighborhood configurations where homeless persons can live in a mutually
supportive and self-managing environment (Figure 2). This tiny house village model varies
greatly across sites in their histories, morphologies, funding, social service provision, and
community living models.
Although the federal government directs policy and funding, local governments
2have historically been at the forefront of responses to homelessness. Different cities have
simultaneously acted in both a castigating fashion through the criminalization of uses of public
space, and in non-punitive ways by providing more social and mental health services (Rosenthal
& Foscarinis, 2006). The adoption of tiny house villages as a formal strategy to address
homelessness is still a niche concept for many municipalities. Cities and counties have primarily
provided regulatory support and in some cases financial assistance through permit waivers and
grants to tiny house villages.
Figure 2. Tiny House Floor Plans from Opportunity Village Eugene (OVE)
Source: Tent City Urbanism
A characterization of the relationship between urban planners and tiny houses for
homeless populations specifically has not been examined. While planners are considered
practitioners who work on a variety of issues, much of their work becomes informed by other
“street-level bureaucrats” such as law enforcement officials, public administrators, and social
workers (Lipsky, 1980). Urban planners, in theory, continue to grapple with their positions
as conduits for strategic city building projects focused on urban growth, and as their role of
social “harmonizers” and channels for community engagement, especially with disadvantaged
groups (Marcuse, 2010). Provided that planners’ have a responsibility to expand opportunity
for all segments of the population (American Institute of Certified Planners, 2005), examining
the implementation process and after-effects of this form of housing that is geared towards
3the most vulnerable is an appropriate field of inquiry for the planning profession. With
increased media exposure in the past five years, more tiny houses are being built in the private
market in order to cultivate a more sustainable lifestyle and obtain an affordable means to
homeownership. In the nonprofit and public sectors of the housing market, tiny houses or
micro-units configured in a village setting have also continued to grow. Figure 3 shows the
communities that have already built or are in the process of developing tiny house villages
for their homeless populations. The greatest concentration of both built and planned villages
is in the west of the United States. As this report will show, tiny house villages for homeless
populations hold a more complex position in the current housing system beyond the binary
categories of transitional or permanent housing solutions to homelessness. Analyzing this
homeless assistance model’s place in the American housing system is necessary in order for
municipalities to understand under what capacity tiny house villages provide a practical solution
to a very complex housing problem.
Built Villages
Villages in Planning
Projection: USA Contiguous Albers Equal Area Conic USGS
Source: The Village Collaborative, US Census
Figure 3. Tiny House Villages for Homeless Populations (US)
¹
0 250 500 1,000 mi
Possibly
built due to the niche nature
0
of the 1,000
250 500
modelkm
and small number of available case
studies, information
planning about the performance of the tiny house village model is quite sparse. Cost
effectiveness is one measure of success claimed by villages like Eugene’s Opportunity Village
where $5 is needed to house a resident a night. This compares to studies produced by the
federal government on the nightly cost of emergency shelter housing being $14 to $61 in select
cities (U.S. Department of Housing and Urban Development, 2010). The literature does not
present any assessments on whether tiny house villages improve outcomes for their residents.
4This research will try to answer to what extent local planning practices facilitate
unconventional affordable housing models such as tiny house villages for homeless populations.
Due to the increased interest in the model, it is important to develop an understanding of how
planners can act to implement and evaluate these villages effectively. Planners encountering
tiny house village proposals in their communities are challenged by an absence of information
on what constitutes a successful tiny house village. Due to a limited sample size, this research
will not provide success measures. However it seeks to initiate a discussion about the model’s
position in the current homeless assistance and housing policy system in the United States
in order to show that perhaps not all cases can be measured against existing housing policy
tools. Characterizing the tiny house village model will also allow planners to understand to what
exactly they are responding, as it was found to be unclear at times throughout the interviews.
Four cities and their respective tiny house villages in the Pacific Northwest region of the United
States will be examined in order to answer these questions.
This research investigates local planning’s role when communities implement the tiny
house village model to fulfill their homeless assistance needs. As a very nascent model, tiny
house villages are best explored through in-depth case studies. In order to obtain both an
insider and outsider view of tiny houses in this context, we conducted several interviews and
used publicly available materials to form an analysis as described in the Methods chapter of
this report. Background on current homeless assistance and housing services is provided in
order to understand the landscape of existing services into which tiny houses might enter. This
is followed by a brief introduction of each village case study along with a socioeconomic profile
of the village’s corresponding city. The Findings and Discussion will show the limits of planners’
roles in the tiny house village model. It will also diagram how three of the four village models
do not fit within the federal framework of housing for homeless populations, but nevertheless
hold a unique utility for their communities. Lastly, some recommendations are provided for local
government officials, planners, or nonprofit staff who might consider the tiny house village
model in the future. Provided that a growing number of community groups and nonprofits are in
the process of planning tiny house villages, municipalities must understand their local needs and
think critically about adopting tiny house villages as a solution.
52. METHODS
2.1 Methods
The tiny house villages examined in this paper are located in the United States and include
Dignity Village in Portland, Oregon; Opportunity Village in Eugene, Oregon; Nickelsville 22nd and
Union St. site in Seattle, Washington; and Quixote Village in Olympia Washington. These cases
were selected based on the initial finding that all villages had some form of support from their
local governments, thereby making an assessment on planning’s role possible. All sites hold
contracts with their local governments for their locations.
As shown by Figure 3, four of the seven known built tiny house villages in the United
States are located in the Pacific Northwest region. As a majority of planned villages are also
concentrated on the west coast, concentrating on cases in this region could help inform future
projects in a context that seems to be more open to trying the tiny house model. The three other
existing tiny house villages are Second Wind Cottages in Ithaca, New York; Occupy Madison
in Madison, Wisconsin; and Community First! Village in Austin, Texas. A primary reason for
not including these sites was due to logistical limitations and time constraints in researching
for this study. These three cases could have offered insights not only based on more diverse
geography but also the nature of the nonprofits spearheading these projects. For instance none
of the villages in this study have an overt religious mandate in their mission, however the Ithaca
and Austin sites are both sponsored by Christian nonprofits. The Occupy Madison site is most
similar to the selected sites in that all built Pacific Northwest sites had some kind of affiliation
with the Occupy Movement either as a founding force or loosely by association. Ultimately the
selection was limited to villages in Washington and Oregon which are two states that have
experienced recent rises in homelessness (Figure 4). This enables comparisons of the planning
and development processes of two villages per state within their respective state social service
system.
In order to answer the primary research question of planning’s role in tiny house villages,
three different strategies were used to collect information for a comparative case study analysis
625,000
20,827
20,000
15,000
13,238
10,000
5,000
0
2007 2008 2009 2010 2011 2012 2013 2014 2015 2016
Washington Oregon
Figure 4. Total Homeless Population Count: Washington and Oregon State
Source: U.S. Department of Housing and Urban Development
of the four villages and their respective cities. As shown in Figure 5, these include seeking
expert opinions, making empirical observations through site visits, and examining various
publicly available materials. The interview responses and on-site observations are synthesized
for comparison between the four contexts. A functional conceptual framework is adopted
25,000
throughout this paper, where emphasis is concentrated on understanding the relationship
20,827
between municipal
20,000or county policymakers, city planning and human services departments, and
the nonprofit organizations and communities who have built the tiny house villages. Aspects of
15,000 13,238
the local regulatory and political environments in which municipalities and nonprofits operate
10730
10,000
will also be incorporated in the analysis in order to answer of why some communities have
adopted tiny houses in a particular manner.
5,000
3914
1451 audio-recorded
The primary source of information for this study comes from in-depth
0 586
2010 2011
interviews that were conducted 2012staff
with both 2013 2014
at tiny house2015 2016
villages and local government staff
Washington
between December 2016 and January 2017. AOregon Multnomah (Portland)
total of 11 interviews of 40 to 80 minutes were
Lane (Eugene) King (Seattle) Thurston (Olympia)
conducted. The six interviewees from tiny house villages ranged in their positions from program
managers to resident leadership board members who held duties that would be commensurable
to a paid staff position. These sessions with village staff aimed to better understand the
7perceptions of those intimately involved in the development, operation, and future planning of
their respective sites. All village interviews also included a site visit.
Primary
Research Question
How do urban planners Strategy Source Technique
facilitate the Individual In-depth
implementation of tiny Opinion Experts Interviews
house villages for
homeless populations?
FINDINGS &
DISCUSSION
Tiny House Site Visit
Empirical Villages Observations
Secondary
Research Questions CONCLUSION
What is being
facilitated? How can we Journals,
Secondary
characterize tiny Archival Codes
Sources
house villages for the
homeless?
Figure 5. Research Process
Five participating government staff worked at both county and municipal levels. Although
initial requests were made to interview city planners involved in housing and land use planning,
very few government interviews were conducted with the planning office. Instead, most
sessions with government staff were done with the human services or community development
department of a municipality. These professionals were found to be key actors in the planning
and development process of tiny house villages and were therefore able to speak on both social
services and the history of zoning changes for each site. In addition, zoning codes, building
codes, anti-homeless ordinances, social service plans, and city comprehensive plans were
used to form city profiles that informed the final analysis. Tiny house villages’ specific histories,
goals, public responses, and political action were also researched by reading local online news
sources, blogs, and grey literature.
82.2 Data
Interviews and local government documents are the chief data sources for this project, however
some mapping and basic sociodemographic variables were used in order to establish a profile
of each metropolitan context. The 2010 United States Census was used for basic demographic
data and the American Community Survey (ACS) 5-year estimates data set, selected for
housing and economic characteristics. The ACS is annually surveyed at a smaller scale than the
decennial census thereby providing data for government agencies to plan resource allocations.
The 5-year estimates were chosen because they are considered to be more precise due to a
longer survey time and larger sample size (U.S. Census Bureau, 2008). Geospatial data was
downloaded from federal, state, and municipal websites in order to provide context maps and
satellite imagery of each village’s surroundings.
Housing data was collected from the U.S. Department of Housing and Urban
Development’s (HUD) website. HUD publishes data based on microdata from the American
Community Survey and HUD’s adjusted median family incomes which are used to help local
governments calculate the number of households in need of housing assistance. This data
set is historically known as “CHAS data” because it was employed in local governments’
Comprehensive Housing Affordability Strategies (CHAS) that were submitted to the federal
government in order to determine which households are eligible for HUD’s programs. (Joice,
2014). The CHAS data was used in this report in order to show how and at what rates different
households are cost burdened in each case study city. Already analyzed data was also obtained
from housing affordability reports produced by the National Alliance to End Homelessness, the
National Low Income Housing Coalition, and from the HUD Exchange website.
93. BACKGROUND
The following section is designed to provide the reader with key concepts and processes
that will be used in discussing each case study. It provides a brief background on two areas:
homelessness and the tiny house movement. Homelessness has many dimensions found in the
literature of sociology, social work, economics, health sciences, and law. Researchers study two
kinds of causal factors of homelessness and their intersection: individual and structural factors
(Chapleau, 2010; Sosin, 2003; Sullivan, Burnam, & Koegel, 2000; Tsemberis & Eisenberg,
2000). Individual factors are those concerned with personal risk factors such as mental health,
substance abuse, work history, and social network dynamics. Structural factors such as housing
affordability, economic policy, and access to services may contribute to a person’s inability to
afford housing when other negative life events occur (Crane et al., 2005; Main, 1998). As urban
planners seem to play greater parts in the structural causes of homelessness such as housing
and economic policy, a brief subsection is included on municipalities’ roles in the criminalization
of homelessness and facilitation of affordable housing.
3.1 Defining and Counting Homelessness
The question of whom exactly agencies, governments, and communities consider homeless is
an important one, as it affects how policies are created and services are distributed. In 2015,
the U.S. Department of Housing and Urban Development (HUD) has clarified the definition of
“homeless” and “chronically homeless.” Someone who is chronically homeless is an individual
or family who lives in a place that is not safe for human habitation, or in an emergency shelter
on a continuous basis for at least a year or on four separate occasions in the past three years.
This person can be diagnosed with a mental condition, disability, chronic physical illness, or
a substance abuse disorder. A chronically homeless family may be one where the head of
the household meets all of these criteria. The definition of “homeless” is captured under four
circumstances: 1) individuals and families who do not have adequate nighttime residence or
a place fit for human habitation 2) those who may imminently lose their place of habitation, 3)
unaccompanied youth and 4) individuals and families who are fleeing life-threatening situations
10such as violence or sexual assault (U.S. Department of Housing and Urban Development 2015b).
The biggest changes of note to the statutory definitions is that it expands the situations under
which a person is considered homeless. (National Alliance to End Homelessness, 2012).
Communities collect data on their homeless populations in order to be eligible for federal
funding and plan their homeless assistance and housing responses. The annual Point-In-Time
Count (PIT) is a count conducted by local governments, nonprofit agencies, and volunteers on
a single night in January in cities and rural areas across the nation for sheltered and unsheltered
homeless persons (U.S. Department of Housing and Urban Development, 2015c). Sheltered
homeless persons are those who are temporarily living in emergency shelters, domestic violence
shelters, hotel voucher programs, and transitional housing at the time of the count, even if they
sleep on the street as well. Unsheltered persons are those counted in places not fit for human
habitation such as streets, parks, bus stops, doorways, vacant buildings, campgrounds, and
vehicles (U.S. Department of Housing and Urban Development, 2008).The PIT count is not
viewed as an accurate measure of homelessness because it depends on volunteers’ capacity to
access certain environments and identify homeless persons, thereby leading to undercounted
populations (Jocoy, 2012). This means that some individuals and families are not approached or
simply never contacted because they may be living in secluded areas, vehicles, or on a friend’s
couch (Gee, Barney, & O’Malley, 2017). Nevertheless, the data retrieved from this count and
data collected over the year from other homeless services through each region’s Homeless
Management Information System (HMIS) provide localities with some kind of estimates to track
their progress and make data-driven decisions.
3.2 Current Homeless Assistance System
As a source of primary funding for many communities, the federal government has the ability
to direct national priorities such as targeting certain subpopulations or adopting alternative
housing approaches (Schwartz, 2010). Homeless policy in the United States is currently guided
by the 2010 Opening Doors federal strategic plan to prevent and end homelessness which
identifies chronic, veteran, family, and youth homelessness as key areas to end and prevent.
In order to encourage more coordinated responses to homelessness, HUD has encouraged
11localities since the 1990s to apply for housing and homeless services funding as one regional
planning body known as a Continuum of Care (CoC). The CoC model is based on across the
board cooperation where efforts are focused on four key aspects: preventative outreach and
assessments services, emergency shelter provision and housing referrals, transitional housing
with support services, and permanent supportive housing that is long-term and meets the needs
of a diverse population (Jarpe, Ray, & Reed, 2015).
In Washington and Oregon, counties and regional governments tend to be the
designated lead agencies (Washington Department of Commerce, 2017). Lead agencies are
responsible for administering their annual Point-In-Time Count, creating a plan to address
homelessness, reporting data, and implementing coordinated entry. In cases where local
governments do not assume this role, the state then chooses a nonprofit to be a lead agency.
The lead agencies must subcontract with a network of nonprofits to provide services. They
therefore use Coordinated Entry to create a single point of entry for persons trying to access
services from multiple providers, which allows for more effective time and resource management
(U.S. Department of Housing and Urban Development, 2015b).
3.3 Current Housing Provision for the Homeless
Service providers can offer different methods of housing assistance for homeless individuals
and families on both the short-term and long-term basis. These include emergency shelter,
transitional housing, permanent supportive housing, permanent affordable housing and rapid
rehousing. Permanent supportive housing is a long-term housing option that enables persons
with disabilities, mental illness, or chronic substance abuse to live as tenants in the community
with access to supportive services. Whereas transitional housing is an interim place where
persons usually reside for up to 2 years before moving on to more independent living (Burt,
2006). Emergency shelters provide the first point of entry for persons who are immediately
homeless and need a temporary place to stay while searching for more permanent housing.
The latest amendments to the McKinney/ Vento Act made by the Obama Administration
in 2009 under the HEARTH Act (Homeless Emergency Assistance and Rapid Transition to
Housing) embody a shift in philosophy from the federal government in focusing on transitional
12housing to rapid re-housing with a Housing First approach (Schwartz, 2010). Housing First is
based on the premise that immediate and stable housing should be provided to persons without
the precondition of mental and physical rehabilitation, and by not imposing barriers for persons
with poor financial histories or criminal records. Studies on the economic, social, and health
benefits of the Housing First approach corroborate that this model saves money and improves
outcomes for chronically homeless individuals (Collins et al., 2010; Rosenheck, Krasprow,
Frisman, & Liu-Mares, 2003). It uses tools such as rapid-rehousing for immediate housing
in situations of crisis with tailored case management, rent and move-in assistance, and “just
enough” subsequent financial assistance. Rapid re-housing provides an immediate solution
allowing persons to search for more permanent housing while being supported. This method
helps reduce persons and families’ exposure to the negative effects of being without a home
(U.S. Department of Housing and Urban Development, 2015d).
The national shift towards Housing First is evident in the change of service capacity for
different types of housing for homeless populations. Nationwide, communities have increased
their homeless assistance capacity by providing more beds for permanent supportive housing
by 69.2% and emergency shelters by 25.1% (2007 to 2015). During the same time period, beds
for transitional housing decreased by 23.4% whereas rapid rehousing increased substantially by
203.9% from 2013 to 2015 (National Alliance to End Homelessness, 2016).
3.4 The Role of Municipalities
The new homelessness of the 21st century was born out of the social and economic conditions
of the 1980s, characterized by the dynamic of deteriorating inner cities and rapidly developing
suburban areas (DePastino, 2005). The abandonment of central urban areas and the ensuing
gentrification provided the stage for evictions and the demolition of low-cost options such as
SRO housing (single-room occupancy). The tone adopted towards homeless, poor, minority,
and female populations is one of disdain and fear in the revanchist city of the 1990s where
personal deviance is heavily emphasized over structural constraints as causes for poverty and
lack of shelter (Smith, 1996). As a result, homeless individuals were substantially criminalized in
various ways by their cities’ policies.
13Increased surveillance, policing, incarceration, and disproportionate enforcement
of laws continue to be used by law enforcement (O’Grady, Gaetz, & Buccieri, 2011). The
discretionary power of law enforcement is most visible with loitering or “sit-lie” ordinances
that prohibit persons from sitting, lying, or standing in particular areas under certain hours
or circumstances (Amster, 2003). Even cities’ physical form is designed with the intention
to discourage certain activities such as sleeping on benches and standing protected by bus
shelters (Flusty, 2001). The policies deployed by local governments seek to not only allay
community concerns for security but also present a reputable and clean image to booster
economic development (Mitchell, 1997). However to say that local governments continue to
employ only vindictive mechanisms to “cure” homelessness is no longer entirely correct. Murphy
argues that cities have entered a post-revanchist era where the full effects of gentrification
have begun to take place and more welfare oriented sensibilities are present (Murphy, 2009).
Municipalities now strive to develop compassionate support systems that also co-exist with
anti-homeless laws. This ambiguity of the supportive and the punitive is one that researchers
maintain must be further explored in the literature as the “messy middle ground” of homeless
service provision (May & Cloke, 2013).
Housing affordability is a structural risk factor of homelessness that many municipalities
have identified as a target area of improvement amongst other health and social services (Stone,
2006). Housing affordability is based on a ratio of income to housing expenses in order to
determine a household’s ability to pay for housing (Hulchanski, 1995). If a household spends
more on than 30%, it is considered to be cost burdened by its housing costs because it may have
to forgo other essential items such as food, transportation, and medical treatment. Housing
cost burdens are considered severe when they exceed 50% or more of annual income (U.S.
Department of Housing and Urban Development, 2015a). While national homeless rates are
declining, the number of cost burdened renters has risen to historic levels (11.4 million) not only
for the lowest income households but moderate income renter households in high-cost markets
as well (Joint Center for Housing Studies of Harvard University, 2016). Minority households and
the lowest income households that are employed through part-time and minimum-wage jobs
face severe housing cost burdens in greater proportion (Ault, Sturtevant, & Viveiros, 2015).
14Municipalities have traditionally influenced the location, quantity, and quality of
low-income housing through zoning ordinances and building codes, however the federal
government’s retrenchment has made local governments also take charge of developing and
managing housing as well. The most common ways in which states and municipalities fund
housing production are through federal block grants, tax-exempt bond financing, housing
trust funds, rent regulations, tax abatements, tax increment financing, and inclusionary zoning
(Schwartz, 2010).
Aside from inclusionary zoning, the role of municipal land use and zoning regulations
in molding the supply of affordable housing is not yet widely established. A limited number
of studies have been conducted focusing more on income or sociodemographic segregation
and land use, rather than affordable housing specifically (Aytur, Rodriguez, Evenson, Carellier,
& Rosamond, 2008; Lens & Monkkonen, 2016; Rothwell & Massey, 2010). Exclusionary
zoning practices which have been well-studied in the past are not as blatantly exercised as
they were fifty years ago. However, they have re-emerged to an emboldened state with even
more extreme displacement tactics that are legitimized in the name of municipal economic
development policies. In an exploratory study, Pendall has argued that zoning for single-
family only areas, caps on permitting, and limitations on city growth boundaries contribute to
a “chain of exclusion” whereby there is a shift to less housing production. The housing that is
being produced is constrained by land use regulations to be single-family. Therefore it does
not provide for renters but instead could reduce rental affordability because of the dwindling
multifamily housing supply (Pendall, 2000). Single-room occupancy units (SROs), micro
units, accessory dwelling units, eco-villages, and work-live housing that could contribute to
improving housing affordability end up being vilified for falling outside of norms for minimum lots
sizes, minimum number of parking places, and strict uses etc. (Hoch, 2000). However if urban
planners are obliged to “seek social justice by working to expand choice and opportunity for
all persons” (American Institute of Planners, 2016) they must also acknowledge that a range of
unconventional housing currently does exist and that they have the ability and duty to provide a
vehicle for zoning regulations to be transformed on the basis of community needs, and not vice
versa.
153.5 Tiny Houses and Intentional Living
According to tiny house advocates, to describe the housing problem in terms of only access and
supply of affordable housing is a shallow assessment (Heben, 2014). The lack of affordable
housing is tied to the inaccessibility of the spacious American dream home and vast backyards.
In 2015, the average size of a new home in the United States reached a record high of 2,467
square feet which is over a 1,000 square foot increase from newly built homes in 1973 (1,660 sq.
ft.). This constitutes an increase of living space per person in the United States from 507 to 971
square feet (Perry, 2016).
Reaching at least 30 years back, tiny house advocates have steadily grown a national
movement that espouses environmental sustainability, minimalism, self-sufficiency, and
independence from homeowner debt. However it is within the last 10 years or so that this
movement has gained national prominence with a whole supporting industry of trade shows,
online guides, organizations, and television programs. There are many websites that provide
future tiny house builders with a wealth of knowledge on building plans, utility hookups,
navigation of building codes, and simple living tools.
Depending on whether the houses are built by the owner or bought from a contractor,
tiny houses in the for-profit market can be built cheaply for as little at $6,000 and up to
$40,000 or more (Tiny House Talk, 2014). Tiny houses may be placed on a foundation as an
accessory dwelling unit or they may be parked on a trailer in order to skirt building codes with
minimum space requirements. In terms of amenities, many private houses include cooking and
restroom facilities within the unit. Different utility hookup arrangements exist ranging from on-
site permanent or semi-permanent water and sewer connections to off grid hookups that use
rainwater collection, greywater draining, composting toilets and solar panels.
Tiny houses are an inexpensive housing option not only for persons wanting to downsize
but also for nonprofits and community groups that provide low-cost housing (Mitchell, 2014).
Tiny houses provided for homeless populations can be organized in a village model where each
unit does not typically have full kitchen and restroom amenities. Instead, a centralized area for
washing, cooking, and recreational activities is set for collective sharing of resources. The tiny
16house villages for homeless populations examined in this report tend to be characterized by
an intentional living model. Intentional communities are typically out of mainstream society’s
concept of housing because they are usually formed by individuals who share an ideology or
value. They can take the form of communes, housing cooperatives, religious housing, eco-
villages, and co-housing facilities (Sanguinetti, 2012). The physical design of these communities
helps facilitate their activities such as communal meals, social gatherings, and open play for
children.
The communal intentional living arrangement of the tiny house villages in this paper
is perhaps linked to the model’s roots in self-organized and self-managed tent cities. As
informal shelter solutions that are frequently most visible in the city’s liminal spaces, tent cities
are disparaged due to their lack of water and sanitation, use of public land, trash disposal,
and the perceived deviance of their residents (Herring, 2014). Although society places a high
value on individuals’ participation and belonging to the greater community, when intentional
self-sufficient communities are formed in the most desperate of conditions, these living
configurations are considered degenerative and non-contributing. While these are worrisome
living conditions, researchers have begun to note that these communities have lessons for
alternative housing on adaptability, safety, and community living (Heben, 2014; Loftus-Farren,
2011). In reconciling the fact that housing assistance systems are unable to provide enough
shelter and support services, many municipalities have opted to sanction some tent cities and
provide on-site support services or choose not to enforce anti-camping ordinances. All of the
villages in this research have their roots in intentional tent city communities. Each city has a
public camping ordinance in place, however arrangements for sanctioned camping space or
city-run programs have been allowed as exceptions.
174. CASE STUDY PROFILES
The following section seeks to provide a brief introduction to each village case study but focus
on the profile of their urban contexts in order to establish each location’s specific challenges and
responses concerning homelessness. More in-depth details about the villages will be provided
in the Findings and Discussion chapter of the report. Information regarding the villages was
obtained through interviews, however all city and county specific information was taken from
local government department websites, online newspapers, and the United States Census.
4.1 Dignity Village, Portland Oregon
Washington State
Portland
Multnomah County
0 2.5 5 0 0.05mi
10 0.1 0.2 mi
0 2.5 5 10 km ¹
Projection: NAD 1983 UTM Zone 10N
Oregon State
Source: US Census, State of Oregon
Figure 6. Dignity Village
0 2.75 5.5 11 mi
0 2.75 5.5 11 km ¹
Located in Portland, Oregon, Dignity Village is the longest operating tiny house intentional
community for homeless individuals in the country. In December of 2000, Camp Dignity was
established on vacant public land under a bridge by a group of homeless persons as part of
the “Out of Doorways” campaign formed in the aftermath of Portland’s anti-camping ordinance
being overturned (Roots, 2009). Camp Dignity’s organized efforts to create a self-governed
and safe community eventually led to the formation of the Dignity Village nonprofit corporation.
After multiple camp evictions, Dignity Village came to an agreement with the city to temporarily
move to a sanctioned location in the industrial area of Sunderland Yard in Northeast Portland.
Despite this move, Dignity Village still faced a precarious existence with mixed public opinion
18and concerns for building and health code enforcement. The city eventually designated the
Sunderland Yard site as a “transitional campground housing” under an obscure transitional
accommodation state statute in 2004 (Heben, 2014).
The timing of Dignity Village’s establishment coincides with a specific set of
socioeconomic and political conditions in the city of Portland. It was during this time that
Portland and Multnomah County endeavored to create the area’s first 10-year action plan to end
homelessness. Multnomah County, Portland, and the city of Gresham have since partnered to
create a third updated comprehensive plan called “A Home for Everyone” that concentrates on
providing every person in the region with a home. The plan focuses on increasing entries into
permanent housing, investing in more emergency shelters, and strengthening system capacity
for coordination of services. The plan also has a unique emphasis on racial and ethnic justice.
Minorities such as African Americans are overrepresented in homeless populations, composing
24% of homeless persons but only 7% of the general county population (Multnomah County,
2017). Multnomah County provides community-based services for families, substance abuse,
child assistance, and poverty alleviation while the city of Portland is responsible for homeless
adults and affordable and public housing.
5000
4500
4000 3914
3500
3000
2500
2027
2000
1887
1500
1000 1053
500
0
2010 2011 2012 2013 2014 2015 2016
Total Sheltered Unsheltered Chronically Homeless
Figure 7. Multnomah County (Portland) Point-In-Time Count (2010-2016)
Source: U.S. Department of Housing and Urban Development
19The city of Portland has responded to housing affordability concerns through many
mechanisms. At the state level, the city has aggressively sought lifting of the statewide ban
on inclusionary zoning, and is now developing its mandatory inclusionary zoning program to
boost the production of affordable units. The city’s 2035 Comprehensive Plan provides housing
goals including fomenting housing preservation, developing workforce housing, building
regional cooperation and balance, increasing renter protections and responding to social
isolation (City of Portland, 2016). The Portland community voted in November 2016 for its first
affordable housing bond of $258 million. It is estimated that this will allow for the production of
an additional 1,300 units of affordable housing. Other forms of revenue have also been adopted
within in the last year such as obtaining portions from tax increment financing renewal zones
and a small construction excise tax. In order to address the current state of homelessness, the
city has prolonged its one year state of emergency from 2015 to 2016 for another year and has
consolidated the city and Multnomah county offices for the Joint Office of Homeless Services in
order to streamline the delivery of support services (Portland Housing Bureau, 2016).
Planning for affordable housing is certainly a challenge in a city where the population
has grown by 8.3% almost double the national average from 2010 to 2015 (U. S. Census Bureau,
2015). The permitting levels have reached a 15 year high in Portland, with 700 permits for single-
family homes and 4,000 permits for multi-family homes being issued in 2015 (Portland Housing
Bureau, 2016). In addition, rental vacancies at 2.9% in 2016 (U.S. Department of Housing and
Urban Development, 2016a). Although these conditions do not exert any real estate pressures
on Dignity Village’s specific operation, they provide reasons for why housing nonprofits are
constrained in building in a tight market and why less costly housing types such as tiny houses
are attractive options.
Table 1. Portland-Vancouver-Hillsboro Metro Area Housing Statistics 2016
Source: U.S. Census and the National Low Income Housing Coalition
Table 2. Portland-Vancouver-Hillsboro Metro Area Housing Characteristics
Annual
Median 2 Bedroom Income
% Renter
Population Household Apartment Needed to
Households
Income (USD) FMR Afford 2 BR
FMR
Portland 1,864,574 60,217 1,208 48,320 40%
Oregon 4,028,977 51,243 1008 40,318 38%
204.2 Opportunity Village, Eugene, Oregon
Oregon State
Eugene
0 2.5 5 10 mi
0 2.5 5 10 km ¹
Projection: NAD 1983 UTM Zone 10N
Lane County Source: US Census, State of Oregon
Figure 8. Opportunity Village
Born out of a settlement from the Occupy movement in 2011, Opportunity Village Eugene has
evolved with the support of persons outside the homeless community since its beginning. After
the Occupy encampments were closed, the city convened a taskforce to find housing solutions
for the unhoused from the former settlement. The order from Mayor Kitty Piercy was to find
several sites that could be run by independent nonprofits for secure sleeping. In addition to
recommending the development of an urban rest stop program where persons could sleep at
designated locations under nonprofit management, the creation of a tiny house village was also
proposed. Opportunity Village opened its doors in 2013 as a transitional microhousing village
for homeless persons in a city-owned lot in the heavily industrial area along. It is zoned as a
conditional use for a homeless shelter.
In less than five years, Opportunity Village has successfully grown the site while
evolving as an organization. Although now called Square One Villages, Opportunity Village
secured 501(c)3 status early on. Square One Villages has also developed an online Toolbox for
prospective nonprofit tiny house village builders and operators and provides consulting services
to communities seeking to establish a village. Square One Villages is coordinating a follow-up
project by developing a permanent micro-unit village, Emerald Village Eugene.
Like many communities around the county, Eugene’s public resources for affordable and
21low-income housing are limited therefore housing nonprofits like Square One Villages are
crucial. Outside of Lane County funding, Eugene also cooperates to offer unique programs
through the city and in partnership with nonprofits and religious charity organizations. For
instance, although Eugene has limited the parking of vehicles for extended periods of time, the
ordinance allows for religious and nonprofit organizations to host parked vehicles with restroom
services on site under the Homeless Car Camping program. The city and the county have also
launched a RestTable
Stop2.pilot
Portland-Vancouver-Hillsboro
program where up to 20Metro Areaare
people Housing Characteristics
permitted to sleep in tents at six
Annual
designated city and county sites, or property owned by the Eugene Mission. Nonprofits are
Median 2 Bedroom Income
% Renter
responsible for the operation of the
Population rest stops and
Household residents must
Apartment agree to to
Needed certain rules that
Households
Income (USD) FMR Afford 2 BR
include a zero tolerance for violent behavior, drugs, or alcohol. The success
FMR
of these types of
initiatives is stillPortland
under evaluation
1,864,574as the city council is currently
60,217 1,208 discussing
48,320 whether
40%or not to
extend these programs
Oregon 4,028,977
in some 51,243
form or another 1008 Being a 40,318
(Hill, 2017). 38%
small college town, Eugene
has also responded with housing affordability programs targeting renters which make up 41% of
households and student populations.
Table 2. Eugene-Springfield Metro Area Housing Statistics 2016
Table
Source: U.S. Census and3.
theEugene-Springfield Metro
National Low Income Housing Area
Coalition Housing Characteristics
Annual
Median Income
2 Bedroom % Renter
Population Household Needed to
Apartment FMR Households
Income (USD) Afford 2 BR
FMR
Eugene 357,060 44,103 909 36,360 41%
Oregon 4,028,977 51,243 1008 40,318 38%
Over a third of the 1,451 homeless persons counted in Lane County during their annual
point-in-time count were chronically homeless (Figure 9). Another population that has
Table 4. Olympia-Tumwater Housing Characteristics
increased on a statewide level is the number of homeless studentsAnnual
in the public school system
Income
Median
2 Bedroom Needed to % Renter
(Roemeling, 2016). Between
PopulationEugene and its neighboring
Household city of Springfield, 1616 homeless
Apartment FMR Afford 2 BR Households
Income (USD)
youth were reported through three school districts in 2014. For these
FMR reasons, Lane County is
not only investing
Olympia in Housing
261,723 First units like other communities,
61,677 1,021 but40,840
also making35%
substantial push
Washington 7,170,351 61,062 1,203 48,119 37%
for crisis services and over 300 more emergency shelter beds and services for individuals and
families (Lane County, 2016). Although the county provides anti-poverty and housing services,
Table 5. Seattle-Tacoma-Bellevue Housing Characteristics
22
Annual Income
Median
2 Bedroom Needed to % Renter
Population Household
Apartment FMR Afford 2 BR HouseholdsYou can also read