Measuring our sustainability progress: New Zealand's new detached residential housing stock (first update) - SR426 2019 Study Report - Branz
←
→
Page content transcription
If your browser does not render page correctly, please read the page content below
Study Report SR426 [2019]

 Measuring our sustainability
 progress: New Zealand’s new
 detached residential housing
 stock (first update)
 Roman Jaques
1222 Moonshine Rd, RD1, Porirua 5381 © BRANZ 2019
Private Bag 50 908, Porirua 5240 ISSN: 1179-6197
New Zealand
branz.nz
Study Report SR426 Measuring our sustainability progress: New Zealand’s new detached residential
housing stock (first update)

Preface
This is the second report of an ongoing longitudinal study on key sustainability-related
aspects concerning new New Zealand detached housing consented in the 2016
calendar year. It covers a range of core indicators grouped into eight domains: energy
and CO2, water, indoor environment, resilience, affordability, consumer demand,
industry capacity and policy and regulation. It provides a breadth of information over
three thematic areas: building performance, market forces and governance. Although a
stand-alone document, its predecessor BRANZ Study Report SR342 should be read
prior to or concurrent with this first update for best comprehension.

Acknowledgements
This report is reliant on the generosity of Auckland, Hamilton City and Christchurch City
Councils’ building consent and controls departments. They provided the building
consent-related information that underpinned a considerable amount of the
performance-related analysis at either heavily discounted or no cost.

Thanks also to the project’s advisory group – their input is greatly appreciated:

• Vicki Cowan (Beacon Pathway) representing researchers and facilitators for positive
 change in the residential building environment.
• Heidi Mardon (Toimata) representing environmental building designers and
 educators.
• Nikki Buckett (ex MBIE) representing central government and building
 technologists.
• Ian Mayes (ex Hamilton City Council) representing the Eco Design Advisor network.

Also thanks to James Sullivan, PhD candidate at Victoria University, Wellington, who
undertook the considerable thermal simulation work and Lesley Smith, Principal Data
Scientist, Water New Zealand, for assisting with the water management section.

The following BRANZ experts provided targeted assistance in their specialist topics:

• Nick Brunsdon (economic indexes)
• Dr David Dowdell (building material embodied carbon)
• Dr Casimir MacGregor (social-based indicators)
• Amber Garnett (collating industry-specific and local government-specific initiatives).

This document relies on – and in many cases builds upon – data and indicators
suggested by the research consortium Beacon Pathway on the need for a national
housing indicator framework for New Zealand in 2008.

 i
Study Report SR426 Measuring our sustainability progress: New Zealand’s new detached residential
housing stock (first update)

Measuring our sustainability
progress: New Zealand’s new
detached residential housing
stock (first update)
BRANZ Study Report SR426
Author
Roman Jaques

Reference
Jaques, R. (2019). Measuring our sustainability progress: New Zealand’s new detached
residential housing stock (first update). BRANZ Study Report SR426. Judgeford, New
Zealand: BRANZ Ltd.

Abstract
This report examines New Zealand’s new-build residential (stock) sustainability aspects
as part of an ongoing BRANZ longitudinal study. The long-term objective is to assess,
benchmark and track trends of the performance and influencers on new detached
housing. Three overarching themes – building performance, market forces and
governance – are examined to provide a snapshot summary of impactors. Eight
domains are covered under these themes: energy and CO2, water, indoor environment,
functional resilience, affordability, consumer demand, industry capacity and policy and
regulation. Each domain has a set of individual indicators and metrics used to provide
quantitative and qualitative information so that trends can easily be tracked.

This second report (i.e. the first update) in the series focuses on the calendar year
2016, comparing those results with the calendar year 2012 findings. Although this
study report is a stand-alone document, its predecessor BRANZ Study Report SR342
(Jaques, 2015) should be read prior to or concurrent with this first update for best
comprehension.

Keywords
New Zealand housing stock, house metrics, sustainability indicators, detached houses,
benchmarking, thermal performance.

 ii
Study Report SR426 Measuring our sustainability progress: New Zealand’s new detached residential
housing stock (first update)

Contents
GLOSSARY OF TERMS ...................................................................................... 1
EXECUTIVE SUMMARY ..................................................................................... 2
1. INTRODUCTION ....................................................................................... 4
2. BACKGROUND.......................................................................................... 6
3. METHODOLOGY ....................................................................................... 7
 Introduction ..........................................................................................7
 Changes to core indicator metric set (from Y2012) ...................................7
 Extending social-based indicators ............................................................8
 Analysis of changes in homes’ performance attributes ..............................9
4. INTERPRETATION.................................................................................. 11
 Yardstick applied and analysis ............................................................... 11
5. RESULTS ................................................................................................ 12
 Energy use for active space conditioning ............................................... 12
 CO2 emissions for water and space heating ............................................ 13
 Potential of site for harnessing solar energy ........................................... 16
 Whole-house resource efficiency ........................................................... 18
 Household water-saving devices and consumption ................................. 21
 Comfortable indoor temperatures in a key occupancy zone ..................... 22
 Healthy indoor temperatures in a key occupancy zone ............................ 24
 Proximity to key amenities and public transportation .............................. 25
 Inclusiveness of universal design features .............................................. 27
 Climate change implications on indoor thermal comfort .......................... 28
 Housing affordability and cost of key enviro-features .............................. 28
 Demand for key sustainability features and services ............................... 32
 Supply of some key sustainability-related services .................................. 37
 Supportive government policy and regulation ......................................... 41
6. SUMMARY AND RECOMMENDATIONS ................................................... 44
 Summary and discussion ...................................................................... 44
 Recommendations................................................................................ 46
REFERENCES .................................................................................................. 50
APPENDIX A: EMBODIED CO2 IN BUILDING MATERIALS .............................. 55
APPENDIX B: MODELLING CLIMATE CHANGE-INFLUENCED WEATHER........ 57
APPENDIX C: SPACE HEATER EFFICIENCIES AND CO2 EMISSIONS .............. 58
APPENDIX D: WATER USAGE CAVEATS ......................................................... 60
APPENDIX E: GLAZING CALCULATION .......................................................... 61
APPENDIX F: RECESSION PLANE MINI STUDY ............................................. 62
APPENDIX G: THERMAL MODELLING CALCULATION .................................... 66

 iii
Study Report SR426 Measuring our sustainability progress: New Zealand’s new detached residential
housing stock (first update)

Figures
Figure 1. Relationship between three thematic areas and their associated domains......7
Figure 2. Annotated snake diagram to assist interpretation. ..................................... 11
Figure 3. Space heating/cooling energy use by area, household and occupant. .......... 12
Figure 4. Comfortable living area daytime temperatures for Christchurch houses. ...... 23
Figure 5. Overheating severity in main living room for the Christchurch houses. ........ 24
Figure 6. Critically cold living room daytime temperatures for Christchurch houses..... 25
Figure 7. Respondents’ perception of the last house they worked on. ....................... 46
Figure 8. 3D layout and worst theoretical recession wall – Auckland. ........................ 63
Figure 9. Uncomfortably cold in Auckland. .............................................................. 63
Figure 10. 3D layout and worst theoretical recession wall – Hamilton. ....................... 63
Figure 11. Uncomfortably cold in Hamilton. ............................................................. 64
Figure 12. 3D layout and worst theoretical recession wall – Christchurch................... 64
Figure 13. Uncomfortably cold in Christchurch. ........................................................ 65

Tables
Table 1. Key findings from the eight domains summarised. ........................................3
Table 2. Summary of indicators and metrics for stand-alone homes (for Y2016). .........5
Table 3. Indicators and main metric changes made. ..................................................8
Table 4. Christchurch space heating energy intensity metrics – Y2012 versus Y2016. . 10
Table 5. Key statistics examining household energy for Christchurch homes. ............. 13
Table 6. Household water heating-related CO2 emission statistics. ............................ 15
Table 7. Household space heating-related CO2 emission statistics. ............................ 15
Table 8. Annual daytime discomfort in a typical lounge during heating season. .......... 17
Table 9. Key statistics for whole-house resource efficiency in three locations. ............ 20
Table 10. Estimated elemental embodied carbon in new detached houses in 2016. .... 20
Table 11. Estimated daily residential water consumption, for New Zealand cities. ...... 22
Table 12. Daytime living-area comfortable temperatures via passive solar means. ..... 23
Table 13. Key overheating statistics in Christchurch. ................................................ 24
Table 14. Daytime length living rooms are critically cold in Christchurch houses. ....... 25
Table 15. Walkability statistics of Y2012/Y2016 homes in three locations. ................. 26
Table 16. Transit Score statistics of Y2012/Y2016 homes in three locations. .............. 26
Table 17. Cost categories for new social housing in Auckland. .................................. 29
Table 18. BRANZ new-build index........................................................................... 30
Table 19. BRANZ relative cost of ownership index. .................................................. 31
Table 20. Purchase plus install cost increase of thermally improving typical house. .... 31
Table 21. Purchase-only cost of improving typical house specifications...................... 32
Table 22. Solar water heaters specified in building consent documentation. .............. 35
Table 23. Respondents favouring sustainability features in a new home. ................... 35
Table 24. Whole-house certified numbers by various institutes. ................................ 36
Table 25. Homestarä industry practitioners (2012 and 2016). .................................. 37
Table 26. PHINZ-accredited practitioners (2012 and2016). ....................................... 38
Table 27. Combined HPA accredited and EDA practitioners (2012 and 2016). ............ 38
 iv
Study Report SR426 Measuring our sustainability progress: New Zealand’s new detached residential
housing stock (first update)

Table 28. Lifemark® accredited practitioners (2012 and 2016)................................. 38
Table 29. Local authority supporting better water management (2012/2016). ........... 42
Table 30. Structure-related CO2eq. emissions of new stand-alone dwellings in 2016. . 55
Table 31. Cladding-related CO2eq. emissions of new stand-alone dwellings in 2016. .. 56
Table 32. Space heating types, efficiencies and resulting CO2 emission factors. ......... 59
Table 33. Three district plan basic rules on building envelope thresholds................... 62

 v
Study Report SR426 Measuring our sustainability progress: New Zealand’s new detached residential
housing stock (first update)

Glossary of terms
 active Describes the use of artificial heating to provide the space heating necessary
 space to achieve comfortable indoor temperatures (18–25°C) when solar and
 heating incidental gains are inadequate.
 climate A statistically significant variation in either the mean state of the climate or in
 change its variability, persisting for an extended period – typically at least several
 decades.
 conditioned The volume of the home that is contained within (i.e. bounded by) the
 area thermal envelope but, based on the thermal AccuRate NZ thermal modelling
 carried out, excludes the garage, hallway and bathroom zones.
 CSIRO Commonwealth Scientific and Industrial Research Organisation, whose global
 climate model for climate change forecasting (CSIR09) is used in this report
 (Australian based).
 degree- A commonly used indoor thermal measure. For degree-hours too hot, it
 hours equates to the temperature difference between the overheated internal zone
 and the overheating threshold temperature (in this case 25°C) multiplied by
 the overheating length. This provides a better indication of the human
 response (i.e. physiological stress) to overheating, i.e. 1 hour at 26°C is not
 equivalent to the physiological stress of 1 hour at 29°C.
 EDAs Eco Design Advisors. A free independent council-based advisory service for
 industry, community groups and the public, applicable to both new and
 existing dwellings.
 free- Describes when a building relies on only passive solar means to provide
 running comfortable indoor temperatures.
 mode
 Hadley The global climate model developed by the Hadley Centre for Climate
 Prediction Research by the UK Meteorological Office.
 indicator A quantitative, qualitative or descriptive measure representative of an aspect
 of building that impacts on the economy, environment or society, designed to
 communicate a situation at a point in time.
 IPCC Intergovernmental Panel on Climate Change. The leading international body
 for the assessment of the most recent scientific, technical and socio-
 economic information produced worldwide on climate change.
 LCA Life cycle assessment. A formal systems-based approach that examines the
 inputs and outputs of a product or service during its lifetime using
 standardised means.
 MEPS Minimum energy performance standard. These ensure that only efficient
 products that meet a minimum standard for energy efficiency are legally
 available for sale in New Zealand.
 NIWA National Institute of Water and Atmospheric Research (New Zealand based).
 NZBC New Zealand Building Code.
 NZGBC New Zealand Green Building Council.
 passive Building design that takes advantage of the site, orientation, climate, form,
 (solar) layout and materials to minimise purchased energy needs for internal thermal
 design comfort.
 R-value Physics measure of the resistance a material has to heat flow. The higher the
 value, the better the material is able to reduce heat flow from a warm zone
 to a colder zone (units = m2°C/W).
 thermal The imaginary barrier between the internally conditioned spaces within a
 envelope building and the outside. Usually defined by the volumes bounded by
 external walls, ceiling/roof and floor. Typically excludes the garage.

 1
Study Report SR426 Measuring our sustainability progress: New Zealand’s new detached residential
housing stock (first update)

Executive summary
The residential construction sector plays a vital role in terms of New Zealand’s
sustainable development, health and wellbeing. This research addresses the question
of where New Zealand as a nation stands in terms of a whole suite of sustainability-
related indicators associated with new stand-alone residential construction. It builds
upon the previous (year 2012) BRANZ report by providing updated results for a core
set of 14 indicators, encompassing the areas of building performance, market forces
and governance.

This report examines the new residential build-related activities and initiatives for the
calendar year 2016 (Y2016). Some 210 building consents were randomly selected from
the Y2016, extracted from three councils – Auckland, Hamilton City and Christchurch
City – to examine their new-home specification and performance aspects in detail. As
before, due to the lack of publicly available comparative benchmarks, Beacon
Pathway’s NOW Home® – a proof-of-concept sustainable house designed and built in
2008 in Auckland – was employed for a comparator for the bulk of the performance
metrics used. Some key findings for the eight domains are summarised in Table 1
following.

 2
Study Report SR426 Measuring our sustainability progress: New Zealand’s new detached residential
housing stock (first update)

Table 1. Key findings from the eight domains summarised.

 1. Energy and CO2
 Compared to the Beacon NOW Home®, the Y2016 homes (with very
 rare exceptions) have considerably higher space heating and cooling
 loads/CO2 emissions. The potential for harnessing and benefiting
 from solar radiance in new sites remains extremely high for almost
 all new sections in the three sampled cities examined (Auckland,
 Hamilton and Christchurch).
 2. Water
 There was a limited dataset of residential-specific water consumption
 figures available, with only Hamilton of the three cities having data.
 Daily consumption increased in the city of Hamilton in Y2016
 compared to Y2012. Historical consumption figures are available for
 many other cities.
 3. Indoor environment
 Compared to the NOW Home®, the Y2016 consented homes, with
 very rare exceptions, are considerably less comfortable via passive
 means (Christchurch result available only), having more extreme
 temperatures in the main living area.
 4. Functional resilience
 Auckland’s walkability has improved, while Hamilton and Christchurch
 remained static. The annual number of Lifemark®-awarded homes
 featuring comprehensive universal design has doubled. Thermal
 discomfort due to predicted climate change remains the same for the
 years 2030 and 2080.
 5. Affordability
 Cost of new housing increased by ~22% while the relative cost of
 ownership increased by ~36% in Auckland, ~15% in Hamilton and
 nil in Christchurch compared to Y2012. The cost increase for better
 windows stayed constant at ~30%.
 6. Consumer demand
 There has been a statistically significant decrease in new
 homeowners wanting to build for sustainability reasons in
 Christchurch when comparing to Y2012 figures. For Auckland and
 Hamilton, there has been no significant change.
 7. Industry capacity
 There is a fourfold increase in practitioners providing impartial,
 tailored sustainability advice compared to Y2012. However,
 sustainability issues still have a very small industry impact overall.
 8. Policy and regulation
 Two critical central government-based agencies – the Ministry of
 Business, Innovation and Employment (MBIE) and Energy Efficiency
 and Conservation Authority (EECA) – have not increased their
 supportive sustainable initiatives that directly affect the stand-alone
 housing stock when comparing Y2012 with Y2016.

 3
Study Report SR426 Measuring our sustainability progress: New Zealand’s new detached residential
housing stock (first update)

1. Introduction
In New Zealand, sustainability is one of four purposes of the Building Act 2004, where
“buildings are designed, constructed, and able to be used in ways that promote
sustainable development”.

The Act also requires certain principles to be taken into account, including the need to
facilitate:

• the efficient use of energy and energy conservation and the use of renewable
 sources of energy in buildings
• the efficient and sustainable use in buildings of material and material conservation
• the efficient use of water and water conservation
• the reduction in the generation of waste during the construction process.

The principle objective of this BRANZ 2016 study is to continue the sustainability-
related examination of the newly built detached housing stock to assess its
performance and impactors. To this end, this study also refines the Y2012 result to
provide even better longitudinal information to the user, but for the most part, this
report is a simple update. The founding report established and detailed the
background, methodology and interpretation and implications of the study.
Consequently, to avoid repetition, those details have been largely omitted from this
document. To best understand this Y2016 update, the Y2012 report (Jaques, 2015)
should be read prior or in parallel.

In all, eight domains were utilised to describe key impactors on and of new residential
houses in New Zealand. Although it is recognised that the groupings of the indicators
and their respective metrics are an artificial construct, they help partition and
rationalise a disparate range of issues into a digestible format. The relationship
between the indicators and their associated metrics can be seen in Table 2.

As much as possible, the indicator set was derived from existing sources of information
and knowledge, leveraging off various national-based agencies, most notably Beacon
Pathway’s indicator framework developed by Kettle (2008) and Trotman (2008), which
examined the need for a national housing indicator framework for New Zealand. This
BRANZ study also significantly extends these works both with in-house and externally
developed metrics.

In terms of some basic new housing stock statistics,1 at the end of the 2012 year,
some 16,929 new dwellings had been consented. 13,733 of these were classified as
houses (rather than townhouses, retirement villages, apartments or units). The
population was 4,410,700. In the 2016 year, 29,970 new dwellings were consented
with 21,310 classified as houses, and the population was 4,696,500.

1
 Source: http://archive.stats.govt.nz/infoshare
 4
Study Report SR426 Measuring our sustainability progress: New Zealand’s new detached residential
housing stock (first update)

Table 2. Summary of indicators and metrics for stand-alone homes (for Y2016).

 Domain Core indicator(s) Metric(s) used
 Energy use for space kWh/m2, kWh/household and
 conditioning kWh/person
 CO2 emissions for water and kg CO2 emissions/person/year
 space heating
 1. Energy
 Potential of site for harnessing Percentage availability of sun
 and CO2
 solar energy Degree-hour daytime discomfort
 Whole-house resource efficiency Ratio of floor area to number of
 rating bedrooms + embodied carbon for house-
 lot of materials
 Uptake of household water- L/person/day
 2. Water saving devices + average water
 consumption
 Comfortable indoor temperatures Daytime # of hours/year comfortable in
 achieved passively main living area
 3. Indoor
 environment Healthy indoor temperatures in a Extreme heat (# of degree-hours/year
 key occupancy zone above 25°C) and critically cold (# of
 days/year less than 12°C)
 Proximity to key amenities/public Walk Scoreä and Transit Scoreä ratings
 transit
 4. Inclusion of universal design # of Lifemark® Design Standard awards
 Functional features
 resilience Climate change implications on Overheating (hours/day) and
 indoor thermal comfort achieved underheating (hours/day) projections for
 passively years 2030 and 2080
 Housing affordability and key New-build index and cost of ownership
 5. enviro-feature costs index
 Affordability Cost of improving thermal, energy and
 water efficiencies
 Demand/sales of some key Products: specification of eco-related
 6. Consumer sustainable products and services products + whole-house demand
 demand Services: # of whole-house
 environmental awards
 Supply of some key # of supporting industry-related
 sustainability-related services professionals
 7. Industry
 # of banks providing green mortgages
 capacity
 # of trade-specific capacity-building
 initiatives
 8. Policy and Supportive government policy # of existing and longer-term initiatives
 regulation and regulation implemented

 5
Study Report SR426 Measuring our sustainability progress: New Zealand’s new detached residential
housing stock (first update)

2. Background
This section remains unchanged to that previously documented in the Y2012 report:

• Scope – limited to new New Zealand stand-alone dwellings and their immediate
 amenities.
• Requisite characteristics of indicators – meaningful, specific to underlying
 phenomena, easily interpreted, consistent over time, linked to emerging issues and
 resonate with the intended audience.
• Growing need for quantitative stock indicators – economic contributions of
 our housing stock to our economy, changes facing New Zealand Inc. and the
 resulting threats and opportunities.
• Audience and uses – to provide a foundation on which to track changes in key
 aspects and to support strategic decision making and influencing policy, action and
 behaviour.

More detailed information on each of the preceding issues is provided in section 2 of
the Y2012 report. The most important overriding difference between this update and
the original report is the better and wider understanding of the implications of the
enormity of climate change in terms of the viability for the health of this planet.

Writing a ‘backcasting’ report means that, by its nature, it doesn’t capture the most
recent important initiatives and resources affecting the new residential building stock.
Given its global threat, mention should be made of key building-related resources that
address either New Zealand’s residential building climate change mitigation or
adaptation aspects occurring since 2016:

• The Zero Carbon Act – more formally, the Climate Change Response (Zero Carbon)
 Amendment Act 2019.
• Royal Society’s Transition to a low-carbon economy for New Zealand (Sims et al.,
 2016).
• New Zealand Productivity Commission’s Low-emissions economy (New Zealand
 Productivity Commission, 2018).
• BRANZ Study Report The built environment and climate change: A review of
 research, challenges and the future (MacGregor et al., 2018).
The following BRANZ projects are also relevant:

• Carbon budget (2018–2019) – provides an absolute greenhouse gas emission
 design targets and thresholds for both office and residential buildings to meet New
 Zealand’s 2050 international obligations. The dynamic tool is able to be
 continuously updated to best reflect progress.
• How can New Zealand construction deliver low to zero impact buildings? IEA EBC
 Annex 72 (2018–2021) – establishes a common methodology and derives
 benchmarks to assess life cycle-based carbon emissions caused by buildings.
• The multi-year Transition to a Low-Carbon Built Environment programme,
 examining climate change and its impact on New Zealand’s buildings (started in
 2019).

 6
Study Report SR426 Measuring our sustainability progress: New Zealand’s new detached residential
housing stock (first update)

3. Methodology
 Introduction
The methodological approach for this Y2016 report is very similar to that of the Y2012
report, recognising that most of the establishment has already been carried out and to
ensure between-year consistency. For details on the development of New Zealand-
specific indicators, previous international indicator resource and the Year Zero yardstick
house, the Y2012 report should be consulted. As before, there are eight overriding
domains separated into three overriding themes (see Figure 1):

THEME Domain(s) THEME Domain(s)
Building 1. Energy and CO2 Market forces 5. Affordability
performance 2. Water 6. Consumer demand
 3. Indoor environment 7. Industry capacity
 4. Functional resilience Governance 8. Policy and regulation

Figure 1. Relationship between three thematic areas and their associated domains.

Once again, a steering group (now renamed advisory group) was established in early
2017. The group was tasked to further refine the original indicators and metrics where
necessary, given the benefit of several years of new data collection opportunities and
knowledge. Other external experts also provided useful feedback on potential areas for
embellishment and improvement. A key discussion point was whether the number of
indicators was about right for the likely end users of the report and therefore whether
there were too few/too many. A statement in the Y2012 report was kept in mind:
“Although having an expansive suite of indicators may be appealing, this conflicts with
the overall desire to simplify interpretation and therefore communication of the issues.”
(Jaques, 2015, p.8)

The advisory group thought that the Y2012 report indicators and associated metrics on
new housing were sound and useful, providing a good insight that was not previously
available in an amalgamated format. However, discussions at the first meeting in late
2017 uncovered some possible avenues for improvement and/or exploration. These are
detailed in section 3.2.

 Changes to core indicator metric set (from Y2012)
Some minor changes were made to the indicators examined and their associated
metrics. The changes typically stemmed from:

• the growing importance/awareness of carbon’s role in the construction industry,
 even though this wasn’t reflected in consumer demand
• newly uncovered data sources that could be easily leveraged for this study
• external provider’s data stream ending
• a better understanding of the potential audience interest areas
• opportunities for clarification or data augmentation in the form of case studies.

Table 3 highlights the indicator and metrics changes made. Only those
indicators/metrics where a change occurs have been included, with additions in red,
substitutions in blue and deletions as strike-through. The details on why individual
changes occurred are discussed within the relevant section.

 7
Study Report SR426 Measuring our sustainability progress: New Zealand’s new detached residential
housing stock (first update)

Table 3. Indicators and main metric changes made.

 Domain Core indicator Metric(s) used
 CO2 emissions from space heating CO2 emissions/person/year
 Mini study on shading from Discomfort (degree-hours).
 Energy and neighbouring recession planes
 CO2 resulting from district plans
 CO2 emissions from house shell Embodied CO2 for house (shell only)
 materials
 Average daily (per capita) L/person/day by city
 Water
 residential water consumption
 Initial financial cost of five key Cost of improving thermal, energy and
 environmental features water efficiency
 Affordability Housing affordability and key Inclusion of new build index (national)
 enviro-features costs and relative cost of ownership (three
 cities)
 Demand/sales of some key Products: specification of photovoltaic
 Consumer
 sustainable products and services panels, solar thermal and rainwater
 demand
 storage

Perhaps the most contentious change is the reconsideration of the three key
sustainable products typically associated with environmentally conscious homes:
household photovoltaics, solar thermal water heaters and rainwater collection tanks.
Balancing the environmental, economic and social attributes of products is challenging,
even for those with full life cycle studies assisting the process. It was felt that the
Y2012 study’s approach needed to be more nuanced to better reflect the most recent
New Zealand findings, which calls into question popular understandings (see discussion
in section 5.12).

Another request from the advisory group was that the other residential typologies –
specifically townhouses and apartments – are considered alongside single stand-alone
homes. This was not able to be delivered for two main reasons:

• In Y2016, stand-alone homes make up by far the bulk of homes being built in New
 Zealand, even acknowledging the rapid increase in numbers of townhouses.
• There would need to be a considerable revisioning of the metrics used within this
 report due to the considerably more complex nature of shared resources.

 Extending social-based indicators
Although there are several indicators that examine the social aspects of sustainability
(albeit mostly through indirect measures), the advisory group felt that it should be
augmented if practical. The exploration to strengthen the social metrics was initiated in
mid-2017, via consultation with BRANZ’s social anthropologist. He was tasked with
investigating the possible development of a new indicator that met (at least the bulk
of) the key attributes listed in section 2.2 of the Y2012 report. After much discussion
and an assessment of existing New Zealand-based research, it was found that it was
not possible to leverage existing resources to provide further insights. Thus, the Y2012
social-based indicators were not advanced in this Y2016 report.

BRANZ recognises the importance of this issue and will revisit it when supporting
resources become available.

 8
Study Report SR426 Measuring our sustainability progress: New Zealand’s new detached residential
housing stock (first update)

 Analysis of changes in homes’ performance
 attributes
The thermal analysis undertaken of the randomly selected houses consented within a
year is by far the most intensive and time-consuming part of this project. It was
suspected that, within the last 4 years, there would be very little in the way of thermal
performance changes of the new stock in any of the three locations of interest:
Auckland, Hamilton and Christchurch.

These suspicions were based on (lack of new) internal and external drivers that
influence the thermal characteristics of a house:

• The residential market is known to be slow moving in terms of uptake of new
 ideas, especially if they are not mandated. Anecdotally, it seems that higher
 thermal performance contributors are one of the first things to drop off when new-
 build budgets are exceeded.
• Examining the 210 selected Y2016 plans and specification documents, there was
 little in the way of information on the individual elements that contribute to whole-
 of-house thermal performance such as orientation of glazing etc.
• The specification of (usually) the critical marker for higher thermal whole-house
 performance – with double glazing – remained at (with very few exceptions) Code
 levels, reflecting no change from the Y2012 results
• Other possible influencing external features had remained either similar to or
 unchanged from the Y2012 study, such as NZBC clause H1 Energy efficiency
 requirements and district plan regulations.

As a result, an exploratory examination was conducted of the most likely city to
embrace higher thermal performance. If this city demonstrated a statistically significant
change in thermal performance (comparing Y2012 with Y2016), dynamic thermal
models of the two remaining cities would be carried out.

Christchurch was chosen to be the exploratory location for these reasons:

• There is a history of initiatives by building research and advocacy organisations
 (most notably Beacon Pathway and the Superhome Movement) to improve the
 thermal performance characteristics in both rebuilds and new housing, which have
 been very active since 2012.
• It has the coldest climate of the three locations investigated and therefore,
 everything being equal, homeowners are more likely to invest in better thermal
 options than the minimums required to meet the NZBC.
• It has a history of investing in better thermal options in new housing, choosing
 double glazing well before this became (almost) mandatory in New Zealand – it
 was estimated that some 68% of new homes in Christchurch were installing double
 glazing on all windows (NFO New Zealand, 2002).

The first lot of some 70 Christchurch houses were assessed in terms of a key metric –
space heating requirements to maintain comfort – and the results are shown in Table
4. As can be seen, the mean space heating energy for Y2016 falls within the Y2012
95% confidence level, meaning there is no discernible difference in thermal
performance between Y2012 and Y2016.

 9
Study Report SR426 Measuring our sustainability progress: New Zealand’s new detached residential
housing stock (first update)

Table 4. Christchurch space heating energy intensity metrics – Y2012 versus Y2016.

 Location Sample size Mean space heating energy and
 95% confidence interval
 2012 2016 2012 2016
 Christchurch 68 70 76.7±2.2 73.7±3.6

The resulting unchanged space heating requirements are unsurprising when the
individual thermal characteristics are examined such as:

• house size/volumes
• thermal mass placement/usage
• window size and placement
• access to sunlight
• most importantly, the specified double glazing.

As a result of the exploratory study, it seems very likely that the Y2012 metrics for
both Auckland and Hamilton reflect the Y2016 situation on:

• energy use for active space conditioning (i.e. both heating and cooling)
• comfortable temperatures in a key occupancy zone (i.e. between 18°C and 25°C)
• healthy indoor temperatures for a key occupancy zone (i.e. not below 12°C or
 above 25°C).

As a result of this exploratory study, only the Christchurch results for the above
indicators have been determined using dynamic software for each of the 70 houses
examined as part of the random selection.

 10
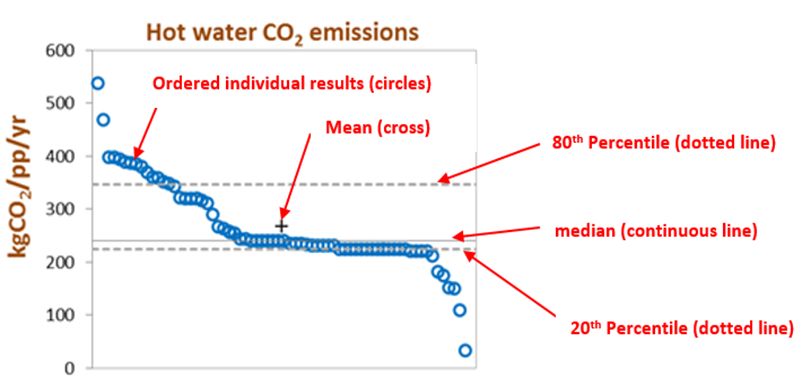
Study Report SR426 Measuring our sustainability progress: New Zealand’s new detached residential
housing stock (first update)

4. Interpretation
 Yardstick applied and analysis
As in the Y2012 report, some 210 randomly selected, stand-alone house building
consents from the three cities of Auckland, Hamilton and Christchurch were examined
for the indoor environment, energy and CO2 domains. For this Y2016 follow-up, the
new home consents examined were all processed in the 2016 calendar year. The same
yardstick – Beacon Pathway’s NOW Home® – was used to provide a gauge of where
the Y2016 housing stock sits in terms of a wide variety of building performance and
sustainability-related indicators.

The NOW Home® was chosen as a suitable yardstick, as it:

• used current (circa 2017) construction technologies, systems and methods, while
 having an everyday aesthetic
• is well known and understood, having been intensely monitored and analysed, both
 prior to and post occupancy
• has met a comprehensive variety of environmental, economic and social high-
 performance goals, thereby providing a robust example of what is practically
 achievable in New Zealand.

For much of the building performance-related studies, snake diagrams were utilised,
where individual homes’ metrics are presented in an ascending/descending order. As
before, for consistency in all the diagrams, the median is shown as a continuous grey
line, and the 20th and 80th quintiles are shown as dotted grey lines (see Figure 2).

Figure 2. Annotated snake diagram to assist interpretation.

The approach used in the presentation of the tabular results was left largely
unchanged for this Y2016 update. Only small refinements – such as the inclusion of
per capita and per consent statistics – were added in to better contextualise the study-
year results presented in tabular format.

 11
Study Report SR426 Measuring our sustainability progress: New Zealand’s new detached residential
housing stock (first update)

5. Results
 Energy use for active space conditioning
Background
The approach taken in this study report for this issue remains very similar to the Y2012
report.

The three metrics previously used to examine the randomly selected houses were
repeated:

• Space heating energy required per unit floor area (kWh/m2).
• Space heating energy required per household (kWh/household).
• Space heating and cooling energy required per occupant (kWh/person).

Once again, detailed thermal simulations were carried out on the randomly selected
stand-alone building consents – this time for the 2016 calendar year but now only
including Christchurch. AccuRate NZ, which relies on hourly climate files to provide an
accurate assessment of heat flows, was used.

For comparative purposes on thermal performance, the Beacon Pathway Waitakere
NOW Home® is used.

For more detailed information on the methodology, refer to section 5.1 of the Y2012
report.

Findings
NZBC climate zone 3: Christchurch

Figure 3 shows the annual space heating only and conditioning (i.e. accounting for
both space heating and space cooling) energy load for the 70 randomly selected
Christchurch stand-alone houses. Three key normalisers – by area, per household and
per occupant – provide different perspectives on the homes’ thermal performance.

 Space heating energy use, Space heating energy use, 5
 Space conditioning energy
 30
 100 by area per household use, per occupant
 4
 kWh/household/yr (000s)

 kWh/occupant (000s)

 20
 3
kWh/m2/yr

 50
 2
 10
 1

 0 0 0

Figure 3. Space heating/cooling energy use by area, household and occupant.

Table 5 extracts some key statistics for the randomly selected Y2016 Christchurch
houses and uses the Waitakere NOW Home® as a basis for comparison. MBIE’s
requested additional metric – examining conditioning energy use by area – is also now
included.

 12
Study Report SR426 Measuring our sustainability progress: New Zealand’s new detached residential
housing stock (first update)

Table 5. Key statistics examining household energy for Christchurch homes.

 50th 80th
 Mean
 percentile percentile
 NOW
Christchurch 2012 2016 2012 2016 2012 2016
 Home®
Space heating energy use
By area (kWh/m2) 36 77 74 76 74 84 81
By household (kWh/household) 4,354 10,780 10,054 9,571 10,042 13,160 12,540
Space conditioning energy use
By occupant (kWh/person) 1,146 2,256 2,210 2,040 2,220 2,632 2,664
By area (kWh/m2) 78 76 77 76 85 84

Notable points
• As for Y2012, there is a considerable difference between the thermal performance
 of the worst and best house in terms of their active space heating requirements.
 The highest space heating use required per unit floor area is nearly quadruple the
 lowest figure.
• The difference between what could easily be achieved through considered design
 (i.e. the Beacon Pathway NOW Home®) and what is currently being achieved (i.e.
 the randomly selected homes’ median performer) in terms of active thermal
 performance is considerable. This is true for whichever energy use metric (by area,
 by household or by occupant) is chosen.
• This gulf in thermal performance is even more startling when only a handful of
 selected homes designed for the Christchurch climate thermally outperform the
 Now Home®, which was designed for a considerably more clement climate.
• Otago University’s Department of Public Health, who examined the impacts large
 houses are having, stated that “…despite insulation standards improving since the
 mid-seventies we are still using the same amount of energy to heat our houses as
 we did then”.2

 CO2 emissions for water and space heating
Background
The two highest residential appliance-related energy end users (Isaacs et al., 2010)
and therefore likely carbon dioxide emitters – water heating and space heating – are
investigated in this subsection. This extends the Y2012 report, where the appliance
emissions focus was limited to just water heating, to have a more complete picture of
the likely emissions profile of a typical new house.

Water heating

The methodology and reasons for choosing this indicator remains unchanged from the
Y2012 report. The CO2 emissions estimation is based on hot water algorithms from the
WHAT HO! Tool, which was originally co-developed by EECA and BRANZ (Burgess &
Cogan, 2008), which incorporates standardised user behaviour. For more details on the
method, consult section 5.2 of the Y2012 report.

2
 Source: https://www.rnz.co.nz/national/programmes/nights/audio/201858580/new-zealand-s-
ever-expanding-houses.
 13
Study Report SR426 Measuring our sustainability progress: New Zealand’s new detached residential
housing stock (first update)

Once again, randomly selected building consent documents from stand-alone homes in
Auckland, Hamilton and Christchurch were mined. For comparative purposes, the NOW
Home® is used, which has an appropriately sized solar thermal collector combined
with an efficient plumbing set-up.

Space heating

This indicator is new for Y2016. It was introduced due to the increasing need to
account for this being a substantial residential carbon dioxide contributor. The Y2012
report discussed the reasons why a carbon metric for space heating was not applied.
Although these reasons for space heater exclusion still apply (i.e. many building
consents don’t include details on heater type/efficiencies/zones serviced), given
carbon’s increasing importance, it was decided to explore other ways to sensibly fill in
the data gaps.

After some discussion with both in-house and external experts, an approach was
agreed on to determine a reasonably robust indicator that can be easily replicated year
on year. The new emissions metric agreed upon is kg CO2/yr/household. The approach
has been ‘backcasted’ to include Y2012 data for completeness. The methodology is
further detailed in Appendix C.

It is acknowledged that space heating will likely only be used during peak demand
times – around breakfast time and dinner time. For space heating appliances that are
electrically powered, relying on an average carbon intensity may mask the variability
associated with the different combinations of generation types over different time
scales (Khan et al., 2018). This requires moving beyond a yearly average carbon
intensity to a more nuanced approach that considers time variability.

To explore this time variability further, half-hourly emission profiles from electricity
generation plant were derived by BRANZ for the 5 years from 2012–2016 using
Electricity Authority3 data. The peak periods (6–9am and 5–11pm) for the three winter
months were compared to the off-peak period (12–5am) for the three summer
months). Surprisingly, it was found that there was only a small difference in CO2
intensities between the two extremes.

This is supported by another more comprehensive study, which found that “daily peak
time carbon intensity in New Zealand from electricity generation does not differ
significantly from the carbon intensity during off-peak periods” (Khan et al., 2018, p.
1098), attributing this to hydro providing the dominant response to daily peak demand,
acting like a big battery. Importantly, Khan et al. (2018) found that New Zealand has a
relatively high carbon intensity for base demand but relatively low carbon intensity for
peak demand, which is the opposite of many other countries.

As a result of these findings, the standard carbon emissions figure for electricity was
resorted to for space heating emissions for electricity-fuelled appliances (0.18
kg.CO2e/kWh – as used in the Y2012 report).4

3
 Source: www.emi.ea.govt.nz/Wholesale/Datasets/Generation/Generation_MD. Accessed 12
February 2019.
4
 It is acknowledged that this figure is dynamic and has a forecasted reducing intensity
trajectory. However, for comparative inter-year simplicity, this longitudinal study will keep the
electricity emission intensity constant.
 14
Study Report SR426 Measuring our sustainability progress: New Zealand’s new detached residential
housing stock (first update)

For comparative purposes, the NOW Home® is used, which was specifically designed
to rely on very good passive solar supplemented occasionally using plug-in heaters for
year-round comfort.

Findings
Table 6 shows the considerable gulf between a carbon-efficient water heating system
and what is typically being installed. Comparing the mean figures, the Now Home®
has approximately 3.5x, 3.4x and 2.7x less carbon-intensive water heating
requirements for Auckland, Hamilton and Christchurch respectively for Y2016. These
comparative results were similar for the Y2012 figures.

Table 6. Household water heating-related CO2 emission statistics.

 Hot water emissions (kg CO2/person/yr)
 Mean Mean 50th percentile 80th percentile
 Location NOW Home® 2012 2016 2012 2016 2012 2016
 Auckland 73 251 246 264 258 294 319
 Hamilton 86 274 271 296 289 316 335
 Christchurch 101 268 276 240 228 347 387

Table 7 shows the space heating-related CO2 emissions for the three cities of Auckland,
Hamilton and Christchurch, based on approximately 210 randomly selected stand-alone
dwellings for Y2012 and Y2016. Only Christchurch CO2 emissions could be calculated
from the thermal models built of the Y2016 dwellings. There seems to be a decline in
the amount of yearly CO2 per household for the Christchurch houses, but this is not
statistically significant.

Once again, the NOW Home® clearly displays the implications of a thermally well
designed envelope.

Table 7. Household space heating-related CO2 emission statistics.

 Space heating emissions (kg CO2/household/yr)
 Mean Mean 50th percentile 80th percentile
 Location NOW Home® 2012 2016 2012 2016 2012 2016
 Auckland 75 552 Not calc 463 Not calc 732 Not calc
 Hamilton 151 728 Not calc 645 Not calc 873 Not calc
 Christchurch 345 1,455 1,308 1,128 1,020 2,296 1,992

Notable points
Water heating

• There is a large CO2 pollutant range for both Y2012 and Y2016.
• Y2016 consented Christchurch homes have considerably larger CO2 emissions
 footprints than those consented in Y2012 on average. This is likely due to the shift
 towards the use of instantaneous gas for water heating.
• The change in average emissions intensity does not reflect the progressively colder
 climate of the more southern locations.
• The NOW Home® provides a good example of the potential of a well designed hot
 water system with emissions intensities per person well below that of the others or
 all three locations.

 15
Study Report SR426 Measuring our sustainability progress: New Zealand’s new detached residential
housing stock (first update)

Space heating

• This is difficult to interpret for Auckland as in Y2012. 74% of the randomly selected
 houses were classified as having “unknown” space heating appliances, while in
 Y2016, only 30% were. The range of space heating-related emissions is
 considerable.

 Potential of site for harnessing solar energy
Background
The reasons for choosing this indicator remain unchanged from the Y2012 report. A
well solarised site has positive implications for the comfort and health of the dwelling’s
occupants, renewable energy generation and food production (Ghosh, Vale & Vale,
2008). Once again, the focus is on the site’s potential for harnessing of energy and
conversely the likely shading influences. The Y2016 scope has extended, however, to
examine shading aspects more thoroughly.

Shading (and its implications for harnessing solar energy, health and comfort) is
influenced by three factors:

• Topography – likely minimal in most new New Zealand developments.
• Nearby buildings – explored in this report and becoming more likely.5
• Nearby foliage – unknown, but unlikely to be considerable in new suburbs.

NIWA’s online SolarView tool6 quantifies the solar energy collection potential (in
kWh/yr) of a given address, accounting for topographic influences. In the Y2012
report, it was found that the solar potential of all the randomly chosen sites for the
three cities were close to 100% of what was available. Thus, the amount of shading
from surrounding geographic features was close to nil. An assessment of the Y2016
house consents in all three cities revealed that this situation remains unchanged, which
is unsurprising.

The potential influence of more local shading due to nearby buildings, based on what is
allowable when adhering to local recession rules,7 is explored here as a mini study. To
quantify the influence of building-related shading in a suburban environment, the
current district plan recession plane regulations for the three cities of interest were
examined. A typical house was selected from the Y2016 Christchurch sample, chosen
due to its passive thermal performance characteristics being very close to the mean.
For the case study, an assumption was made that developers would likely design to the
recession plane to maximise their coverage areas. Consequently, the shading on the
adjacent property would also be maximised. Thermal simulations of the house were
then conducted, with the living room’s thermal comfort performance used as a whole-
house comfort proxy.

To approximate the presence of an arbitrary object providing the maximum level of
shade theoretically allowed within the simulations, shade was provided by artificial
‘walls’ constructed to touch the limits of the recession plane. These varied by district

5
 According to Peter Joyce, Principal Specialist Urban Design at Auckland Council, “… we are
seeing homes getting closer and closer together and rules determining separation distances
reducing all the time”. Email correspondence with author, 3 May 2018.
6
 https://solarview.niwa.co.nz, where the cloudless figures in W/m2 are used as the measure.
7
 Depending on the jurisdiction, also known as recession plane, daylight admission, height
control envelope, building envelope, daylight controls, height in relation to boundary.
 16
Study Report SR426 Measuring our sustainability progress: New Zealand’s new detached residential
housing stock (first update)

plan. Methodological details, including the thresholds of each of the three jurisdictions
examined in this study (Auckland, Hamilton and Christchurch), are provided in
Appendix F.

Finally, the remaining shading issue of possible concern – that from nearby foliage – is
considerably more complex to both appraise and model. It is also likely to be more
important in established rather than new suburbs. This shading issue may be explored
as a future case study, with hilly Wellington being high on the list of likely trial
locations.

Findings
Table 8 shows the local recession plane influence on living room thermal comfort
(which is passively acquired) on the typical stand-alone house during the 7am–11pm
period. The resulting thermal discomfort is measured using the degree-hours metric.
This metric is simply the product of the temperature below a nominated set point (in
this case, 18°C) and the annual time spent below this temperature (in hours). It is an
easy way to comprehend the severity of the change in thermal comfort, as the more
extreme the temperature is, the larger its effective weighting/value.

As can be seen in Table 8, the builder’s/developer’s influence is considerable in terms
of winter-time comfort provision, based on a typical single-storey house.

Table 8. Annual daytime discomfort in a typical lounge during heating season.

 Location Daytime discomfort resulting from adjacent site (degree-hours)
 No buildings and Built to local recession Resulting increase in
 no shading plane rules daytime discomfort
 Auckland 1,226 2,795 128%
 Hamilton 3,340 5,289 58%
 Christchurch 10,794 14,190 31%
 Unweighted mean of 3 regions 72%

The varying – and sometimes unclear – recession plane and set-back approaches
between authorities is concerning and needs to be remedied.

For example, the terms ‘daylight’ and ‘sunlight’ are used interchangeably, when they
are very different issues:

• Auckland Council Unitary Plan Appendix 10: “Its primary purpose has been to
 ensure that residential zoned properties … adjoining new building developments
 receive adequate minimum amounts of daylight.”8
• Invercargill City Council District Plan: “The recession planes are calculated to
 reduce shading and to ensure a minimum allowance of sun and natural light for
 both you and your adjoining neighbours.” 9
• Gisborne District Council guidance: ”These rules are designed to protect your
 neighbour’s access to sunlight.”10

From this BRANZ mini study, the efficiency of district plan rules must be called into
question.

8
 https://unitaryplan.aucklandcouncil.govt.nz
9
 https://icc.govt.nz/wp-content/uploads/2017/03/Residential-1-and-1A-Zones-1.pdf
10
 https://www.gdc.govt.nz/guide-to-residential-development/
 17
You can also read