The Dynamics of a Liberalised European Gas Market: Key determinants of hub prices, and roles and risks of major players - Oxford ...
←
→
Page content transcription
If your browser does not render page correctly, please read the page content below

December 2014

          The Dynamics of a Liberalised
                European Gas Market:
       Key determinants of hub prices, and roles and
                              risks of major players

OIES PAPER: NG 94                Jonathan Stern & Howard V Rogers
The contents of this paper are the authors’ sole responsibility. They do not
         necessarily represent the views of the Oxford Institute for Energy Studies or any of
                                             its members.

                                          Copyright © 2014
                                Oxford Institute for Energy Studies
                                  (Registered Charity, No. 286084)

This publication may be reproduced in part for educational or non-profit purposes without special
permission from the copyright holder, provided acknowledgment of the source is made. No use of this
publication may be made for resale or for any other commercial purpose whatsoever without prior
permission in writing from the Oxford Institute for Energy Studies.

                                      ISBN 978-1-78467-018-4

December 2014: The Dynamics of a Liberalised European Gas Market                                  ii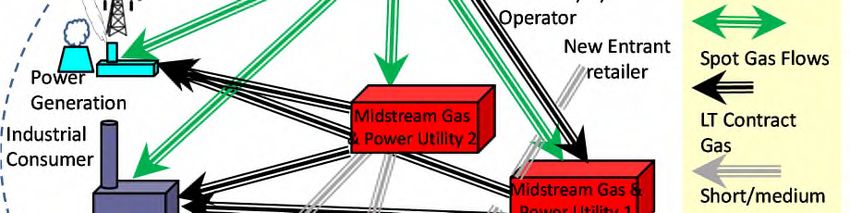
Contents
Introduction ...........................................................................................................................................1
Chapter 1: European Gas Price Evolution: what are the key determinants of hub pricing? ........2
   1.1 The Historical Context...................................................................................................................2
   1.2 The Period Prior to Continental European Hub Pricing ................................................................4
      European wholesale price dynamics ...............................................................................................4
      European wholesale prices in an international context ...................................................................6
      Interactions between British and Continental European markets....................................................7
      The declining rationale of Continental European oil-indexed gas pricing........................................9
   1.3 The Arrival of Hub Pricing ...........................................................................................................11
      Continental Europe - the ‘Perfect Storm’ .......................................................................................11
      The plight of the midstream utilities ...............................................................................................12
      The rise of the hubs and the spread of hub pricing .......................................................................13
      The evolving relationship between long term contract oil-indexed prices and hub prices ............18
      The emergence of dynamic arbitrage between hubs ....................................................................20
   1.4 The Determinants of European Hub Prices: an analytical framework ........................................22
      The sources of supply....................................................................................................................22
      A European supply stack view- flexible and inflexible tranches ....................................................24
      How does flexible supply set hub prices?......................................................................................26
      European hub pricing in 2014........................................................................................................27
   1.5 The Impact of Global Dynamics..................................................................................................30
      The ‘Big Six’ post-2015 uncertainties ............................................................................................32
           1.     Demand for natural gas and LNG in Asia .........................................................................33
           2.     Transition away from JCC pricing in Asian LNG markets .................................................35
           3.     Scale and pace of US LNG export approvals and construction........................................36
           4.     Scale of LNG supply ramp-up from non-US suppliers ......................................................36
           5.     Shale gas development outside North America................................................................37
           6.     Russian response to ‘overspill’ of excess LNG into the European market .......................38
      Scenarios arising from the six major uncertainties ........................................................................38
      Indicative Scenario Price Paths .....................................................................................................43
   1.6 Summary and Conclusions: key determinants of European hub prices post-2014....................47
      Predictability, volatility and market power......................................................................................49
Chapter 2. European Gas Market Players: changing roles and risks............................................50
   2.1 Historical Context: the monopoly era ..........................................................................................50
      Producers and exporters ...............................................................................................................51

December 2014: The Dynamics of a Liberalised European Gas Market                                                                                      iii
Merchant transmission companies ................................................................................................51
      Local distribution companies .........................................................................................................51
      Roles and risks of the major players..............................................................................................52
   2.2 European Union Legislation and Regulation ..............................................................................53
      Pre-2008: the First and Second Gas Directives and the Energy Sector Inquiry ...........................53
      Post 2008: the Third Package and its unfolding impact ................................................................56
   2.3 The Impact of Regulation and Competition on Market Structures and the Roles of Market
   Players ..............................................................................................................................................58
      The period up to 2008....................................................................................................................58
           Britain ........................................................................................................................................58
           Continental Europe ...................................................................................................................59
      The period since 2008 ...................................................................................................................60
           Producers and exporters...........................................................................................................62
           Mid-stream energy trading companies......................................................................................62
           Local distribution companies.....................................................................................................63
           Network companies...................................................................................................................63
   2.4 The Impact of the New Market Structure and Regulation on Commercial Frameworks and Risk
   Exposure of Market Players ..............................................................................................................63
      Contract and price risk in the competitive gas market...................................................................64
           Producers and exporters...........................................................................................................64
           Mid-stream energy trading companies......................................................................................65
           Network companies...................................................................................................................67
           Local distribution companies.....................................................................................................68
      Security considerations, design of hub-based prices, and managing sales to different customer
      classes ...........................................................................................................................................68
   2.5 Summary and Conclusions .........................................................................................................71
Chapter 3. Summary and Conclusions .............................................................................................73
      The determinants of hub pricing ....................................................................................................73
      Gas market players: changing roles and risks...............................................................................74
      Implications of these conclusions for the future of European gas markets ...................................76
Glossary ...............................................................................................................................................78
Bibliography ........................................................................................................................................80

Figures
Figure 1: European Demand and Supply Sources: 1970 – 2013 ...........................................................4
Figure 2: British and German Wholesale Gas and Crude Oil Prices – 1984 to 2013.............................5
Figure 3: German Border Price and Fitted Formula: 2001-11 ................................................................6

December 2014: The Dynamics of a Liberalised European Gas Market                                                                                          iv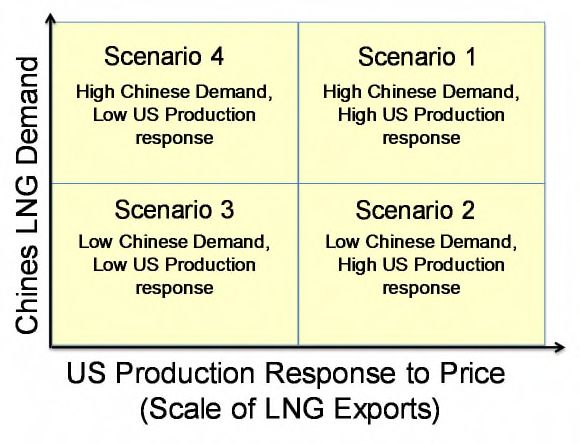
Figure 4: Monthly International Gas and Brent Crude Oil Prices: 2001-08 ............................................7
Figure 5: Bacton-Zeebrugge Interconnector Daily Pipeline Flows 1998 - 2009 .....................................8
Figure 6: NBP Day Ahead Spot Prices and German Average Import Gas (BAFA) Prices January 1997
– December 2009 (Monthly Averages) ...................................................................................................9
Figure 7: Gas Volumes Traded, OTC Day Ahead 2007 – October 2013 (TWh) ..................................14
Figure 8: Gas Volumes Traded, OTC, Month Ahead, 2007 – October 2013 (TWh).............................14
Figure 9: Exchange Traded Volumes, Day Ahead, (TWh) ...................................................................15
Figure 10: Exchange Traded Volumes, Month Ahead (TWh)...............................................................15
Figure 11: European Hub Price Correlation Month Ahead Contracts January 2012 – December 2013
..............................................................................................................................................................16
Figure 12: European Price Formation 2005-13.....................................................................................17
Figure 13: NBP and Estimates of European Oil-Indexed Contract Prices 2008 – 2014 ......................19
Figure 14: North West European Hubs and Trading Flows around 2008.............................................20
Figure 15: Dynamics of North West Europe Trading Hubs...................................................................21
Figure 16: Sources of European Gas Imports ......................................................................................23
Figure 17: A Supply Stack for North and Central Europe, 2012 and 2013...........................................25
Figure 18: European Hub Prices January 2012 – June 2014, Month Ahead Contracts.......................27
Figure 19: Monthly Gas Demand in North and Central Europe, October 2012–April 2014..................28
Figure 20: European Pipeline Imports 2012 to August 2014 ................................................................29
Figure 21: Europe – Asia LNG Balance 2008 – 2014...........................................................................30
Figure 22: International Gas Prices 2001 - 2014 ..................................................................................31
Figure 23: Global LNG-Linked System Post 2015 ................................................................................32
Figure 24: Asian LNG Demand 2010 – 2030........................................................................................33
Figure 25: Low Chinese Demand Case Supply Make-up 2006 - 2030 ................................................34
Figure 26: High Chinese Demand Case Supply Make-up 2006 - 2030................................................35
Figure 27: Global LNG Supply (excluding US Projects) 2004 - 2030 ...................................................36
Figure 28: Growth in Global Unconventional Gas Production to 2035 .................................................38
Figure 29: Global Scenarios for a range of Chinese Demand and US Production Response .............39
Figure 30: Scenario 1 – High Chinese Demand, High US Production Response ................................39
Figure 31: Scenario 2 – Low Chinese Demand, High US Production Response .................................40
Figure 32: Scenario 3 – Low Chinese Demand, Low US Production Response..................................41
Figure 33: Scenario 4 – High Chinese Demand, Low US Production Response .................................42
Figure 34: Scenario Outcomes .............................................................................................................43
Figure 35: Indicative Regional Price Paths 2010 – 2030, Scenario 1 ..................................................43
Figure 36: Indicative Regional Price Paths 2010 – 2030, Scenarios 2 and 3.......................................44
Figure 37: Indicative Regional Price Paths 2010 – 2030, Scenario 2 with Price War ..........................45
Figure 38: Indicative Regional Price Paths 2010 – 2030, Scenario 2 with Intense Price War .............46
Figure 39: Indicative Regional Price Paths 2010 – 2030, Scenario 4 ..................................................47
Figure 40: Schematic of a Typical European Gas Industry in the Monopoly Era .................................50
Figure 41: Prices Paid by Industrial Customers in Britain and Major Continental European Gas
Markets 1990-2013, $/MWh..................................................................................................................55
Figure 42: Prices Paid by Residential/Commercial Customers in Britain and Major Continental
European Gas Markets 1990-2013, $/MWh .........................................................................................56
Figure 43: Schematic of a Continental European Market with an Established Gas Hub .....................61
Figure 44: Range of Traded Contracts at NBP, March 2014................................................................69

December 2014: The Dynamics of a Liberalised European Gas Market                                                                                             v
Tables

Table 1: Share of Gasoil in Total Energy Consumption of Stationary Sectors, 2004 (%) ....................10
Table 2: Share of Residual Fuel Oil in Total Energy Consumption of Stationary Sectors, 2004 (%) ...10
Table 3: Share of Gas in Total Energy Consumption of Stationary Sectors, 2004 (%) ........................11
Table 4: European Wholesale Gas Pricing 2013 (%) ...........................................................................18

December 2014: The Dynamics of a Liberalised European Gas Market                                                            vi
Introduction
The OIES Gas Programme has published several papers on the transition from oil-indexation to hub-
based pricing in the UK and Continental Europe, and in 2012 a book on ‘The Pricing of Internationally
Traded Gas’; earlier this year we published a study on the challenges for JCC pricing in Asian LNG
markets.1 The Programme has also published a paper showing how the arbitrage of flexible LNG
supply has the potential to transmit price signals between regional gas markets. 2 We have also
published papers on the future of gas demand in Europe, and the ongoing national and EU regulatory
developments.3
This paper represents both a continuation of, and a departure from our previous publications on
European gas. It is a continuation in respect of the focus on the determinants of European hub prices
and how these have changed, and are likely to continue to change, over time. The departure from
previous work is that for the first time we are attempting to understand the implications of the
changing commercial landscape for the key market players themselves.
A challenge of such an approach is that stakeholder business models and strategies are influenced
by drivers in a number of dimensions. These include ongoing supply and demand dynamics, physical
supply chain configuration, evolving regulatory framework, competition with peers, price formation
mechanisms and risk management. We have chosen to focus this paper on three specific questions
about which major European gas industry players are seeking clarification:
What are the key determinants of hub pricing?
How have the roles of major players in the liberalised gas market changed and how may
these evolve in the future? And, related to this.
What are the new risks to which major players in the liberalised gas market are exposed, and
how can they deal with these risks?
This paper aims to illuminate these aspects of market transition which can be viewed as a challenge,
an opportunity, or a threat but certainly require changes of behaviour from all major market players.
There is a temptation to characterise the historical and future development of European gas markets
from monopoly to competition in terms of specific time periods. This is analytically problematic –
because national and EU developments often refuse to fit into neat time periods. In this paper we
have used only two time periods, before and after 2008. The reason for this is our proposition that
2008 can be viewed as the start of serious gas hub development in Continental Europe, and the point
at which the EU authorities decided that more radical action needed to be taken to liberalise gas (and
power) markets.
The paper is structured in three chapters. Chapter 1 looks at European price evolution and the key
determinants of hub pricing. Chapter 2 examines the changing roles and risks facing the three key
groups of gas market players: producers and exporters, midstream energy trading companies, and
local distribution companies. Chapter 3 provides a summary of the arguments, and some conclusions
on: the determinants of hub pricing; the roles of, and risks facing, the different groups of gas market
players; and the implications for contractual frameworks and business models in the gas sector.
1
Heather (2010) and (2012); Petrovich (2013); Stern (2007), (2009) and (2012); Stern and Rogers (2011); Rogers and Stern
(2014).
2
Rogers (2012).
3
Honoré (2014), Haase (2008) and Yafimava (2013).
1
December 2014: The Dynamics of a Liberalised European Gas Market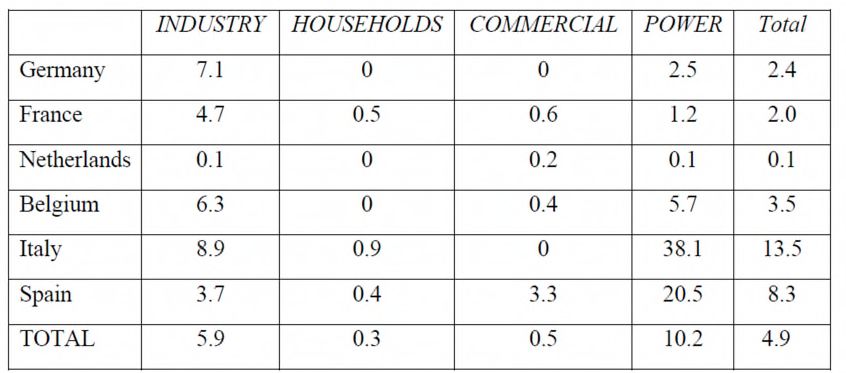
Chapter 1: European Gas Price Evolution: what are the key determinants of
hub pricing?
1.1 The Historical Context
Town gas (or coal gas4) had been in domestic and industrial use since the mid to late 1800s, but the
European natural gas industry was not effectively launched until the discovery of the giant Groningen
gas field in northern Holland in 1959.5 All other large-scale European gas imports from the Former
Soviet Union (FSU), Algeria and Norway which followed in subsequent decades were strongly
influenced by the commercial, specifically the pricing, framework for Dutch gas exports to
neighbouring countries6.
The emergence in the 1960s and 1970s of natural gas as a major new fuel/energy source in north
west and central Europe, with advantages for the domestic consumer of convenience relative to coal
and oil products, came some decades after its debut in North America earlier in the 20th century. Gas
in Europe was different in other respects however. Markets were national, albeit with a high reliance
on imported gas with flows often transiting neighbouring countries. In the development of national gas
markets there was a requirement for large, creditworthy buyers to commit contractually to agreed
volumes of gas in order to underwrite the development of upstream producing gas fields, the
transportation infrastructure from those field locations to markets, and the storage and distribution
infrastructure required to deliver to customers. The primary risk in those early days was that growth in
gas consumption would be less than the volumes contracted, either due to uncompetitive price levels
relative to alternative fuels, or that economic growth itself would be insufficient to lift demand for gas.
Due to its low energy density, gas is expensive to transport and store, compared with oil products and
coal. Similarly from an institutional perspective, gas is a rather complex energy resource which gave
rise to complicated industrial organisational arrangements throughout Europe. This was mainly due
to the commercial and national interests at stake for both gas producing and consuming countries.
Gas resources are valuable but only Norway, Britain, the Netherlands and Denmark have had (at
different times and for different durations) sufficient resources to satisfy domestic consumption and
produce an export surplus. It took significant investments in pipeline infrastructure to connect the few
European production centres with all regional centres of consumption. These investments gave way
to specific transactional relations between suppliers and consumers of gas in the form of long term
contracts which were legally binding and subject to international arbitration.
In the Continental European context this was addressed by a long term gas contract in which pricing
terms were related to oil products with periodic (usually three year) price reviews (or “re-openers”) and
an Annual Contract Quantity (ACQ) with a minimum Take or Pay (TOP) level set typically at 80-90%
of the ACQ level. In this way the ‘Seller took the Price Risk’ and the ‘Buyer took the Volume Risk’.7
Price risk was reduced by a (three month) lag in applying the adjustment of (mainly) oil product prices
averaged over the previous 6-9 months, to the gas price, hence largely eliminating volatility.
The dilemma posed by Groningen was that, being a large onshore discovery, its costs of development
and production were low. Accordingly, instead of a ‘cost plus’ pricing approach, the ‘market value
principle’ was adopted in which the price paid for the gas was negotiated based on the weighted
average value of the gas in competition with other fuels, principally oil products, adjusted to allow for

4
 A mixture of hydrogen, carbon monoxide, methane and volatile hydrocarbons made by reacting coal or coke with air and
steam at high temperature.
5
    Correlje et al. (2003) pp.26-37.
6
    Stern, (2012), p. 55.
7
    More details can be found in Stern (2012a), especially pp. 55-9.

                                                                                                                        2
      December 2014: The Dynamics of a Liberalised European Gas Market
transportation and storage costs. This allowed Shell, Exxon and the Dutch government to obtain
much higher revenues than via a ‘cost plus’ approach, and also ensured a more gradual displacement
of oil products in sectors where gas increased its market share.8
In contrast to the oil-related price mechanisms used in continental OECD Europe, from the 1970s
pricing in Britain between diverse producers and the state monopoly British Gas Corporation (BGC)
adopted various forms. All notable UK gas discoveries were situated offshore and the cost base was
higher than that of the Dutch Groningen field. Negotiations therefore focussed on a price which left
the producer with a ‘reasonable’ rate of return after taking into account a requirement (in the case of
the early southern North Sea fields) to provide a high seasonal ‘swing factor’. This required production
facilities and transportation infrastructure to be sized for flows significantly higher than average
offtakes. In this way, Britain avoided the need to build seasonal storage facilities in the early era of
developing its natural gas business. The field-specific sales and purchase contracts signed between
field producers and BGC (often termed ‘depletion contracts’) – similar to the Continental European
long term take or pay contracts but without the periodic price reviews - included an initial price with
provisions for indexation generally related to cost inflation rather than to competing fuels.9 The cost
plus mechanism, at least in the early days of ‘North Sea Gas’ development allowed gas a significant
competitive advantage over oil products and was accompanied by a large scale programme of
converting all domestic appliances from town gas or coal gas to natural gas.10 This subsequently set
the scene for growth in gas-fired domestic space heating as the rapid economic growth of the 1960s
brought this within household affordability.
Despite initial uncertainties, the growth of the European natural gas industry was successful beyond
the expectations of any demand forecast in the 1970s. Figure 1 shows that the industry enjoyed a
near-continuous growth in demand to 2005 with a five-fold growth in gas consumption in the
European region 11 from 1970 to 2008. In addition to general economic growth, this is largely
accounted for by the displacement of coal and oil products in residential and commercial space
heating and, post 1990, the displacement of coal and oil products in power generation. The growing
reliance on pipeline and LNG imports throughout the period is apparent.

8
    For details of the history and evolution of the Dutch pricing regime see Correljé et al. (2003) pp.89-100.
9
    Stern (2012), p. 60.
10
     For details of UK pricing see Stern (2012), especially pp.59-61.
11
     The European region is here defined as 30 countries, see note to Figure 1.

                                                                                                                 3
      December 2014: The Dynamics of a Liberalised European Gas Market
Figure 1: European Demand and Supply Sources: 1970 – 2013
                      600

                      500

                                                                                                   LNG
                      400                                                                          Azerbaijan
                                                                                                   Iran
               BCMA

                      300                                                                          Libya
                                                                                                   Algeria
                                                                                                   Russia
                      200
                                                                                                   Production
                                                                                                   Demand
                      100

                       0
                            1970 1975 1980 1985 1990 1995 2000 2005 2010 2013
Notes: The European region is here defined as: Austria, Belgium, Bulgaria, Croatia, Czech Republic, Denmark,
Estonia, Finland, France, Germany, Greece, Hungary, Ireland, Italy, Latvia, Lithuania, Luxembourg, Netherlands,
Norway, Poland, Portugal, Romania, Serbia, Slovakia, Slovenia, Spain, Sweden, Switzerland, Turkey, UK.
Data inconsistencies account for balancing errors in some years, including lack of FSU individual country data
before 1990.
Source: BP Statistical Review of World Energy

This was an industry which, by 2005, had enjoyed 35 years of growth and had prepared for similar –
albeit perhaps not such strong – growth in the following two decades, although as Figure 1 shows and
as we shall see below (Section 1.3), expectations that these trends would continue have been proved
substantially wrong.

1.2 The Period Prior to Continental European Hub Pricing
European wholesale price dynamics
Taking Germany as a proxy for north west Continental Europe, and a point of comparison with Britain,
Figure 2 shows four price series: the average German import (BAFA) gas price from 1983 12; the
British National Balancing Point (NBP) Heren index price from 1996 (when the hub was created); the
price of BG’s industrial interruptible contract (as a proxy for the lowest price available from the
monopoly supplier) from 1993; and the Brent crude oil price.13

12
 Otherwise known as the German Border price. For many years BAFA was the only officially published data on gas prices in
Continental Europe. See Glossary for more detail.
13
     This is the earliest data available from the DECC website.

                                                                                                                           4
      December 2014: The Dynamics of a Liberalised European Gas Market
Figure 2: British and German Wholesale Gas and Crude Oil Prices – 1984 to 2013
20
18
16
14
12
$/mmbtu
10
8
6
4
2
0
1984 1989 1994 1999 2004 2009
UK Industrial Interruptible NBP German Border Crude Oil (OECD cif)
Sources: BP Statistical Review of World Energy 2014, p.27. ‘Annual Prices of Fuel purchased by Manufacturing
Industry’, DECC, https://www.gov.uk/government/statistical-data-sets/prices-of-fuels-purchased-by-
manufacturing-industry
With the liberalisation of the British market and the creation of the NBP as a trading hub in 1996 –
more than a decade before Continental European hubs became a significant price setting mechanism
- NBP prices were fundamentally driven by gas supply and demand.14 But with the commissioning of
the Interconnector (IUK) pipeline in 1998, Continental European oil-linked long term contact prices
had an important influence on Britain. It should be noted that, up to the mid 2000s, in addition to gas
traded on NBP, there was still a significant quantity of physical gas sold under ‘legacy’ contracts in
which price was indexed to inflation and a variety of fuel and commodity indices.15
German import prices, in the period up to 2007, referred almost entirely to gas sold under long term
contracts with Russia, Norway and the Netherlands in which the price formation mechanism was
indexation to oil products. In Figure 2 the lagged relationship between crude oil (and by inference oil
products prices) and border gas prices is evident, at least until 2009. Although the German border
price was based on many individual contracts, with some variation in specific price formula variables,
the linkage to oil product prices appears to have been reasonably consistent.
14
For a full account of the evolution of hub pricing in Britain see: Wright (2006), Chapters 3 and 4; and Heather (2010).
15
Heather (2010), p.30.
5
December 2014: The Dynamics of a Liberalised European Gas MarketFigure 3: German Border Price and Fitted Formula: 2001-11
40
35
30
25
€/MWh
20
15
10
5
0
Dec-01 Dec-02 Dec-03 Dec-04 Dec-05 Dec-06 Dec-07 Dec-08 Dec-09 Dec-10 Dec-11
Fitted Formula German Border Price
Source: BAFA, Platts, Author’s Calculations
Figure 3 shows the comparison of the following ‘best fit’ formula with the official average German
border price (BAFA): price in month (€/MWh) = 2.273 +0.025977*(average of previous 9 months gas
oil prices in €/tonne) + 0.029224*(average of previous 9 months fuel oil prices in €/tonne).
The match is very good until early 2009, and the reasonable fit even over the 2008 peak confirms that
the oil product price formula was a good approximation of the German gas price to the end of 2008.
The reasons for the divergence post 2008 are discussed below.
European wholesale prices in an international context
Figure 4 shows European and other international gas prices with the (Brent) crude oil price for
reference for the period 2001-08. During this period, crude prices (apart from a respite in the second
half of 2006) trended upwards, prior to their peak and subsequent collapse in the second half of 2008.
The gas prices linked formulaically to crude oil or oil product prices (Japanese LNG prices and
German border prices respectively) followed the crude oil price trend with a lag.
6
December 2014: The Dynamics of a Liberalised European Gas MarketFigure 4: Monthly International Gas and Brent Crude Oil Prices: 2001-08
60
50
40
NBP
€/MWh
30 Henry Hub
German Border
Japanese cif LNG
Brent
20
10
0
Sources: Argus, EIA, Platts, BAFA
US Henry Hub prices exhibited different dynamics. During the early 2000s Henry Hub trended
upwards due to a downward trend in domestic gas production, which at times led to inter-fuel
competition between gas and fuel-oil in power generation – at a time when oil and oil products prices
were rising. The mid-2005 peak in Henry Hub prices was caused by the temporary shut-down of
offshore gas production due to hurricane Katrina, at a time when the market for flexible LNG tightened
(due to Japanese nuclear shutdowns and the decline in Indonesian LNG production). The advent of
US shale gas production on a large scale began to alleviate US domestic production concerns post
2006, although the pre-financial crisis ‘commodities bull-run’ served to raise Henry Hub price in the
first half of 2008.16
Interactions between British and Continental European markets
In October 1998 the Bacton Zeebrugge Interconnector pipeline (IUK) commenced operation,
connecting the newly liberalised British gas market with Continental Europe.17 The pipeline is able to
switch its flow direction in response to the nominations of its capacity owners. Figure 5 shows the
daily flows through this pipeline between October 1998 and June 2009.
16
For details see Foss (2007) and Foss (2011).
17
For a history of IUK see Futyan (2006).
7
December 2014: The Dynamics of a Liberalised European Gas MarketFigure 5: Bacton-Zeebrugge Interconnector Daily Pipeline Flows 1998 - 2009
(+ = export from UK, = import to UK)
80
60
40
million cm/day
20
0
01/10/1998
01/10/1999
01/10/2000
01/10/2001
01/10/2002
01/10/2003
01/10/2004
01/10/2005
01/10/2006
01/10/2007
01/10/2008
-20
-40
-60
Source: IUK
The flow pattern is one of significant summer export from Britain during the summer periods from
1998 to 2006. 18 During the same period the winter seasons saw imports coming into Britain from
Continental Europe. The underlying explanation for this dynamic was the relatively low provision of
seasonal gas storage in Britain as its old ‘swing’ fields declined.
Following the opening of the IUK, NBP and Continental oil-indexed gas prices were reasonably well
correlated through to the spring of 2001 (Figure 6). The years 2001-03 were characterised by
reasonably close price correlation during the winter months but with NBP de-linking and falling during
the summer. Summer export volumes peaked in 2003, with the decline in subsequent years driven by
the reduction in UK domestic production. From 2004 onwards, evidence of increasing supply
tightness is apparent, and winter imports increased through to the end of 2005. In 2004 and early
2005 there is close correlation between the NBP and continental prices, but in 4Q05 NBP de-links
and soars to unprecedented price levels (also shown in Figure 4).
18
The dip in summer 2002 was due to the pipeline being shut down due to operational problems.
8
December 2014: The Dynamics of a Liberalised European Gas MarketFigure 6: NBP Day Ahead Spot Prices and German Average Import Gas (BAFA) Prices January
1997 – December 2009 (Monthly Averages)
16 Convergence periods
14
12
10
Interconnector Opens
$/mmbtu
8
6
4
2
0
German Border Price NBP
Sources: Platts, BAFA
The NBP price peak in 2005/2006 was a consequence of the loss of the key Rough storage facility
during winter months and the lack of sufficient IUK import flows in response to high British prices
(partly as a consequence of Continental European storage operators being constrained by public
service obligations and lack of availability of short term transportation capacity). The advent of higher
Norwegian imports via the Langeled pipeline in 2007 reduced prices prior to the pre-crisis commodity
bull-run dynamic in 2008. Additional supplies from Norway stabilized the trend of reducing summer
exports and growing winter imports through the IUK.
The declining rationale of Continental European oil-indexed gas pricing19
The rationale for oil-linked gas pricing is that natural gas and oil are substitutable in both the short and
the longer term. Price formulae were designed to ensure that the customer base continued to burn
gas rather than returning to oil products since the majority of customers had switched from oil
products to gas and, given a price incentive, retained the ability to switch back. If customers switched
back to oil in large numbers, this would not only deprive gas importers of their market, but force them
to incur take-or-pay penalties in their contracts with exporters. To argue that gas prices should
continue to be indexed to oil products, it must be possible to demonstrate that:
• in the short term, customers have the capability and incentive to switch existing plant from
gas to oil and back again in response to price signals;
• in the long term, customers building new plant (or replacing fuel burning equipment in old
plant) will choose to install fuel burning equipment which is principally oil-fired, or equipment
which is principally gas-fired but with the option of burning gas or oil products, or a plant with
the capacity to switch between the two fuels.
19
What follows is a brief summary of the arguments in Stern (2007) and Stern (2009).
9
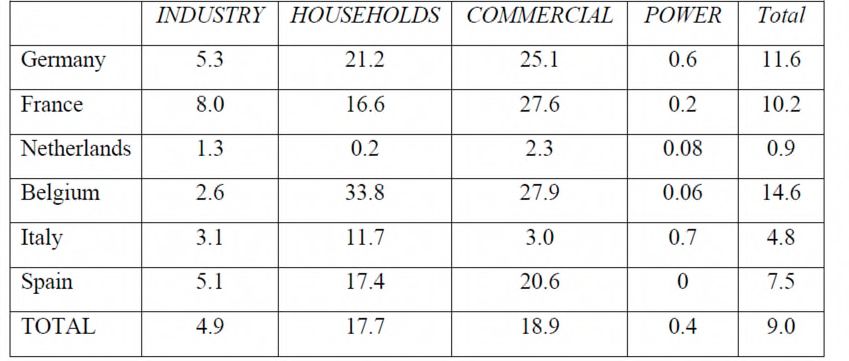
December 2014: The Dynamics of a Liberalised European Gas MarketTables 1–3 show the share of gas and its two main competing oil products – gasoil and residual fuel
oil – in the energy mix of the four main stationary energy markets in Europe in 2004.20 The following
features stand out from these tables:
• gasoil had been eliminated from power markets in all countries; in the industrial sector, the
fuel’s share was only significant in France (8%) with Germany being the next highest at just
over 5% (see Table 1).
• household consumption of gasoil remained significant in all countries other than the
Netherlands, ranging from 12% of residential energy demand in Italy to a surprising 34% in
Belgium.
• in the commercial sector, the share of gasoil was higher than in the residential sector in all
countries, other than Belgium and Italy, and was significant in all countries (other than
Netherlands and Italy) ranging from 19 to 28% of fuel use.
Table 1: Share of Gasoil in Total Energy Consumption of Stationary Sectors, 2004 (%)
Source: Stern (2007), Table 5.
Table 2: Share of Residual Fuel Oil in Total Energy Consumption of Stationary Sectors, 2004
(%)
Source: Stern (2007), Table 6.
20
Tables 1-3 are taken from Stern (2007); the data was updated in Stern (2009), Appendix A which demonstrated that the trend
towards eliminating oil products from the stationary sectors was continuing.
10
December 2014: The Dynamics of a Liberalised European Gas MarketResidual fuel oil had largely been driven out of all sectors other than power with the largest remaining
shares being between 7 and 9% in the German and Italian industrial sectors (see Table 2). In the
power sector, the only significant remaining shares were in Spain and Italy.
Table 3: Share of Gas in Total Energy Consumption of Stationary Sectors, 2004 (%)
Source: Stern (2007), Table 7.
Gas had a very substantial share of all stationary sectors in all countries with the exception of power
in France (because of the preponderance of nuclear power) and the commercial sector in Spain
(Table 3). The share of power was relatively low at 20 percent in Germany (because of coal) and in
Spain; likewise the share of gas in the Spanish household sector would rise as the network expanded.
Elsewhere gas had a 30–45% share of stationary fuel demand with exceptionally high penetration in
the Dutch household sector.
Thus, well before the arrival of hub pricing in Continental Europe , the rationale for pricing gas in
relation to oil had become increasingly questionable as gas had displaced oil (on a virtually
irreversible basis) in the domestic and power generation sectors. In Continental gas markets
familiarity with, and profitability of, the oil-indexed pricing system created inertia which allowed for a
continuation of the status quo; but this was to change post 2008.
1.3 The Arrival of Hub Pricing
Continental Europe - the ‘Perfect Storm’
As the post-financial crisis hit economic activity towards the end of 2008, European gas demand fell.
Demand in 2009 was 5.7% below its 2008 level and although it recovered in 2010, this was in large
part due to abnormally cold weather.21 By 2013, demand in 35 European countries was just over 528
Bcm, 66 Bcm and more than 11% below 2008 levels; demand in the seven major European gas
markets (excepting Turkey) remained 5-26% below pre-recession levels. During 2008-13, despite a
gradual improvement in economic growth, loss of market share to renewables and coal in the power
sector continued to depress the outlook for gas demand, although the detailed reasons for, and
relative importance of, these impacts varies by country.22
21
For an account of gas demand in the immediate post-recession period see Honoré (2011a).
22
Honoré (2014), p.71. This study contains an in-depth analysis of historical and future European gas demand.
11
December 2014: The Dynamics of a Liberalised European Gas MarketNew LNG supplies from Qatar, Yemen, Russia, Peru and Indonesia came on stream between 2009 -
12 adding some 100 Bcma to global supply. Some of this new supply had originally been intended for
the US market, but the remarkable and unforeseen growth in shale gas production resulted in it
becoming surplus to US requirements. Although much was absorbed by the robust rebound in Asian
LNG demand from 2010 onwards, and by new markets in South America and the Middle East, some
30 Bcma of additional LNG flowed into Europe in 2010 and 2011. This surge of uncontracted gas
supply, much of it flowing via Britain into the north west European trading hubs, substantially
increased their liquidity. This coincided with sustained effort on the part of the Dutch regulator, system
operator and main domestic gas producer to launch the TTF as a successful hub and the embodiment
of the ‘Dutch Gas Roundabout’ concept in a newly liberalised market paradigm.23 Also the north west
European utility companies appeared to be undergoing a generational ‘mind-set change’ as younger
staff, familiar and comfortable with traded markets, rose to senior positions.
The plight of the midstream utilities
Not only had demand fallen and available supply increased, but long term contract gas prices were
rising rapidly driven by oil prices increasing to more than $100/bbl. These changes to European gas
fundamentals were especially unwelcome to the midstream utilities in north west Europe who were
caught in the unenviable position of being obliged to buy high-priced, oil-indexed gas under their long
term contracts, but increasingly forced to sell at hub-based prices demanded by their customers. The
rise of the north west European hubs, with transparent prices available on the internet, and legal
rulings which freed customers from multi-year purchase agreements for gas at oil-indexed prices,
heralded a fundamental challenge to the midstream utility business model (see Chapter 2).24 With the
progressive merger of gas and power utilities, management of the newly combined entities became
increasingly influenced by concepts such as ‘mark to market’25 and, to this mind-set, long term oil-
indexed contracts represented a potentially unbounded future liability. With some utilities losing
around €1 billion/year in gas trading operations, their commercial position was rapidly becoming
unsustainable.26
At the Offshore Northern Seas conference of 2010 the new CEO of E.ON Ruhrgas, Klaus Schafer
announced that: ‘Hubs are the reference point when customers talk to us …LTCs in their current form
no longer reflect the market….We have to re-engineer the LTCs to anticipate the future needs of the
market: price levels, indexation and review mechanism’27 This was the starting point of a series of
renegotiations of long term contract prices – many of which required international arbitration
proceedings to resolve – which are still ongoing at the time of writing. Summarising a very complex
(and still unfolding) picture, by 2013 Statoil and Gasterra had both appeared to embrace the new gas
market paradigm in north west Europe by agreeing to move long term contracts to hub prices where
competitive markets existed. 28 But the cases of Gazprom and Sonatrach were fundamentally
different.
23
The details of this are set out in Heather (2012), pp. 7-11.
24
See for example in the case of Germany: German Energy Blog, 24th March 2010:’BGH Declares Oil Price Linkage in Gas
Contracts Void’: see article at: http://www.germanenergyblog.de/?p-2278. BGH ruling 61/2010, can be accessed at:
http://juris.bundesgerichtshof.de/cgi-
bin/rechtsprechung/document.py?Gericht=bgh&Art=pm&Datum=2010&Sort=3&nr=51371&pos=2&anz=63
25
The accounting act of recording the price or value of a security, portfolio or account to reflect its current market value rather
than its book value
26
E.ON claimed that its long term contracts were responsible for its gas trading losing €1 billion in 2011.
http://millicentmedia.com/2011/08/12/germanys-giant-utilities-are-posting-losses-and-slashing-jobs-what%E2%80%99s-going-
on/
27
The video of the presentation is unfortunately no longer on the ONS website, but see: `EON Ruhrgas seeks gas contract
reform’, Platts European Gas Daily, August 26, 2010, pp. 1-2.
28
A detailed analysis can be found in Stern and Rogers (2011) and Stern and Rogers (2012).
12
December 2014: The Dynamics of a Liberalised European Gas MarketSonatrach, having won an earlier arbitral case against Gas Natural in 2010, felt justified in continuing
to insist on the retention of oil indexation for customers in Spain and Italy.29 However the company’s
failure to maintain gas production to keep pace with (heavily subsidised domestic downstream pricing
and hence) burgeoning domestic demand has left the company short of gas supplies. As a result, it
has shown willingness to relax take or pay obligations, but a reluctance to compromise on oil-linked
prices in long term contracts. Algeria’s price maximisation strategy in Europe reflects its lack of
available gas to export, lack of pressing need for additional revenues, and ability to divert its LNG
exports from Europe to higher priced markets in Asia.30
By contrast, Gazprom’s price-volume strategy is one of the key determinants of the ‘new world order’
in global gas dynamics, and is not straightforward. The company had been in negotiations, often
leading to arbitrations, with its European pipeline gas customers under long term oil-indexed contracts
from 2010. Two stages of negotiations can be identified:31
• 2009-12 where customers were obliged to pay for minimum contract quantities at oil-linked
price formulae but could purchase additional volumes at hub prices;
• 2012-14 where, although oil indexation remained in the price formula, the company agreed
with individual buyers a complicated mix of base price (P zero) reductions and rebates on
prices paid under the contract formula relative to hub prices.
In many contracts TOP levels were reduced from 85 to 70%.
Many of the arbitral decisions which were made public during 2012-13 found that the spot price (either
at hubs or for LNG cargoes) should be considered at least part of the market price in existing long
term contracts.32 It may be a reasonable generalisation to say that arbitral decisions on long term
contract gas prices in the post-2012 period, have ruled that at least some element of hub pricing
should be included in the price formula, and that the share of hub pricing should increase with time.
The rise of the hubs and the spread of hub pricing
Following the creation of NBP in 1996, there were a number of `false starts’ for Continental European
hubs: the Zeebrugge hub in 2000, was followed by EuroHub and NWE-Hubco in 2002. All appeared
to be intended by incumbents to frustrate gas trading rather than to promote it.33 It was not until the
creation of the Title Transfer Facility (TTF) by Gasunie in 2003, followed by Central European Gas
Hub in 2005 and the two German hubs – Net Connect Germany (NCG in South Germany) and
Gaspool (North Germany) in 2009 – that the incumbent European companies became serious about
facilitating gas trading.34
As mentioned above, the rise of the Continental European hubs was catalysed by the arrival of spot-
priced LNG overflowing from Britain into north west Europe. The volumes of gas traded have
increased significantly during this period as shown in Figures 7-10.
29
`Gas Natural loses Sonatrach dispute’, Platts, European Gas Daily, August 18, 2010, p.2;
30
For background see Darbouche (2011); for the more recent period see Stern ed. (2014), pp.17-21.
31
This is explained in detail in Stern (2014).
32
Arbitral decisions are confidential, so we cannot be certain. This information is from press reports which cannot be verified.
But for example: Edison received €450 million from Rasgas (in relation to its long term LNG contract during 2010/11); in
October 2012 Edison received €250 million from ENI (in relation to gas from ENI’s long term contract with Libya); in May 2013,
Edison received €200million from Sonatrach; in July 2013, a tribunal awarded RWE a payment of €1.6billion from Gazprom and
a share of hub pricing in the long term contract formula.
33
Eurohub was set up in 2002 by Gasunie to facilitate trade between the company’s flanges at Bunde-Oude (on the Dutch-
German border) and Emden (on the north German coast). NWE-Hubco was launched as a rival to Eurohub by Ruhrgas, BEB
and Statoil. In 2004 the two agreed to merge but finally ceased trading in 2006.
34
For the history of how these hubs emerged see Heather (2012), Chapter 3. This source also covers the other major hubs, the
French Points D’Échange de Gaz (PEGs) set up in 2003 and the Italian Punto di Scambio Virtuale (PSV) in 2004.
13
December 2014: The Dynamics of a Liberalised European Gas MarketFigure 7: Gas Volumes Traded, OTC Day Ahead 2007 – October 2013 (TWh)
ZEE NCG GSL PEG CEGH PSV NBP TTF
140 350
120 300
100 250
80 200
TWh
60 150
40 100
20 50
0 0
2007 2008 2009 2010 2011 2012 2013 2007 2008 2009 2010 2011 2012 2013
Source: Tankard Parties (ICAP Energy Limited, Tullett Prebon (Europe) Limited, Spectron Energy Services
Limited)
Figure 8: Gas Volumes Traded, OTC, Month Ahead, 2007 – October 2013 (TWh)
Source: Tankard Parties (ICAP Energy Limited, Tullett Prebon (Europe) Limited, Spectron Energy Services
Limited)
14
December 2014: The Dynamics of a Liberalised European Gas MarketFigure 9: Exchange Traded Volumes, Day Ahead, (TWh)
ZEE TTF PEG GSL NCG CEGH
30
25
20
15
TWh
10
5
0
2007 2008 2009 2010 2011 2012 2013
Source: ICE-ENDEX, EEX, Powernext, CEGH Gas Exchange
Figure 10: Exchange Traded Volumes, Month Ahead (TWh)
As Petrovich (2013) and Heather (2012) have shown, traded volumes of gas on the main Continental
European traded hubs have increased substantially since 2007 and both TTF and NBP can be
15
December 2014: The Dynamics of a Liberalised European Gas Marketregarded as mature liquid hubs. Although comparable data to that shown in Figure 10 is not available
for 2012 and 2013, exchange-traded volumes for all contracts other than within day and day ahead in
general increased strongly in 2012 compared with 2011. In 2013 however, NBP and TTF exchange-
traded volumes were some 12.6% and 7.4% below those of 2012 respectively35. It is also of note that
TTF OTC volumes for 2014 up to October have exceeded those of NBP36.
Figure 11: European Hub Price Correlation Month Ahead Contracts January 2012 – December
2013
Source: ICIS, Heather (OIES)
Figure 11 shows the daily month-ahead contract prices for all the main European hubs for 2012 and
2013. Prices have generally been well correlated but it has been observed however that in some
periods there has been significant price de-linkage when price correlations are assessed
quantitatively. The most significant of these are:37
In 2011 NBP at times de-linked from TTF and other NW European hubs. Further investigation
revealed that this was overwhelmingly due to IUK capacity congestion and maintenance
outages;
PEG Sud and PEG Nord at times de-link from the other continental hubs. This is thought to
be due to physical north – south pipeline capacity constraints in France (especially at times of
low LNG delivery in the Fos area) and also possibly due to low liquidity at PEG Nord;
35
For data and further analysis see Heather, P. (2015) forthcoming.
36
London Energy Broker’s Association Monthly OTC Energy Volume Report, October 2014.
37
These are conclusions from Petrovich (2013) and Petrovich (2014 forthcoming).
16
December 2014: The Dynamics of a Liberalised European Gas Market PSV and at times CEGH have de-linked from the north west European hubs. This was
certainly the case prior to 2012 when these hubs were at an early stage of development.
Price correlation was good in late 2012, but in 2013 both hubs saw lower correlation metrics.
This is thought to be due to physical and/or contractual congestion in infrastructure linking
Italy and Austria to the NW European hubs.
Most importantly, Figure 11 shows no evidence of `manipulation’ – defined as the ability of dominant
players in national markets to impact prices over a long period of time – which had been one of the
main reservations of those opposing a move to hub-based pricing.38
The increase in the importance of hub pricing at the expense of oil-linked pricing over the period
2005-13 is shown in Figure 12. In 2005, nearly 80% of the gas sold in Europe was priced in relation to
oil (OPE), and only around 15% in relation to gas on gas competition (GOG), or market prices at
hubs. By 2013, gas priced in relation to oil had fallen to just over 40% and more than 50% of gas was
market priced. This is a remarkable transformation over an 8-year period and the trajectory of change
in Figure 12 shows no signs of slowing down. It needs to be emphasised that the survey data are
collected from the gas industries in individual countries; hence they are not based on models or
estimates but on real data provided by gas companies.39
Figure 12: European Price Formation 2005-13
90%
80%
70%
60%
50%
40%
30%
20%
10%
0%
OPE GOG BIM NET RCS RSP RBC NP NK
2005 2007 2009 2010 2012 2013
Note: a full description of the price formation mechanisms : OPE, GOG, RCS and RSP can be found on p.7 of the
source.
Source: IGU (2014), Figure 1.3, p.8.
38
This is different to the definition of that term in Article 2 of the EU REMIT Directive which states that a company or individual
which, “gives, or is likely to give, false or misleading signals as to the supply of, demand for, or price of wholesale energy
products”, may be guilty of market manipulation. REMIT (2011).
39
For information on data collection and analysis see IGU (2014), pp.10-13.
17
December 2014: The Dynamics of a Liberalised European Gas MarketTable 4: European Wholesale Gas Pricing 2013 (%)
REGION Oil Price Gas on Gas Regulated Cost of Regulated Social
(approximate % of Escalation (OPE Competition Price Service Price Price (RSP)
total european = oil-linked (GOG = hub (RCS)
demand) pricing in long price)
term contracts)
NORTH WEST 20 80
EUROPE (50%)
CENTRAL 35 50 15
EUROPE (10%)
MEDITERRANEAN 85 15
EUROPE (30%)
SOUTH EAST 41 47 12
EUROPE (10%)
Note: A full description of the price formation mechanisms: OPE, GOG, RCS and RSP can be found on p.7 of the
source. North West Europe: Belgium, Denmark, France, Germany, Ireland, Netherlands, UK. Central Europe:
Austria, Czech Republic, Hungary, Poland, Slovakia, Switzerland. Mediterranean Europe: Greece, Italy,
Portugal, Spain, Turkey. South East Europe: Bosnia, Bulgaria, Croatia, FYROM, Romania, Serbia, Slovenia.
Source: IGU (2014), pp. 26-27.
However, Table 4 demonstrates that very different price formation mechanisms operate across
different European regions: north west Europe is clearly dominated by hub-pricing, but only 15% of
gas is sold at hub prices in the Mediterranean region (virtually all of which is in Italy) and none in
south east Europe. Half of central European gas is priced at hubs but still 35% in relation to oil.
The evolving relationship between long term contract oil-indexed prices and hub prices
In Figure 3 it was shown that the predictable relationship between lagged prices of gasoil and fuel oil
and the average border price of German gas imports broke down in early 2009. This might be
explained by a combination of price concessions negotiated with Gazprom and Dutch and Norwegian
sellers of gas under long term oil-indexed contracts; and the increasing impact of hub-priced gas
imports into Germany – probably from TTF. As trust in the BAFA price as a benchmark of European
oil-indexed prices waned, a number of different estimates emerged.
Figure 13 shows a range of these estimates. The green line is NBP (day ahead monthly average
price). The black line is the BAFA (the average German import) price. The red line is an estimate of
‘pure oil indexed pricing’ (and therefore matches BAFA pre-2009) based on a formula including
average gasoil and fuel oil prices (see Figure 3). The dashed red line is a 15% reduction of the solid
red line and is used by some commentators as an estimate of the Russian long term contract price
following the reductions described above. The yellow line is an estimate of Russian gas price at the
European border used by the IMF.40 The blue line is the quarterly price received by Gazprom for gas
delivered to Europe (calculated by OIES) based on the company’s financial information; and the pink
line the results of a similar calculation by Société Générale.
40
Available at http://www.indexmundi.com/commodities/?commodity=russian-natural-gas
18
December 2014: The Dynamics of a Liberalised European Gas MarketYou can also read


