GLOBAL OUTLOOK - World Bank Group
←
→
Page content transcription
If your browser does not render page correctly, please read the page content below
CHAPTER 1

GLOBAL OUTLOOK

G LO BAL EC O NO MIC P ROS P EC TS | J U NE 2021                                                                     CHAPTER 1   3

The global economy is set to expand 5.6 percent in 2021—its strongest post-recession pace in 80 years. This
recovery is uneven and largely reflects sharp rebounds in some major economies—most notably the United
States, owing to substantial fiscal support—amid highly unequal vaccine access. In many emerging market and
developing economies (EMDEs), elevated COVID-19 caseloads, obstacles to vaccination, and a partial
withdrawal of macroeconomic support are offsetting some of the benefits of strengthening external demand and
elevated commodity prices. By 2022, global output will remain about 2 percent below pre-pandemic
projections, and per capita income losses incurred last year will not be fully unwound in about two-thirds of
EMDEs. The global outlook remains subject to significant downside risks, which include the possibility of large
COVID-19 waves in the context of new virus variants and financial stress amid high EMDE debt levels.
Controlling the pandemic at the global level will require more equitable vaccine distribution, especially for low-
income countries. The legacies of the pandemic exacerbate the challenges facing policy makers as they balance the
need to support the recovery while safeguarding price stability and fiscal sustainability. As the recovery becomes
more entrenched, policy makers also need to continue efforts toward promoting growth-enhancing reforms and
steering their economies onto a green, resilient, and inclusive development path.

Summary                                                               Growth in China remains solid but has moderated
                                                                      as authorities have shifted their focus from
Following a 3.5 percent contraction caused by the                     buttressing activity to reducing financial stability
COVID-19 pandemic in 2020, global economic                            risks. Many other countries, primarily EMDEs,
activity has gained significant momentum;                             are experiencing subdued pickups alongside surges
however, it remains well below pre-pandemic                           of COVID-19 cases, even if recent waves of
projections (figure 1.1.A). Moreover, the recovery                    infections appear to be less disruptive to economic
is uneven, passing over many poorer countries,                        activity than previous ones. Recoveries in fragile
and there is considerable uncertainty about its                       and conflict-affected LICs are particularly weak, as
durability.                                                           the pandemic has exacerbated underlying
                                                                      challenges. Whereas global manufacturing activity
The ongoing pandemic continues to shape the                           has firmed, with industrial production surpassing
path for global economic activity, with severe                        its pre-pandemic level, services activity—especially
outbreaks continuing to weigh on growth in many                       travel and tourism—remains soft.
countries. The most recent wave of COVID-19 is
now centered in some emerging market and                              Global financial conditions have tightened
developing economies (EMDEs), where more                              somewhat, partly reflecting a rise in U.S. bond
transmissible and virulent strains are spreading                      yields amid increased inflation pressures.
and where vaccine access remains limited (figure                      Nevertheless, they remain generally supportive,
1.1.B). Vaccination remains especially feeble in                      reflecting    continued    extraordinary     policy
low-income countries (LICs). In contrast,                             accommodation by major central banks.
advanced economies have generally seen sub-                           Commodity prices have increased markedly,
stantial vaccination progress, which has helped                       owing to the improving global outlook as well as
limit the spread of COVID-19.                                         commodity-specific supply factors. The recovery
                                                                      in global activity and in commodity prices is
Amid continued vaccination, economic activity is                      contributing to an increase in inflation, especially
firming across major advanced economies—most                          in some EMDEs that have experienced currency
notably in the United States, where the recovery is                   depreciation.
being powered by substantial fiscal support.
                                                                      Against this backdrop, global output growth is
                                                                      projected to strengthen to 5.6 percent in 2021—
                                                                      its strongest post-recession pace in 80 years (figure
    Note: This chapter was prepared by Carlos Arteta, Justin-Damien   1.1.C). The recovery is underpinned by steady but
Guénette, Patrick Kirby, and Collette Wheeler, with contributions
from Lucia Quaglietti, Sergiy Kasyanenko, Gene Kindberg-Hanlon,
                                                                      highly uneven global vaccination and the
Peter Nagle, Cedric Okou, and Ekaterine Vashakmadze.                  associated gradual relaxation of pandemic-control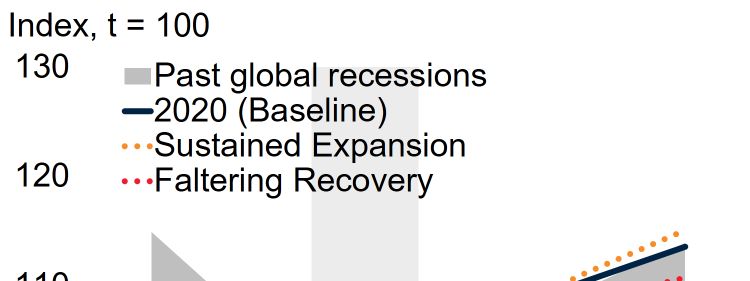
4 CHAPTER 1 G LO BAL EC O NO MIC P ROS P EC TS | J U NE 2021
Percentage point
TABLE 1.1 Real GDP1 differences from
(Percent change from previous year) January 2021 projections
2018 2019 2020e 2021f 2022f 2023f 2021f 2022f
World 3.2 2.5 -3.5 5.6 4.3 3.1 1.5 0.5
Advanced economies 2.3 1.6 -4.7 5.4 4.0 2.2 2.1 0.5
United States 3.0 2.2 -3.5 6.8 4.2 2.3 3.3 0.9
Euro area 1.9 1.3 -6.6 4.2 4.4 2.4 0.6 0.4
Japan 0.6 0.0 -4.7 2.9 2.6 1.0 0.4 0.3
Emerging market and developing economies 4.6 3.8 -1.7 6.0 4.7 4.4 0.8 0.4
East Asia and Pacific 6.5 5.8 1.2 7.7 5.3 5.2 0.3 0.1
China 6.8 6.0 2.3 8.5 5.4 5.3 0.6 0.2
Indonesia 5.2 5.0 -2.1 4.4 5.0 5.1 0.0 0.2
Thailand 4.2 2.3 -6.1 2.2 5.1 4.3 -1.8 0.4
Europe and Central Asia 3.5 2.7 -2.1 3.9 3.9 3.5 0.6 0.1
Russian Federation 2.8 2.0 -3.0 3.2 3.2 2.3 0.6 0.2
Turkey 3.0 0.9 1.8 5.0 4.5 4.5 0.5 -0.5
Poland 5.4 4.7 -2.7 3.8 4.5 3.9 0.3 0.2
Latin America and the Caribbean 1.8 0.9 -6.5 5.2 2.9 2.5 1.4 0.1
Brazil 1.8 1.4 -4.1 4.5 2.5 2.3 1.5 0.0
Mexico 2.2 -0.2 -8.3 5.0 3.0 2.0 1.3 0.4
Argentina -2.6 -2.1 -9.9 6.4 1.7 1.9 1.5 -0.2
Middle East and North Africa 0.6 0.6 -3.9 2.4 3.5 3.2 0.3 0.3
Saudi Arabia 2.4 0.3 -4.1 2.4 3.3 3.2 0.4 1.1
Iran, Islamic Rep. 3 -6.0 -6.8 1.7 2.1 2.2 2.3 0.6 0.5
Egypt, Arab Rep. 2 5.3 5.6 3.6 2.3 4.5 5.5 -0.4 -1.3
South Asia 6.4 4.4 -5.4 6.8 6.8 5.2 3.6 3.0
India 3 6.5 4.0 -7.3 8.3 7.5 6.5 2.9 2.3
Pakistan 2 5.5 2.1 -0.5 1.3 2.0 3.4 0.8 0.0
Bangladesh 2 7.9 8.2 2.4 3.6 5.1 6.2 2.0 1.7
Sub-Saharan Africa 2.7 2.5 -2.4 2.8 3.3 3.8 0.0 -0.2
Nigeria 1.9 2.2 -1.8 1.8 2.1 2.4 0.7 0.3
South Africa 0.8 0.2 -7.0 3.5 2.1 1.5 0.2 0.4
Angola -2.0 -0.6 -5.2 0.5 3.3 3.5 -0.4 -0.2
Memorandum items:
Real GDP1
High-income countries 2.3 1.6 -4.7 5.3 4.0 2.2 2.1 0.5
Developing countries 4.7 3.9 -1.4 6.3 4.8 4.5 0.8 0.4
EMDEs excluding China 3.2 2.4 -4.3 4.4 4.2 3.7 1.0 0.6
Commodity-exporting EMDEs 2.0 1.8 -4.0 3.6 3.3 3.1 0.6 0.0
Commodity-importing EMDEs 6.0 4.9 -0.6 7.3 5.4 5.0 1.0 0.6
Commodity-importing EMDEs excluding China 4.9 3.2 -4.7 5.4 5.3 4.5 1.6 1.2
Low-income countries 4.7 4.3 0.7 2.9 4.7 5.6 -0.5 -0.7
BRICS 5.8 4.9 -0.3 7.5 5.2 4.7 1.1 0.6
World (PPP weights) 4 3.6 2.8 -3.2 5.7 4.5 3.5 1.4 0.6
World trade volume 5 4.2 1.2 -8.3 8.3 6.3 4.4 3.3 1.2
Commodity prices 6
Oil price 29.4 -10.2 -32.8 50.3 0.0 0.9 42.2 -13.6
Non-energy commodity price index 1.7 -4.2 3.0 22.5 -2.5 -2.7 20.1 -3.8
Source: World Bank.
1. Headline aggregate growth rates are calculated using GDP weights at average 2010-19 prices and market exchange rates. The aggregate growth rates may differ from the previously
published numbers that were calculated using GDP weights at average 2010 prices and market exchange rates.
2. GDP growth rates are on a fiscal year basis. Aggregates that include these countries are calculated using data compiled on a calendar year basis. Pakistan's growth rates are based on
GDP at factor cost. The column labeled 2019 refers to FY2018/19.
3. GDP growth rates are on a fiscal year basis. Aggregates that include these countries are calculated using data compiled on a calendar year basis. The column labeled 2018 refers to
FY2018/19.
4. World growth rates are calculated using average 2010-19 purchasing power parity (PPP) weights, which attribute a greater share of global GDP to emerging market and developing
economies (EMDEs) than market exchange rates.
5. World trade volume of goods and nonfactor services.
6. Oil price is the simple average of Brent, Dubai, and West Texas Intermediate prices. The non-energy index is the weighted average of 39 commodity prices (7 metals, 5 fertilizers, 27
agricultural commodities). For additional details, please see https://www.worldbank.org/commodities.
Note: e = estimate; f = forecast. World Bank forecasts are frequently updated based on new information. Consequently, projections presented here may differ from those contained in other
World Bank documents, even if basic assessments of countries’ prospects do not differ at any given date. Country classifications and lists of EMDEs are presented in table 1.2. BRICS
include: Brazil, the Russian Federation, India, China, and South Africa. Due to lack of reliable data of adequate quality, the World Bank is currently not publishing economic output, income, or
growth data for Turkmenistan and República Bolivariana de Venezuela. Turkmenistan and República Bolivariana de Venezuela are excluded from cross-country macroeconomic aggregates.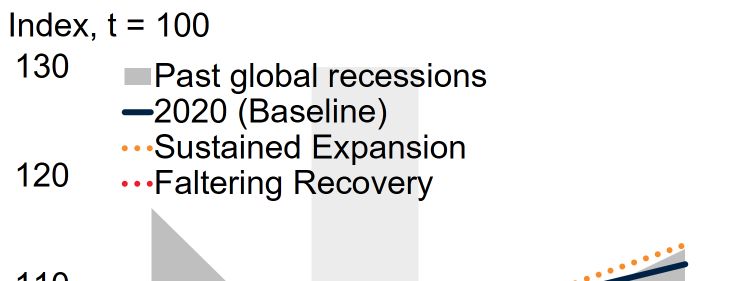
G LO BAL EC O NO MIC P ROS P EC TS | J U NE 2021                                                                                      CHAPTER 1                      5

measures in many countries, as well as rising         FIGURE 1.1 Global prospects
confidence. A substantial share of this rebound is    Global output is rebounding but remains below pre-pandemic projections,
due to major economies, with many EMDEs               with more subdued recoveries in poorer countries. Vaccination has helped
                                                      limit the spread of the virus, but progress is highly unequal and
lagging behind (figure 1.1.D). The United States      concentrated in advanced economies. Compared to previous global
and China are each expected to contribute over        recoveries, the current cycle is strong but uneven, and primarily reflects
one-quarter of global growth in 2021, with the        rebounds in some major economies. With the pandemic and limited
                                                      vaccination in many emerging market and developing economies (EMDEs)
U.S. contribution nearly triple its 2015-19           contributing to downward revisions to growth, per capita income in a
average. Vaccination progress is a key determinant    majority of EMDEs is expected to remain below pre-pandemic peaks for an
of near-term forecast revisions (figure 1.1.E).       extended period.

Despite the strong pickup, the level of global GDP
                                                      A. Deviation of output from                        B. Distribution of COVID-19 cases
in 2021 is expected to be 3.2 percent below pre-      pre-pandemic projections                           and vaccine doses from mid-April to
pandemic projections.                                                                                    mid-May
                                                                                                          Percent of population   Percent of population
                                                                                                          6       Advanced economies EMDEs           20
The recovery is envisioned to continue into 2022,
with global growth moderating to 4.3 percent.                                                             4
                                                                                                                                                                 10
Still, by 2022, global GDP is expected to remain                                                          2

1.8 percent below pre-pandemic projections.
                                                                                                          0                                                      0
Compared to recoveries from previous global
recessions, the current cycle is notably uneven,                                                                     Estimated
                                                                                                                   COVID-19 cases
                                                                                                                                              Vaccine doses
                                                                                                                                                 (RHS)
with per capita GDP in many EMDEs remaining
below pre-pandemic peaks for an extended period       C. Global recoveries after recessions              D. Contributions to global growth
(figure 1.1.F).

In advanced economies, the rebound is expected
to accelerate in the second half of 2021 as a
broader set of economies pursue widespread
vaccination and gradually reopen, with growth
forecast to reach 5.4 percent this year—its fastest
pace in nearly five decades. Growth is projected to
moderate to 4 percent in 2022, partly as fiscal
                                                      E. Forecast revisions to global growth             F. Share of EMDEs exceeding pre-
support in the United States begins to recede         in 2021, by vaccination progress                   global-recession peaks in per capita
absent additional legislation.                                                                           output after 2 years
                                                      Percentage points   Above-median vaccination        Percent
                                                      3                   Below-median vaccination        100
Aggregate EMDE growth is forecast to reach 6
                                                                                                              75
percent in 2021, as the effects of the pandemic        2

                                                                                                              50
gradually wane and as EMDEs benefit from               1
elevated commodity prices and improving external                                                              25
                                                       0
demand. Nevertheless, the strength of the rebound                                                             0
                                                                                                                     1945-46

                                                                                                                               1975

                                                                                                                                       1982

                                                                                                                                                1991

                                                                                                                                                       2009

                                                                                                                                                              2020

this year mainly reflects robust pickups in a few     -1
                                                              World          AEs         EMDEs
large economies. In many other EMDEs,
recoveries are expected to be dampened by             Sources: Bolt et al. (2018); Kose, Sugawara, and Terrones (2020); Our World in Data (database);
                                                      World Bank.
elevated COVID-19 caseloads and obstacles to          Note: AEs = advanced economies; EMDEs = emerging market and developing economies; LICs =
vaccine procurement and uptake, as well as by a       low-income countries. Unless otherwise denoted, aggregates are calculated using real U.S. dollar
                                                      GDP weights at average 2010-19 prices and market exchange rates.
partial withdrawal of monetary and, especially,       A. Figure shows percent deviation between the levels of June 2021 and January 2020 baseline World
                                                      Bank projections. Shaded area indicates forecasts.
fiscal support (figure 1.2.A). Aggregate EMDE         B. Figure shows the one-month accumulation of COVID-19 cases in AEs and EMDEs over April 17-
                                                      May 17, 2021, as estimated by the Institute for Health Metrics and Evaluation (IHME), and
growth is projected to moderate to 4.7 percent        vaccinations as a share of the population. Sample includes 36 advanced economies and 120 EMDEs.
next year, owing to the continued unwinding of        C. Lines show global recessions, with “t” as their final year. Data for 2021-23 used in the “2020”
                                                      episode are forecasts.
fiscal support and subdued investment, leaving        D. Figure shows contributions to global growth forecast for 2021 and 2022 compared to average
                                                      contributions to growth in 2015-2019 period. Shaded area indicates forecasts.
EMDE output 4.1 percent below pre-pandemic            E. GDP-weighted forecast revisions for all countries above and below each aggregate’s median share
                                                      of population that has received at least one COVID-19 vaccine dose as of June 1, 2021. Sample
projections in 2022. Among LICs, growth is            includes 36 advanced economies and 132 EMDEs.
                                                      F. Data for 2021-22 used in the “2020” episode are baseline forecasts.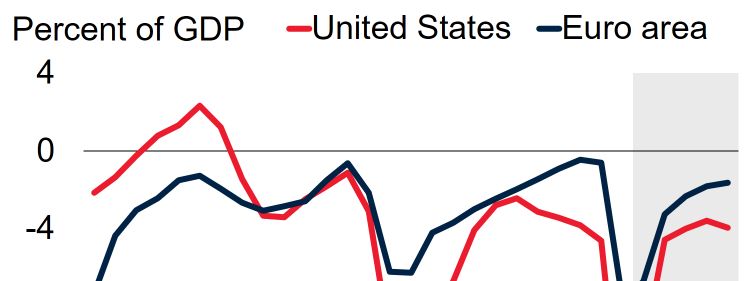
6 CHAPTER 1 G LO BAL EC O NO MIC P ROS P EC TS | J U NE 2021
FIGURE 1.2 Global risks and policy challenges expected to pick up to an average of 3.8 percent in
In many emerging market and developing economies (EMDEs), the recov- 2021-22—well below the average pace of 5.1
ery will be constrained by elevated COVID-19 caseloads, obstacles to percent in the 2010-19 period, and leaving the
vaccination, and a partial withdrawal of macroeconomic support. In many
EMDEs, the pandemic has slowed or reversed progress at per capita in-
2022 level of output 4.9 percent below pre-
come catch-up with advanced economies. Inflation is expected to exceed pandemic projections.
targets in about half of inflation-targeting EMDEs, which could trigger mon-
etary tightening and potentially result in financial stress. Bolstering a green,
resilient, and inclusive recovery will necessitate the efficient use of historic
Notwithstanding these projected recoveries, the
increases in debt, the promotion of investments in education and environ- pandemic has had a devastating effect on per
mental sustainability, and the reduction of trade costs. capita income growth, poverty, and inequality,
which will linger for a protracted period. Although
A. Fiscal and monetary policy stance B. Per capita income growth relative per capita income growth in EMDEs is projected
in 2021 to advanced economies
Percentage points
to be 4.9 percent this year, it will be essentially
Percent of EMDEs 2021-23 2010-19
100
Tightening Unchanged Loosening 4 zero in LICs. As a result, per capita income catch-
2 up with advanced economies could slow or even
75
0
reverse in many poorer countries (figure 1.2.B).
50 Moreover, per capita income losses incurred in
-2
25
2020 will not be fully unwound by 2022 in about
-4
EMDEs EMDEs LICs Fragile Small two-thirds of EMDEs, including 75 percent of
0 excl. LICs states
Fiscal stance Monetary policy rate China fragile and conflict-affected LICs. By the end of
this year, it is expected that about 100 million
C. Forecast for EMDE inflation D. Inefficiencies in public spending people across EMDEs will have fallen back into
Percent Median inflation target Percent, higher values indicate lower efficiency extreme poverty. The pandemic’s impact on
80
8 poverty could reverberate for a prolonged period
60
6
due to its scarring effects on long-term growth
40
prospects. The pandemic has also exacerbated
4 20
inequality as it has disproportionately affected
0
vulnerable groups—including women, children,
AEs
EMDEs
LICs
AEs
EMDEs
LICs
2
and unskilled and informal workers.
0
2019 2020 2021f Education Infrastructure
Moreover, the global outlook is clouded by
E. Global greenhouse gas emissions F. Trade costs and tariff rates uncertainty and subject to various risks (box 1.1).
Percent
Electricity and heat
Percent Percent The continued spread of COVID-19 shows that
80 150 15
Transport
Other energy
Trade costs Tariffs (RHS)
repeated outbreaks are still possible, especially in
60 Agriculture 100 10 light of the emergence of new variants that are
Industry
40 Waste more virulent, deadly, and resistant to vaccines.
50 5
Elevated debt levels make the financial system
20
0 0
vulnerable to a sudden increase in interest rates,
0 which could stem from a rise in risk aversion,
Energy Non-energy Advanced economies EMDEs
inflation, or expectations of faster monetary
Sources: Comtrade (database); Consensus Economics; ESCAP-World Bank Trade Cost Database; tightening. A spike in bankruptcies could damage
Haver Analytics; International Monetary Fund; World Bank; World Resources Institute.
Note: AEs = advanced economies; EMDEs = emerging market and developing economies; LICs = the banking system, restrict the flow of credit, and
low-income countries; Fragile LICs = fragile and conflict-affected LICs.
A. The threshold for fiscal loosening/tightening is a fiscal impulse of +/- 0.5 percentage point of
trigger credit crunches.
potential GDP. Fiscal impulse is the negative change in the cyclically-adjusted primary balance from
the previous year. Monetary policy stance shows whether countries have had net policy rate hikes/
cuts this year. Sample includes 30 EMDEs for fiscal balance and 70 EMDEs for monetary policy rate. The near- and longer-term consequences of the
B. Relative per capita income growth is computed as a difference in per capita GDP growth between
respective EMDE groups and advanced economies. For more information on “Small states,” see:
COVID-19 crisis pose enormous policy
https://www.worldbank.org/en/country/smallstates/overview. challenges. The immediate priority continues to
C. Based on median inflation in 125 EMDEs and inflation target in 30 inflation-targeting EMDEs. 2021
EMDE inflation forecast described in chapter 4. Vertical line indicates 16-84 confidence bands. be pandemic control, including overcoming
D. Figure shows median efficiency gap: The difference between a country's spending efficiency and
that of best performers. Yellow whiskers show interquartile ranges. Sample includes 34 advanced obstacles in procuring and distributing vaccines.
economies, 139 EMDEs, and 24 LICs. See figure 1.23.E notes for more detail.
E.F. Data are for 2018.
International cooperation is needed to help ensure
F. Blue bars show average trade costs expressed as ad valorem (tariff) equivalent of the value of timely and equitable vaccine distribution—
traded goods. Red bars show average tariffs for all products. Trade costs aggregated using bilateral
country export shares. Yellow whiskers show interquartile ranges.
G LO BAL EC O NO MIC P ROS P EC TS | J U NE 2021                                                        CHAPTER 1   7

particularly in LICs, where inoculation continues      connectivity and reduce trade costs, which are
to be very slow. As the pandemic is brought under      particularly elevated in EMDEs (figure 1.2.F).
control, policy actions will also be needed to         Increasing investments in learning infrastructure
address its adverse legacies, which will require       and education will also be required to boost
balancing competing priorities.                        human capital and arrest recent declines in
                                                       associated budgets, while expanding green
In many economies, central banks will need to          investment can enhance climate resilience.
carefully weigh the continued weakness of
domestic demand against near-term inflation
pressures. Model-based forecasts and inflation
                                                       Global context
expectations point to an increase in inflation in      COVID-19 continues to spread, particularly in
2021 that will exceed target ranges in about one-      many emerging market and developing economies
half of inflation-targeting EMDEs (chapter 4;          (EMDEs) amid unequal vaccine deployment.
figure 1.2.C). Although this may not warrant an        Although world trade is benefiting from the global
aggressive policy response, additional inflation       recovery, it is being constrained by supply bottlenecks
pressure across EMDEs may risk de-anchoring            and travel restrictions. Financial conditions, while
inflation expectations and could trigger monetary      still benign, have tightened somewhat as global yields
tightening despite subdued recoveries, which in        have risen due in part to higher inflation
some cases could also result in financial stress.      expectations. Almost all commodity prices have been
                                                       boosted by the global recovery, with some prices
Similarly, many EMDEs will need to be careful to       further lifted by supply factors.
avoid a premature withdrawal of fiscal support,
while still keeping a steady eye on medium-term        Pandemic developments
debt sustainability. Given the historic increase in
sovereign debt, it will be essential to improve the    The pandemic continues to exact a heavy toll,
efficiency of public spending (figure 1.2.D).          particularly across EMDEs (figure 1.3.A). Since
Strengthening domestic revenue mobilization and        COVID-19 started to spread, it has infected at
medium-term fiscal frameworks can help widen           least 160 million people and caused more than 3
fiscal space and bolster policy credibility. Global    million deaths. Hundreds of thousands of new
cooperation, including private sector participation,   cases are being reported every day, and the
is needed to provide debt relief to the world’s        number of unreported cases is estimated to be
poorest countries and fund the investments             substantial, particularly in South Asia (figure
needed to boost growth and lower greenhouse gas        1.3.B; Bhattacharyya et al. 2020). Global
emissions (figure 1.2.E).                              outbreaks of the virus have come in several waves,
                                                       each cresting at a higher daily infection rate than
Notwithstanding the expected near-term recovery,       the one before. Recent outbreaks have
EMDE output is likely to remain below its pre-         disproportionately affected India and, to a lesser
pandemic trend for a prolonged period, as many         extent, some other large EMDEs such as Brazil.
fundamental drivers of growth have been scarred
by the pandemic. A comprehensive set of policies       Vaccination campaigns are gathering pace in many
will be required to promote a strong recovery that     advanced economies and a number of EMDEs,
mitigates inequality and enhances environmental        with about 9 percent of the global population
sustainability, ultimately putting economies on a      having received at least one vaccine dose.
path of green, resilient, and inclusive development    Nevertheless, this average conceals enormous
(GRID). For example, labor market reforms and          regional and income disparities—especially the
improved social safety nets can bolster labor          paltry rate of vaccination in the poorest countries.
productivity by facilitating the movement of labor     Countries that have administered vaccines to a
toward high-growth sectors while protecting            greater share of their population are seeing a far
vulnerable groups. Productivity can also be            slower accumulation of caseloads than the sizable
boosted by efforts to increase access to digital       share of EMDEs that have so far administered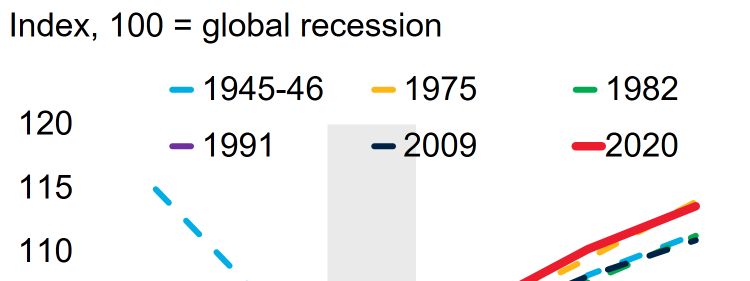
8 CHAPTER 1 G LO BAL EC O NO MIC P ROS P EC TS | J U NE 2021
FIGURE 1.3 Pandemic developments New variants that were originally identified in
The pandemic has continued to spread worldwide, and particularly in Brazil, India, South Africa, and the United
emerging market and developing economies (EMDEs). The number of Kingdom are now circulating globally. There is
confirmed cases is lower than the estimated number of actual cases,
particularly in South Asia. Countries where vaccination campaigns are
evidence that these new strains may spread more
proceeding quickly have generally seen new cases of COVID-19 fall to a easily and cause more severe disease (Davies et al.
low level. These are mostly advanced economies, as most EMDEs have so 2021). Some of the strains also appear to be
far administered only a limited number of shots, and low-income countries
have scarcely begun.
resistant to the immune responses triggered by a
previous infection or by the current set of vaccines
A. Evolution of the pandemic B. Confirmed versus estimated (Wang et al. 2021). All countries remain vulner-
COVID-19 cases able to renewed outbreaks so long as the virus
New daily cases, thousands Percent of population continues to circulate in some areas amid unequal
1,000 Confirmed
Advanced economies
0.3
global vaccine coverage (Çakmaklı et al. 2021).
800 EMDEs Estimated
World
600 0.2
Despite continued waves of infection, the impact
400
of the virus and associated lockdown measures on
200 0.1
0
economic activity appears to be diminishing in
most countries. Over time, firms and households
Jan-20
Mar-20
May-20
Jun-20
Aug-20
Oct-20
Nov-20
Jan-21
Mar-21
May-21
0.0
SAR LAC MNA ECA SSA AEs EAP have adjusted their behavior to mitigate
disruptions and shift activity to less-affected
C. Daily new COVID-19 cases, D. Distribution of new COVID-19 cases sectors (ECB 2021). In addition, compliance with
by vaccination progress and vaccine doses from mid-April to
mid-May
lockdown measures appears to have waned
somewhat over time (Goldstein, Yeyati, and
Index, 100 = January 1, 2021 Percent of population Percent of population
400 Above-average vaccination 6 Advanced economies EMDEs 20 Sartorio 2021).
Below-average vaccination
300 4
10
Global trade
200 2
Global trade has continued to rebound; however,
100 0 0
the strength of global trade growth is set to be
0
Jan-21 Feb-21 Mar-21 Apr-21 May-21
Estimated Vaccine doses dampened by shifting activity from manufacturing
COVID-19 cases (RHS)
to the low-trade-intensity domestic services sector
in countries where COVID-19 caseloads have
Sources: Johns Hopkins University (database); Our World in Data (database); World Bank.
Note: AEs = advanced economies; EMDEs = emerging market and developing economies; EAP = been declining. The recovery in global trade
East Asia and Pacific, ECA = Europe and Central Asia, LAC = Latin America and the Caribbean,
MNA = Middle East and North Africa, SAR = South Asia, SSA = Sub-Saharan Africa. started earlier and has been stronger than that of
A. Figure shows the seven-day moving average of daily new COVID-19 cases. Sample includes 36
advanced economies and 147 EMDEs. Last observation is May 25, 2021.
other components of global output, as the
B. Bars represent the new COVID-19 confirmed cases, whereas the diamonds represent the COVID- pandemic’s impact on activities requiring face-to-
19 cases as estimated by the Institute for Health Metrics and Evaluation (IHME). Data retrieved on
May 26, 2021. Last observation available taken for both confirmed and estimated cases. Sample face contact initially encouraged a rotation in
includes 36 advanced economies, 7 EAP, 23 ECA, 26 LAC, 19 MNA, 7 SAR, and 41 SSA economies.
C. Figure shows the seven-day moving average of daily new COVID-19 cases per million people for demand toward the consumption of durable
36 advanced economies and 147 EMDEs above and below the global average vaccination rate. Last
observation is May 25, 2021.
goods, which have a high trade intensity (figure
D. Figure shows the one-month accumulation of COVID-19 cases in AEs and EMDEs over April 17- 1.4.A).
May 17, 2021, as estimated by the Institute for Health Metrics and Evaluation (IHME), and
vaccinations as a share of the population. Sample size includes 36 advanced economies and 120
EMDEs. Manufacturing trade is currently being
constrained by supply bottlenecks and strains in
global value chains, which were temporarily
exacerbated by the blockage of the Suez Canal in
shots to only a small proportion (figure 1.3.C-D). March (Ferrantino et al. 2021). Companies have
Coverage in poorer countries remains extremely experienced a sharp rise in freight rates and
limited, but the COVAX initiative and the localized shortages of shipping containers (figure
potential temporary waiving of intellectual 1.4.B). In order to increase resilience and mitigate
property protections for COVID-19 vaccines may logistical problems, companies have increased
contribute to global distribution becoming more their use of digital technologies and diversified
equitable over time. suppliers and production sites (Saurav et al. 2020).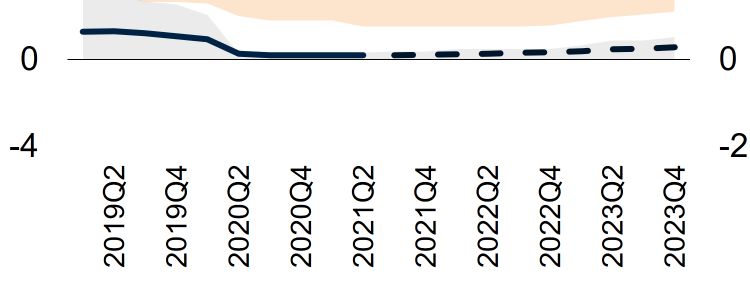
G LO BAL EC O NO MIC P ROS P EC TS | J U NE 2021                                                                      CHAPTER 1            9

   BOX 1.1 What is next? Growth scenarios beyond 2021
   Global growth is set to reach 5.6 percent in 2021—the strongest post-recession pace in 80 years. Nonetheless, the recovery is
   expected to be highly uneven, and there is substantial uncertainty about the strength and durability of this anticipated upturn
   beyond 2021. This box explores two alternative scenarios. In a “Faltering Recovery” scenario, the global economy slows in response
   to the possibility of recurring local COVID-19 outbreaks, mounting inflationary pressures, and a sharp tightening of global
   financial conditions during the next two years. In contrast, in a “Sustained Expansion” scenario, vaccine-driven COVID-19
   containment, re-opening, and ambitious reforms catalyze an even stronger response of private activity and potential output, with
   positive global spillovers. These scenarios illustrate that the current signs of recovery may be fleeting and underscore the need for
   policy makers in emerging market and developing economies (EMDEs) to take advantage of present opportunities to put in place
   growth-enhancing reforms.

   Introduction                                                            post-recession pace in 80 years—following a 3.5 percent
                                                                           contraction in 2020. Advanced economies are expected to
   Global economic activity is accelerating as the world                   grow 5.4 percent in 2021, with substantial fiscal support
   emerges from the deepest global recession since World                   and faster-than-expected vaccinations in the United States
   War II (World Bank 2020a). Barring a protracted global                  adding fuel to the rebound. Growth in EMDEs is also
   resurgence of COVID-19, the baseline outlook described                  projected to strengthen, reaching 6 percent in 2021 on the
   in the main text envisages the strongest global recovery                back of improving external demand and elevated
   from any of the five global recession in the past 80 years.             commodity prices. This baseline outlook is predicated
   However, the recovery is remarkably uneven across                       on the assumption that widespread vaccination allows
   countries, as it largely reflects sharp rebounds in some                advanced economies to achieve effective containment of
   major economies, with poorer countries lagging behind. In               the pandemic by the end of the year, while many major
   addition, there is substantial uncertainty around the                   EMDEs are envisaged to substantially reduce local trans-
   baseline growth trajectory, especially beyond 2021. The                 mission rates. In contrast, slow progress of vaccination
   recovery in global activity may not last, as explored in a              campaigns would allow COVID-19 to disrupt activity to
   “Faltering Recovery” scenario. In this case, growth would               varying degrees in many other EMDEs, including low-
   slow starting in 2022 as recurring COVID-19 flareups                    income countries.
   would weigh on risk sentiment, while mounting inflation
   pressures amid elevated macroeconomic vulnerabilities                   The surge in growth envisaged for 2021 reflects, to varying
   would trigger a sharp tightening of global financial                    degrees, the combination of ongoing macroeconomic
   conditions (Reinhart and Reinhart 2020). Alternatively, in              policy support and the release of pent-up demand
   a “Sustained Expansion” scenario, the rebound could                     associated with the easing of the pandemic. In response to
   broaden and become self-sustaining, anchored by                         the COVID-19 shock, central banks have eased monetary
   improved confidence, an accelerated pace of technological               policy forcefully, by cutting policy rates and in many cases
   change, and a renewed push for reforms that boost longer-               committing to keeping them low for an extended period,
   term productivity in EMDEs (World Bank 2021a; Kose                      as well as rolling out unconventional policies (figure
   and Ohnsorge 2021). The global implications of these                    B1.1.1.A-B). Fiscal authorities also announced a series of
   scenarios are assessed using a large-scale global semi-                 large-scale support packages across advanced economies
   structural projection model. a                                          and, to a lesser extent, EMDEs (figure B1.1.1.C). More-
                                                                           over, the pandemic and associated lockdown measures
   Baseline scenario
                                                                           forced households to reduce spending on services involving
   In the baseline scenario, global output is set to bounce                personal contact, leading to a sizable accumulation of
   back strongly, expanding 5.6 percent this year—the fastest              personal savings, particularly in advanced economies
                                                                           (figure B1.1.1.D).

       Note: This box was prepared by Justin-Damien Guénette, with
                                                                           Although financial conditions remain benign, they have
   contributions from Alain Kabundi and Takefumi Yamazaki.                 tightened somewhat as firming activity raises the prospect
       a. The scenarios were constructed using the Oxford Economics        of stronger inflation and a faster withdrawal of supportive
   Global Economy Model (Oxford Economics 2020), which includes 81         monetary policies. The ebbing of the pandemic is also
   individual country blocks (35 advanced economies and 46 EMDEs),
                                                                           revealing heightened macroeconomic vulnerabilities in
   most of which are available at a quarterly frequency, with behavioral
   equations governing domestic economic activity, monetary and fiscal      many EMDEs—in particular, high debt burdens and
   policy, global trade, and commodity prices.                             sizable current account and fiscal deficits—leaving many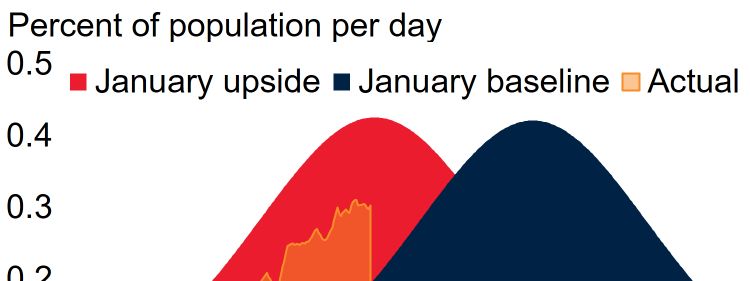
10 CHAPTER 1 G LO BAL EC O NO MIC P ROS P EC TS | J U NE 2021
BOX 1.1 What is next? Growth scenarios beyond 2021 (continued)
FIGURE B1.1.1 Policy support and vulnerabilities
Global economic activity is experiencing an uneven acceleration. Much of the pickup reflects the strengthening of large
advanced economies driven by substantial macroeconomic policy support and the nascent release of pent-up demand as
pandemic control measures are relaxed. However, this pickup will do little to reverse significant debt and external
vulnerabilities accumulated during the pandemic.
A. Central bank policy rate projections B. Quantitative easing in advanced C. Fiscal support measures in response
economies and EMDEs since March 2020 to COVID-19 since January 2020
Percent Percent of GDP
25
20
20
15
15
10
10
5
5
0
0 Advanced World EMDEs
Advanced economies EMDEs economies
D. Personal savings E. EMDE government and private debt F. EMDE current account and fiscal
balances
Percent of disposable income Percent of GDP Percent
2020 2007 2019 10
24 Baseline Pre-pandemic projection 150 2020 2007
20 5
120
16
90 0
12
8 60 -5
4 -10
30
SAR
SAR
EAP
ECA
MNA
SSA
EAP
ECA
MNA
SSA
LAC
LAC
0
Advanced EMDEs World 0
economies Government Private Total Current account Fiscal deficit
Sources: Bank of International Settlements; International Institute of Finance; International Monetary Fund; National accounts; Oxford Economics; World Bank.
Note: EMDEs = emerging market and developing economies; EAP = East Asia and Pacific, ECA = Europe and Central Asia, LAC = Latin America and the Caribbean,
MNA = Middle East and North Africa, SAR = South Asia, SSA = Sub-Saharan Africa.
A. Blue and red lines show average policy rates for 27 advanced economies and 23 EMDEs. Dotted line shows projections as based on Oxford Economics May21_1
Oxford database. Shaded areas show interquartile range.
B. Announced or completed purchases (where no announcement exists) and of sovereign and private sector bonds in percent of nominal GDP as of May 2021. Sample
for EMDEs consists of 17 countries. Sample for advanced economies consists of US, Euro area, Japan, and United Kingdom. Bars shows averages. Orange whiskers
show regional range.
C. Bars show unweighted average of total fiscal support measures in response to COVID-19 pandemic. Sample includes 48 advanced economies and 143 EMDEs.
D. Figure shows average personal savings for 2021 H1 for baseline projection and pre-pandemic baseline approximated by Jan20_1 Oxford Economics database.
Sample includes 27 advanced economies and 17 EMDEs.
E. Aggregates are calculated using real U.S. dollar GDP weights at average 2010-19 prices and market exchange rates, excluding China. Total debt is a sum of
government and private debt. Government debt based on 149 EMDEs and private debt based on 126 EMDEs.
F. Averages across EMDE regions, consisting of 22 EAP (excluding China), 23 ECA, 31 LAC, 16 MNA, 8 SAR, and 46 SSA.
of them exposed to financial market disruptions (figure projected scarring of potential output (Das and Wingender
1.1.1.E-F). 2021). Growth in the United States is forecast to remain
strong, in part due to the likelihood that the Federal
Beyond 2021, the baseline forecast anticipates a Reserve will keep policy rates near zero through early 2023,
moderation of the global recovery with a continued in line with market expectations. In doing so, the Federal
divergence between advanced economies and EMDEs. Reserve is assumed to permit a modest overshoot of
Advanced economies are expected to continue to recover at inflation above the 2 percent target over the next three
a healthy pace, buoyed by reopening amid limited years, consistent with its new Average Inflation TargetingG LO BAL EC O NO MIC P ROS P EC TS | J U NE 2021 CHAPTER 1 11
BOX 1.1 What is next? Growth scenarios beyond 2021 (continued)
regime (Brainard 2021).b In contrast, the pace of recovery the experience following the global recession of 2009
in EMDEs is expected to be subdued and uneven, with (Kose and Ohnsorge 2021). A lingering pandemic, with
growth in 2022 and 2023 averaging 4.5 percent—only new variants causing recurring local resurgences of
modestly above a declining rate of potential output growth infections, would leave households and businesses wary of
(averaging 4 percent over the same period). The factors future prospects (Kozlowski 2020; Ilut and Schneider
weighing on EMDE recoveries include a slow pace of 2012). This would keep savings elevated and limit the
vaccination and reopening, the withdrawal of macro- scope for further improvement in private consumption
economic support, the stabilization of commodity prices, and investment.
and a sluggish rebound in global tourism.
At the same time, a rapid demand-driven increase in
Comparison with recoveries from previous growth in the United States absent large supply-side
global recessions improvement would generate sustained inflation pressures
and potentially cause a de-anchoring of inflation
The baseline scenario envisages the fastest recovery from expectations (Tauber and Van Zandweghe 2020). The
any of the five global recessions in the past 80 years, Federal Reserve could have no choice but to respond by
considerably faster than the initial rebound from the global quickly tightening monetary policy, likely triggering a
financial crisis (figure B1.1.2.A-B). The recovery in sharp repricing of risk by financial markets, and
advanced economies is projected to be particularly exacerbating already heightened macroeconomic
robust—their 2021 growth is expected to be nearly twice vulnerabilities.c The macroeconomic effects of a sharp
as fast as that after the 2009 recession (figure B1.1.2.C). In tightening of global financial conditions, as well as weaker
contrast, the recovery in EMDEs is expected to be more consumer and business confidence, would compound the
modest, with growth in 2021 about one fifth slower than expected unwinding of global fiscal support. d Growth in
after the 2009 recession. advanced economies would slow sharply from 5.4 percent
Nevertheless, this global recovery is expected to be in 2021 to 2.6 percent in 2022 and 1.4 percent in 2023
markedly less broad-based than previous ones. Only half of (figure B1.1.3.A).
all countries are expected to have regained their pre-
pandemic per capita income levels in 2022, two years after The slowdown would also be sharp in EMDEs as negative
the global recession (figure B1.1.2.D). In contrast, by spillovers via confidence, trade, and commodity price
2011, after the 2009 global recession induced by the global channels would reduce private sector activity. e These
financial crisis, two thirds of countries had regained the countries would experience significant capital outflows in
pre-recession per capital output levels, a similar share of response to heightened investor risk aversion, leading to
countries as after the average global recession in the 20th sharp currency depreciations, which in turn would worsen
century. The weakness of the recovery is concentrated in debt burdens and boost inflation. Domestic credit spreads
EMDEs: Over 90 percent of advanced economies are would significantly widen, triggering a notable rise in
expected to regain their pre-pandemic per capita income defaults, especially in those countries with pre-existing
levels in 2022, while only about one third of EMDEs are balance sheet vulnerabilities (figure B1.1.3.B; Arteta et al.
expected to do so over that time (figure B1.1.2.E-F).
Downside scenario: A Faltering Recovery
c. The Federal Reserve is assumed to begin raising rates while rapidly
The global recovery could falter once policy support is tapering its quantitative easing program starting in 2022Q1.
withdrawn and pent-up demand is exhausted, similar to d. In this scenario, financial market volatility would spike in 2022Q1
and 2022Q2, with the VIX experiencing a rise on par with the COVID-
19 crisis due in large part to an unexpected acceleration in the unwinding
b. Under average inflation targeting, the inflation rate is expected to of U.S. monetary policy stimulus in the face of rising inflation
exceed its target during expansions to compensate for below-target expectations. The sharp rise in global risk aversion is assumed to
inflation during downturns. The modest overshoot in core PCE inflation precipitate a persistent downward shift in global confidence starting in
envisioned by the Federal Reserve in its March 2021 Summary of early 2022.
Economic Projections would bring average core PCE inflation to 1.9 e. Major EMDEs are assumed to face significant adverse domestic
percent over 2020-23 and to 1.6 percent over 2015-23, still below the 2 confidence shocks in addition to negative spillovers from abroad. These
percent target. Critically, the projection for U.S. inflation assumes that shocks are calibrated to broadly match recent episodes of domestic
inflation expectations remain anchored and the Phillips Curve—the economic weakness such as what occurred during the Taper Tantrum
relationship between inflation and the level of excess demand—is nearly (2013Q2) and what happened during the global financial crisis for
flat (Hazell et al. 2020). certain EMDEs.12 CHAPTER 1 G LO BAL EC O NO MIC P ROS P EC TS | J U NE 2021
BOX 1.1 What is next? Growth scenarios beyond 2021 (continued)
FIGURE B1.1.2 Global recovery in historical context
The baseline forecast envisages the strongest post-recession rebound in global output growth in 80 years. Much of the
strength reflects a remarkably swift recovery in advanced economies, in contrast to the recovery that followed the global
financial crisis. That said, the recovery is expected to be unusually narrow in per capita terms, with only 50 percent of
countries expected to exceed their pre-recession peaks in 2022. The global recovery is also expected to be markedly
uneven across advanced economies and EMDEs.
A. Global output recoveries over history B. Global output per capita recoveries C. Advanced economy and EMDE output:
over history 2020 vs 2009
D. Share of countries exceeding E. Share of advanced economies F. Share of EMDEs exceeding
pre-recession per capita peaks after exceeding pre-recession per capita pre-recession per capita peaks after
2 years peaks after 2 years 2 years
Percent Percent Percent
100 100 100
75 75 75
50 50 50
25 25 25
0 0 0
1945-46
1975
1982
1991
2009
2020
1945-46
1975
1982
1991
2009
2020
1945-46
1975
1982
1991
2009
2020
Sources: Bolt et al. (2018); Kose, Sugawara, and Terrones (2020); World Bank.
Note: A.-F. Data for 2021-23 used in the “2020” episode are forecasts. GFC = global financial crisis.
A.-B. Lines show global recession episodes. Multiple years are used when the global recession lasted for more than one year.
C. t = 2020 for COVID-19 and t = 2009 for GFC.
D.-F. Dashed yellow line is 50 percent.
2015). f Increased debt servicing costs amid heightened EMDEs would experience renewed downturns, with
rollover risks would force governments in many EMDEs, growth falling sharply from 6.0 percent to 2.9 percent in
particularly in countries with limited fiscal space, to cut 2022, well below the 5.1 percent average of the previous
consumption and delay investment projects. g decade (figure B1.1.3.C). Relative to the baseline scenario,
EMDE growth in 2022 and 2023 would be 1.8 and 1.3
percentage point lower, respectively, and the additional
f. The domestic credit spread is calculated as a difference between the
slowdown would cut across all EMDE sub-regions.
short-term lending rate and the 10-year government bond yield. Credit Growth in China would remain resilient, averaging nearly
spreads in advanced economies are endogenously determined, whereas in
EMDEs they are set to be consistent with (1) the levels prevailing during 5 percent in 2022 and 2023 as policy makers would be
the GFC or (2) the period of rising concerns in anticipation of weaker-
than-expected global growth and a no-deal Brexit in 2018.
g. The magnitude of the fiscal consolidation shock is calibrated to according to the size of their fiscal sustainability gap based on Kose et al.
match recent historical episodes of rapid fiscal consolidation in major (2017). The fiscal sustainability gap widened considerably in most
EMDEs. The degree of fiscal consolidation varies across major EMDEs EMDEs in 2020.G LO BAL EC O NO MIC P ROS P EC TS | J U NE 2021 CHAPTER 1 13
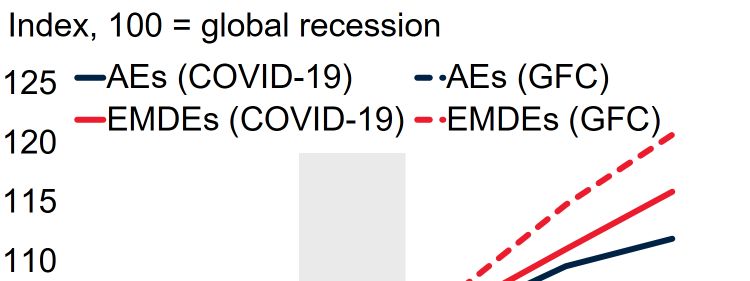
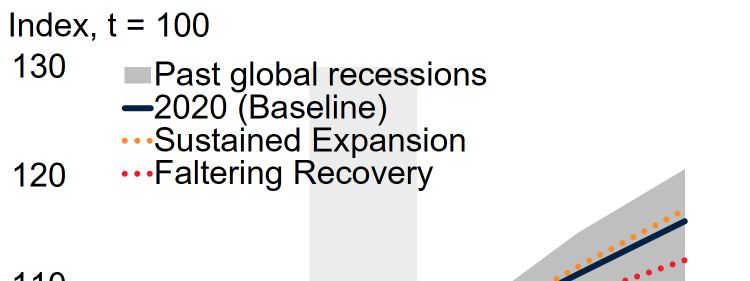
BOX 1.1 What is next? Growth scenarios beyond 2021 (continued)
FIGURE B1.1.3 Alternative scenarios for global growth
Global growth is expected to pick up strongly in 2021, buttressed by increased but unequal vaccination, policy support, and
the release of pent-up demand. For 2022, growth outcomes will depend on the extent to which the initial rebound can
catalyze a durable recovery in private sector activity and potential output growth. In a “Faltering Recovery” scenario, the
global recovery may prove short-lived, as recurring local resurgences of the pandemic combined with the de-anchoring of
inflation expectations in the United States lead to a sharp repricing of risk and a tightening of global and especially EMDE
financial conditions. In contrast, in a “Sustained Expansion” scenario, rising global confidence amid brighter pandemic
prospects, an accelerated pace of technological change, and growth-enhancing reforms in EMDEs provide a strong growth
boost through 2023.
A. Advanced economy GDP growth B. Major EMDE credit spreads C. EMDE GDP Growth
Percent Percent Percent
8 Baseline Scenario Range Baseline Faltering Recovery Baseline Scenario Range
12 8
10
6
6
8
4 6 4
4
2 2
2
0 0 0
2010s 2021 2022 2023 2021 2022 2023 2010s 2021 2022 2023
D. World GDP growth E. Episodes of rising advanced economy F. EMDE output growth and potential
total factor productivity growth output growth with reforms
Percent Percent Percent Growth-enhancing reforms
Baseline Scenario Range Potential output (Baseline)
8 2.0 7
EMDE growth (Baseline)
1.6 6 Scenario range
6 5
1.2
4
4 0.8
3
0.4 2
2
0.0 1
1983-84 2022-23 2003-04 1999-00 2022-23
0 Sustained Baseline 0
2010s 2021 2022 2023 Expansion 2021 2022 2023
Sources: Dieppe (2020); Kilic Celik, Kose, and Ohnsorge (2020); Oxford Economics; UN Population Projections; World Bank.
Note: A.C.D. Red bars show average of 2010-2019 GDP growth. Blue bars show baseline data from Global Economic Prospects June 2021 database. Yellow whiskers
indicate the scenario ranges from Oxford Global Economic Model simulations compared to the baseline scenario.
B. Major EMDE countries comprise Argentina, Brazil, China, India, Indonesia, Malaysia, Mexico, Russian Federation, South Africa, and Turkey.
E. TFP is total factor productivity. Advanced economies comprise France, Germany, Italy, Japan, United Kingdom, and United States. Episodes of rising advanced
economy TFP growth are instances when TFP growth accelerated above its historical 1981-2018 average for two consecutive years. The sustained recovery scenario is
based on the acceleration witnessed during the two most recent acceleration episodes of 2003-04 and 1999-00.
F. Potential output estimates and projections are based on a production function approach as described in Kilic Celik, Kose, and Ohnsorge (2020). Sample includes 82
economies (including 30 advanced economies and 52 EMDEs, of which 12 are low-income countries) for 1995-2029. These countries accounted for 95 percent of global
GDP over the past five years. Yellow diamonds show the baseline data from Global Economic Prospects June 2021 database. Green whiskers denote scenario range.
expected to roll out additional policy support measures to In sum, this scenario would mean that global growth
cushion the effect of adverse spillovers. Excluding China, would slow sharply, by nearly 3 percentage points from
growth in EMDEs would fall more sharply, from 4.4 5.6 percent in 2021 to 2.7 percent in 2022, and further to
percent to 1.4 percent in 2022—2.8 percentage points 2.1 percent in 2023 (figure B1.1.3.D). This would leave
below the baseline scenario—resulting in nearly zero the recovery from the COVID-19 pandemic roughly
growth in per capita terms in that year. The pace of similar to the anemic recovery that followed the global
activity in EMDEs would barely tick up in 2023 and at 2 financial crisis.
percent would still be 1.7 percentage points below the
baseline forecast.14 CHAPTER 1 G LO BAL EC O NO MIC P ROS P EC TS | J U NE 2021
BOX 1.1 What is next? Growth scenarios beyond 2021 (continued)
Upside scenario: A Sustained Expansion output and well-anchored inflation expectations would
help keep inflationary pressures in check, allowing
Alternatively, the global recovery could prove more robust advanced economy central banks to keep monetary policy
and broad-based than expected. For instance, the policy- accommodative for a prolonged period. In turn, continued
supported surge in global growth in 2021, coupled with monetary accommodation would support investment and
faster and more equitable global vaccination, could consumption by alleviating debt service burdens and
catalyze a self-sustaining period of rapid growth in which supporting asset prices.
the private sector becomes a powerful engine of growth
starting in 2022. In effect, strong pro-cyclical policy Growth in advanced economies would remain near 5
support would trigger a process of “reverse hysteresis” in percent in 2022 before slowing to a still strong 3.1 percent
which a robust cyclical upturn lifts long-run growth in 2023. The investment- and productivity-driven growth
prospects (Reifschneider, Wascher, and Wilcox 2013; in advanced economy growth would have greater spillovers
Coibion, Gorodnichenko, and Ulate 2017). to EMDEs, boosting export demand while ensuring that
global financial conditions remain benign (World Bank
In particular, this scenario envisages that technological 2017). As a result, EMDEs would experience a robust
adoption would accelerate, along with rising investment expansion, with growth averaging over 5 percent in 2022
and labor force participation, causing potential output to and 2023—0.6 percentage point higher on average than in
strengthen. Starting in the first quarter of 2022, total the baseline scenario. Overall, global growth would be
factor productivity growth in advanced economies would notably stronger, averaging 4.4 percent over 2022-23
accelerate to levels similar to those seen during previous compared to 3.7 percent in the baseline scenario (figure
episodes of productivity surges, as corporations deepen B1.1.4.A-C).
their use of digital technologies and work from home
policies adopted during the pandemic (figure B1.1.3.E;
Policy implications
Barrero, Bloom, and Davis 2021; McKinsey 2020).
Knowledge spillovers and faster installation of new COVID-19 continues to spread across the world, making
productive capital would also raise productivity in other pandemic control the top priority for policy makers.
countries. h At the same time, this scenario assumes that Launching durable economic recoveries will not be
EMDE policy makers, faced with high levels of sovereign possible until containment is achieved through widespread
debt and slowing long-run growth prospects, implement and equitable vaccination efforts. Still, there have been
growth-enhancing reforms, including reforms to encouraging signs of a solid macroeconomic recovery from
strengthen economic governance, diversify economies the deleterious effects of the pandemic in recent months. A
reliant on commodities or tourism, and facilitate the supportive external environment has helped buoy activity:
reallocation of resources towards more productive activities strengthened external demand has boosted exports of raw
(World Bank 2021a). This comprehensive package of commodities and traded goods, while still-benign global
reforms would raise EMDE potential output growth financial conditions have helped ease the burden of heavy
gradually starting in 2022 (figure B1.1.3.F). debt loads among many EMDE governments and
Consumer confidence would surge, anchoring strong corporates.
private consumption growth as consumers rapidly draw
Looking beyond 2021, EMDE policy makers can help
down their savings. i At the same time, rising potential
realize a Sustained Expansion scenario of the global
economy by decisively implementing growth-enhancing
reforms. The benefits of the ongoing global trade rebound
h. TFP spillovers are calibrated using estimates from Coe, Helpman can be leveraged by reforms that lower trade costs (chapter
and Hoffmaister (2008) and differentiated across advanced economies 3), including streamlining trade processes and customs
and EMDEs based on the results of multi-country vector autoregression clearance procedures, lowering tariffs, and implementing
models. The installation of new productive capital is also assumed to raise
total factor productivity (World Bank 2018a).
policies that support trade infrastructure and services.
i. The global increase in confidence is modeled using globally Ambitious reforms to facilitate the transition of labor and
correlated confidence shocks that simultaneously increase private capital to high-growth sectors, strengthen social safety
consumption and business investment. The magnitude of the shock is nets, and fund environmentally sustainable investments
calibrated to raise EMDE growth in 2022 by a similar magnitude to the can help entrench a domestically driven green, resilient,
acceleration in growth that occurred in 2006 (about 0.9 percentage
point). and inclusive recovery.G LO BAL EC O NO MIC P ROS P EC TS | J U NE 2021 CHAPTER 1 15
BOX 1.1 What is next? Growth scenarios beyond 2021 (continued)
FIGURE B1.1.4 Global recovery scenarios in historical context
From a historical perspective, global activity could follow alternative paths as it recovers from the 2020 recession. In the
Faltering Recovery scenario, the global recovery could lose momentum, with global output evolving broadly in line with the
recovery that followed the global financial crisis. Alternatively, in the Sustained Expansion scenario, the post-recession
recovery could be notably stronger.
A. Global output around historical B. Advanced economy output around C. EMDE output around historical
recessions historical recessions recessions
Sources: Bolt et al. (2018); Kose, Sugawara, and Terrones (2019, 2020); World Bank.
Note: EMDEs = emerging market and developing economies.
A.-C. Sample includes 183 economies, though the sample size varies significantly by year. Past global recessions shading includes 1945-46, 1975, 1982, 1991, and
2009 global recession episodes.
As highlighted by the Faltering Recovery scenario, the same time, fiscal authorities can address investor
however, the favorable external environment may not last, concerns about long-run debt sustainability by
and many EMDEs are vulnerable to a sudden shift in strengthening fiscal frameworks, enhancing debt
external conditions. This underscores the need for policy transparency, and improving debt management by issuing
makers to take full advantage of the currently favorable long-duration debt denominated in local currency. If fiscal
external environment to implement reforms that increase revenues surprise temporarily on the upside, these can be
the resilience of financial systems and improve fiscal used to replenish depleted fiscal buffers or to fund critical
sustainability. On the macroprudential front, steps can investment and development needs. When combined,
include enhancing macroprudential supervision, closely these policies can go a long way in making economies
monitoring systemic risks in the financial system, and more resilient to external shocks and less susceptible to
incentivizing domestic banks to rebuild capital buffers. At episodes of financial stress.
Price pressures associated with supply bottlenecks restrictions and reluctance to travel so long as the
are likely to abate over time as global growth virus is not completely under control (figure
moderates and shippers expand capacity. 1.4.D; UNWTO 2021).
High-frequency data point to a pickup in some Trade growth is hampered by high trade costs,
components of services trade, such as which remain particularly elevated in EMDEs
telecommunications and financial services (figure (chapter 3). Trade costs primarily arise from
1.4.C). Tourism remains depressed, however, even transportation expenses and cumbersome customs
in countries that have not experienced major procedures, and are likely to have increased further
outbreaks, such as small island economies. as a result of protectionist measures, such as tariffs
International travel is expected to be constrained on U.S.-China trade and export controls on food
for some time owing to lingering mobility and medical products (WTO 2020). In all, globalYou can also read