Te Aroha Spa Development Business Case - March 2020 & PARTNER CONSULTANTS - Matamata-Piako ...
←
→
Page content transcription
If your browser does not render page correctly, please read the page content below
& PARTNER CONSULTANTS

March 2020

Te Aroha Spa Development
Business Case
INFORMATION
 Document Reference                          Te Aroha Spa Development Business Case

                                             Craig Jones, Gordon Cessford, Rob McDonald, Lawrence McIlrath, Ana
 Primary Authors
                                             Crawford, Mark Bramley and Phil Howard.

 Sign off                                    Craig Jones

 Version                                     Final Te Aroha Spa Business Case

 Date                                        29th March 2020

Disclaimer:

Information, data and general assumptions used in the compilation of this report have been obtained from sources believed
to be reliable. Visitor Solutions Ltd has used this information in good faith and makes no warranties or representations, express
or implied, concerning the accuracy or completeness of this information. Interested parties should perform their own
investigations, analysis and projections on all issues prior to acting in any way regarding this project.

© Visitor Solutions 2020.

TE AROHA SPA DEVELOPMENT | BUSINESS CASE                                                                                            1
CONSULTANT TEAM

                             Deloitte

TE AROHA SPA DEVELOPMENT | BUSINESS CASE   2
EXECUTIVE SUMMARY
In order to stimulate business growth and economic development that improves social cohesion, economic and cultural
outcomes for the Te Aroha community, a business case has been commissioned to conceptualise and explore a range of visitor
experiences associated with the development of the Te Aroha visitor precinct (Te Aroha Domain and its surrounds).

The client perceived the existing natural, historical and cultural assets of the Te Aroha Domain, and its surrounds, could be
enhanced and developed into a spa resort. Well situated in the Auckland-Hamilton-Tauranga triangle, Te Aroha may leverage
and capture some of the emerging tourism business. A consortium led by Visitor Solutions was appointed to undertake a
business case to assess these opportunities within Te Aroha.

The business case concluded:

Strategic Case

1.   Based on available data, the best catalyst tourism opportunity is the development of a new spa facility which operates
     using the available geothermal resource.

2.   The Te Aroha spa concept has widespread support from sectors of the community, including Mana Whenua during
     community engagement.

3.   The need for the development was clear given factors such as the existing spa being tired (and well below industry
     standards), having a lack of capacity (turning visitors away) and the growth of the spa and wellness sector (domestically
     and internationally).

Economic Case

4.   A series of spa options were developed that take into consideration risk mitigation. Option B was identified as the
     preferred option and explored further in the Business Case. The options considered were:

     •    Option A: A new spa development utilising 63m2 of geothermal pool surface water in total (Gross Floor Area, GFA
          of 1,161 m2) including parking = $14.8 million in current dollars (without escalation costs).

     •    Option B: A new spa development utilising 125m2 of geothermal pool surface water via doubling the current
          geothermal water consent (GFA of 1,378 m2) including parking = $17.4 million in current dollars (without escalation
          costs). This increases the development cost to $19.2 million allowing for escalation to the forecast completion time
          of June 2023.

     •    Option C: A new spa development utilising 125m2 of geothermal pool surface water in total via using the existing
          consented geothermal consent and using heat pumps for additional heating (GFA of 1,378 m2) including parking =
          $17.9 million in current dollars (without escalation costs).

5.   The preferred option is Option B, which is forecast to

              a.   Provide an average of 27 full time equivalent jobs for 13 months in pre-construction and an average of 80
                   in construction for 18 months (107 FTE jobs in total).

              b.   Directly provide 33, growing to 65, full time equivalent jobs in the spa/ pool operation.

              c.   Deliver positive benefits, even if the anticipated growth does not materialise or if the project costs are
                   exceeded.

              d.   Have a catalyst effect and trigger other developments in the local economy and generate additional
                   benefits that are not accounted for in the economic analysis. There are several individuals and entities that
                   have expressed a desire to develop a range of new businesses on the back of the proposed spa. This will
                   add further jobs to the region. If all the opportunities we are aware of occur, circa 25-30 new FTE positions
                   would be created. This figure excludes growth in existing businesses.

Commercial Case

6.   The spa facility will be Council owned and operated. It is assumed Council would operate the Spa as a division of Council.
     It is recommended the spa operate at arm’s length from Council and have an independent skill based advisory board.

Financial Case

7.   Based on the estimated volumes, pricing, operational costs and capital costs the redevelopment of the spa and pools in
     Te Aroha is considered financially viable.

TE AROHA SPA DEVELOPMENT | BUSINESS CASE                                                                                           3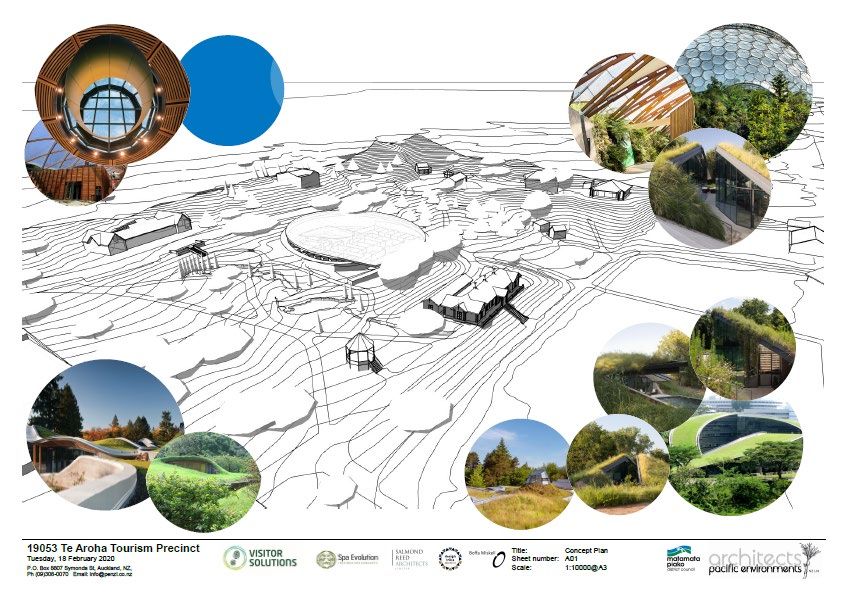
8.   As a largely fixed cost operation, the financial viability is sensitive to changes in volume and price.

9.   Assistance from the Provincial Growth Fund should be sought for a grant of 50% of the cost of development of the Spa
     circa $10 million (including additional implementation costs). The remaining cost should be debt funded by Council.

Management Case

10. A professional Project Manager should be employed to manage the project. A Project Management Plan should be
    developed for the project which outlines the objectives, the way the project should be structured, who the key
    stakeholders are and their responsibilities, and the methodologies used to successfully implement the project
    management strategies. A representative project management group (PCG) should also be established to drive the
    project.

TE AROHA SPA DEVELOPMENT | BUSINESS CASE                                                                                    4
CONTENTS
EXECUTIVE SUMMARY ............................................................................................................................................................................. 3
CONTENTS ............................................................................................................................................................................................... 5
1.0 PURPOSE ..................................................................................................................................................................................... 6
2.0 STRATEGIC CASE.......................................................................................................................................................................... 7
2.1 STRATEGIC CONTEXT .............................................................................................................................................................. 7
2.2 DEMOGRAPHICS ..................................................................................................................................................................... 9
2.3 GOVERNMENT / LOCAL GOVERNMENT CONTEXT ................................................................................................................ 19
2.4 THE NEED FOR INVESTMENT ................................................................................................................................................ 21
2.5 THE CASE FOR CHANGE ........................................................................................................................................................ 27
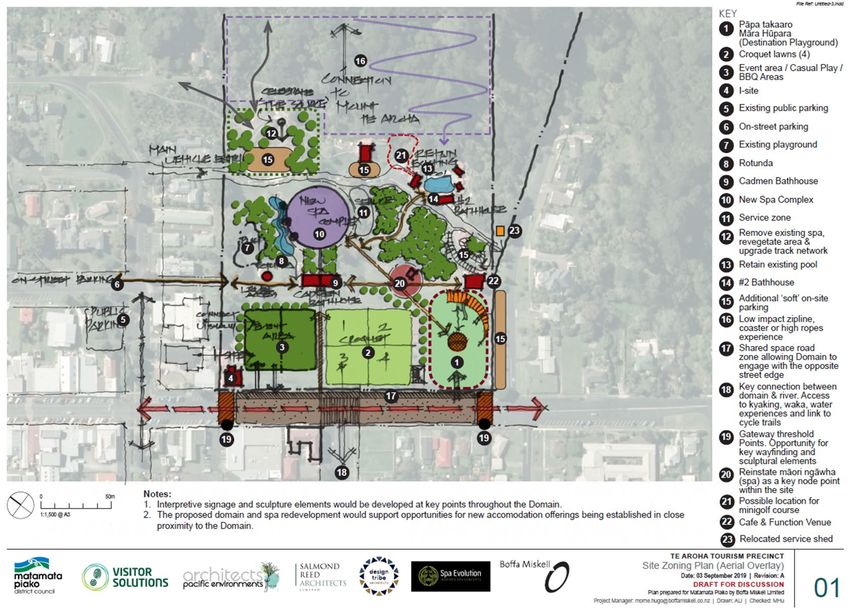
2.6 THE PROPOSED SPA DEVELOPMENT .................................................................................................................................... 29
3.0 ECONOMIC CASE ........................................................................................................................................................................36
3.1 CRITICAL SUCCESS FACTORS ................................................................................................................................................. 36
3.2 SHORT-LISTED OPTIONS ....................................................................................................................................................... 36
3.3 THE PREFERRED OPTION ...................................................................................................................................................... 38
3.4 ECONOMIC ANALYSIS ........................................................................................................................................................... 38
4.0 COMMERCIAL CASE ....................................................................................................................................................................46
4.1 FACILITY MANAGEMENT STRATEGY ..................................................................................................................................... 46
4.2 PROCESS / CONTRACT REQUIREMENTS ............................................................................................................................... 52
4.3 SERVICE RISKS ....................................................................................................................................................................... 52
5.0 FINANCIAL CASE .........................................................................................................................................................................59
5.1 GENERAL ASSUMPTIONS ...................................................................................................................................................... 59
5.2 CAPITAL ASSUMPTIONS ........................................................................................................................................................ 59
5.3 VISITS .................................................................................................................................................................................... 59
5.4 PRICING ................................................................................................................................................................................ 60
5.5 OTHER REVENUE .................................................................................................................................................................. 60
5.6 STAFFING .............................................................................................................................................................................. 60
5.7 OTHER COSTS ....................................................................................................................................................................... 60
5.8 FUNDING .............................................................................................................................................................................. 61
5.9 FORECAST FINANCIAL PERFORMANCE ................................................................................................................................. 61
5.10 SENSITIVITIES ........................................................................................................................................................................ 63
6.0 MANAGEMENT CASE ..................................................................................................................................................................65
6.1 PROJECT MANGEMENT APPROACH...................................................................................................................................... 65
6.2 PROCUREMENT MANAGEMENT ........................................................................................................................................... 67
6.3 PROJECT PROGRAMME ........................................................................................................................................................ 69
6.4 RISK MANAGEMENT ............................................................................................................................................................. 69
6.5 BENEFITS .............................................................................................................................................................................. 69
6.6 POST EVALUATION ARRANGEMENTS ................................................................................................................................... 69
7.0 APPENDIX ..................................................................................................................................................................................70
7.1 Appendix 1: Ngati Rahiri Tumutumu Position Letter ............................................................................................................ 70
7.2 Appendix 2: Heritage Architectural Review .......................................................................................................................... 73
7.3 Appendix 3: Preliminary Quantity Survey ............................................................................................................................. 78
7.4 Appendix 4: Geothermal Water Consenting ......................................................................................................................... 87
7.5 Appendix 5: Indicative Project Programme .......................................................................................................................... 91
7.6 Appendix 6: Competitor analysis .......................................................................................................................................... 93
7.7 Appendix 7: Best Practice ..................................................................................................................................................... 95
7.8 Appendix 8: Mana Whenua and wider community perspectives ......................................................................................... 97
TE AROHA SPA DEVELOPMENT | BUSINESS CASE 5
1.0           PURPOSE

In order to stimulate business growth and economic development that improves social cohesion, economic and cultural
outcomes for the Te Aroha community, a business case has been commissioned. This work conceptualises and explores
options for the development of a spa complex within the Te Aroha visitor precinct (centred around the Te Aroha Domain).

The proposed spa development forms part of a wider regeneration of the Te Aroha visitor precinct. The initiative is supported
by Ngati Rahiri Tumutumu, the community, the business sector, tourism organisations and importantly Matamata-Piako
District Council and the Provincial Growth Fund who funded the initial feasibility and business case project phases.

2.0 STRATEGIC CASE
2.1 STRATEGIC CONTEXT
LOCATION
Te Aroha is located very strategically and centrally within an area of the upper North Island sometimes termed ‘The Golden
Triangle' - named as such for its growing concentration of domestic population, visitor arrivals and transport/commerce
connections (Figure 2.1).
Figure 2.1: The 'Golden Triangle' Area
This area incorporates New Zealand’s predominant domestic population concentration 1, and is defined by Auckland, Hamilton
and Tauranga. It effectively incorporates the combined populations of the Auckland, Waikato and Bay of Plenty Regions,
representing around 2.5 million residents all within under a 2-hour drive of Te Aroha.
Te Aroha is located approximately 130km (1.5 hours drive) from New Zealand’s main tourism entry point of Auckland Airport.
Over the year ending June 2019 2, Auckland Airport received around 1.31 million people making holiday/vacation visits to New
Zealand. In addition, Auckland received around 211,000 cruise ship passenger arrivals in the year ending June 2018, while
Tauranga received around 152,000 3.
Combined, these domestic residents and international visitors represent the largest potential visitor catchment available
within 2 hours drive. Additionally, Te Aroha's location has numerous strategic characteristics:
• It is located on State Highway 26 which joins Hamilton to the Coromandel Peninsula (via Morrinsville and Paeroa).
• On State Highway 26, Te Aroha is located only 20km (17 minutes drive) south of the State Highway 2 turnoff at
Paeroa; State Highway 2 links Auckland to Tauranga/Bay of Plenty.
• On State Highway 26 Te Aroha is located only 55km (50 minutes drive) east of the State Highway 1 turnoff at
Hamilton; State Highway 1 links Auckland to Hamilton/Waikato and the rest of the North Island (this is also the
closest current connection to rail services).
• Te Aroha is also located only 14km (12 minutes drive) east of Tatanui where State Highway 26 crosses State Highway
27; which provides a second Auckland to Tauranga/Bay of Plenty link option (via Matamata).
• Te Aroha is also located:
at the western gateway to Kaimai-Mamaku Forest Park (via tracks at Mt Te Aroha, Wairongomai etc.).
centrally along the Waihou River which has been variously navigable from the Firth of Thames to Te
Aroha and beyond for various craft at different times (subject to channel conditions).
centrally along the Hauraki Rail Trail from Kaiua/Miranda south to Matamata
1 Combined population of around 2.5 million in 2018 (Statistics NZ Population Estimates)
2 Statistics New Zealand, International Travel and Migration: Visitor arrivals by country of residence, purpose and NZ port (Annual-Jun)
3 Statistics New Zealand, Cruise Ship traveller and expenditure statistics: YE 2018. Note, many may have been counted as visitors at both Ports.
TE AROHA SPA DEVELOPMENT | BUSINESS CASE 7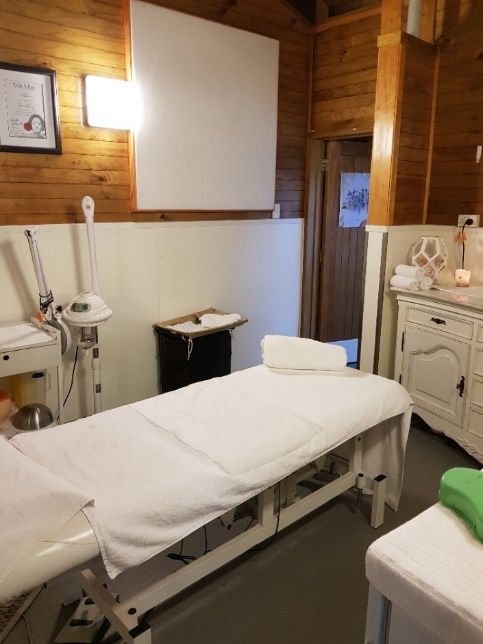
28km (20 minutes’ drive) south of the Karangahake Gorge and its attractions/gateways to Kaimai-
Mamaku Forest Park.
50km south of both the Kopu/Thames and Waihi gateways to the Coromandel Peninsula.
37km (30 minutes drive) north of the growing tourism hub in Matamata (with its core Hobbiton
attraction).
MANA WHENUA HISTORY
"Ngati Rahiri Tumutumu have occupied Te Aroha since ancient times and held the mana over the mountain, hot springs and
surrounding whenua. The mountain and hot springs are sacred to the tribe, a taonga.
Ngati Rahiri Tumutumu consider Mount Te Aroha to be wahi tapu associated with their ancestors, particularly Te Ruinga. A
maunga tapu is a spiritual halfway station between this world and the next. In traditional stories, patupaiarehe inhabit its
misty peaks embodying and intensifying the tapu nature of the mountain. The hot springs at the base of the mountain flow
out of its heart, right underneath Te Ruinga’s later pa site at Whakapipi.
Maori tradition ascribes the hot springs to the taniwha, Ureia, who left the Okoroire hot springs to gouge out the channel of
the Waihou River. He is said to have taken several gourds of hot water from O-koroire to leave at various points, including O-
kauia springs and Te Aroha which lie along the Hauraki fault line.
Ngati Rahiri Tumutumu have always used the waters – the cold water for drinking and the hot water for bathing and healing.
For centuries, battle wounded Maori often repaired themselves in Te Aroha by bathing in the springs. During the Waikato
Wars, many wounded warriors were brought to the waters for healing and recuperation. Maori were also reported to have
been brought from miles around by sleigh to receive the benefits of the healing waters. Ngati Tumutumu chief, Te Mokena
Hou, hosted the Maori King, Te Whaio, on numerous occasions in the 1880s. Te Whaio bathed in the pools to relieve his
rheumatism. Old warriors also used the waters to soak in to relive symptoms of rheumatism and old age. Diseases of the eye
were treated by the colder springs.
Maori built clay walls to create bathing pools and dammed the water flow with rocks to regulate the temperature by
controlling the flow of hot and cold water into the pools. Maori would also contain the water by using raupu.
Following three fiercely contested cases in the land court, the Crown acquired the Aroha block in 1878. Various reserves were
granted back to the tribe in the block including the Omahu Reserve which was originally to include the hot springs. Just before
the vesting, 20 acres around the hot springs were excluded from the reserve. Crown control of the hot springs was asserted
through the Aroha block purchase and several pieces of subsequent legislation. Tribe members either hold the view that the
hot springs were confiscated, or the hot springs were gifted by the chief Te Mokena Hou on the condition that Maori were to
continue to have free unencumbered access to their waters (the latter being supported by documentary evidence). The
perception of Te Mokena Hou of a joint partnership in the joint management of the hot springs was ignored by the Crown as
it progressively sought to remove Maori from management and access to their taonga. The Waitangi Tribunal found that the
Crown had failed to protect the traditional values and kaitiakitanga of Ngati Rahiri Tumutumu in Te Aroha mountain and hot
springs and the management of those places.
Ngati Rahiri Tumutumu today still hold the mountain and hot springs sacred. The current structures and containment of the
Mokena geyser have destroyed the wairua of the waters. Ngati Rahiri Tumutumu have been excluded from access and
management of the waters, as promised by the Crown back in 1878 and yearn to have this remedied and the wairua of the
waters restored".
Text kindly provided by Ngāti Rahiri Tumutumu (September 2019).
Ngati Rahiri Tumutumu considers that the redevelopment of the Spa and surrounding domain aligns strongly to its own
strategic objectives. The development affords Ngati Rahiri Tumutumu strategic opportunities both culturally and economically
(see Appendix 1 for a letter outlining Ngati Rahiri Tumutumu perspectives).
SPA HISTORY
This section summarises the history of Te Aroha with respect to its development as a spa destination 4.
Mana Whenua have been aware of the Te Aroha hot springs and making use of the waters for hundreds of years before
European arrival.
4 A more general and comprehensive summary of the town’s history and development from pre-European times to the present can be found on the
Matamata-Piako District Council website https://www.mpdc.govt.nz/about-te-aroha/te-aroha-history
TE AROHA SPA DEVELOPMENT | BUSINESS CASE 8
European visitor use of the hot springs began to build after the opening of the Thames Goldfield in 1867, with many residents
of the ensuing ‘boomtown’ of Thames travelling up the Waihou River for recreational activities, including regular excursions
visiting the hot springs at Te Aroha. The possibility of a 'sanatorium' being developed at Te Aroha was raised as early as the
1870s.

A decade later, the discovery of gold at Te Aroha (1880) and nearby Wairongomai (1881) led to Te Aroha’s own time as a
‘boomtown’. While this was only a short-lived period it contributed to improved access to Te Aroha and improved
infrastructure within it. In 1880 regular boat services commenced up the Waihou River between Thames and Te Aroha and a
coach service was established from Hamilton. Following Te Aroha land purchases in 1878, the springs area was designated the
‘Te Aroha Hot Springs Reserve’ in 1882 under the Public Domains Act. The construction of the first permanent Bath Houses
began in 1883. In 1885 the initial landscape development began including manicured lawns, provision for lawn tennis and
racket courts, and tree planting. Further springs were being opened and the paths were beginning to be constructed linking
the new features.

By this time Te Aroha was becoming increasingly well known as a tourist spa destination. The railway from Hamilton to Te
Aroha was completed in 1886, opening a direct link from Auckland and greatly increasing Te Aroha’s accessibility and
popularity for visitors. This was enhanced by the opening of the Thames to Te Aroha railway link in 1889, increasing local
accessibility, and creating an option to boat from Auckland to Thames and then taking the railway. With these enhanced
accessibilities the town of Te Aroha developed rapidly with visits to the hot pools progressively taking over from mining as the
main driver. There was accommodation for up to 500 visitors and in the year ended March 1887, 28,553 baths were taken at
Te Aroha, compared with only 4,878 in Rotorua over the same period. By the 1890s Te Aroha had become the most popular
Spa in the country (although Rotorua soon took over following its connection to the rail network in 1894).

In Te Aroha Domain itself the Cadman Bath House and a new band rotunda were opened in 1898. By the turn of the century
22 springs had been discovered. And by 1910 many new facilities were established including new and well-used bowling
greens, croquet lawns, tennis courts (grass and asphalt), baths and bath houses, massage rooms, a tea kiosk, and staff facilities.

Visits had initially been driven by the attraction of the reputed ‘curative’ properties of the hot spring waters, which were a
very strong driver of tourism in the late 19th and early 20th century.

Over time visits became increasingly driven by recreational experience opportunities as well as expectations of therapeutic
outcomes. The Domain became a popular picnic spot and school parties regularly came on special excursion trains. Apart from
the hot springs and the recreation opportunities associated with the Domain itself, these visitors also enjoyed visits to the
mines, walks on Mount Te Aroha and along the river, and river trips. Te Aroha became an especially popular destination for
day-trippers on public holidays. It was reported that on New Year’s Day 1912, 7,000 visitors arrived in Te Aroha for the day.
Many of such visitors arrived on special excursion trains from Auckland, which took five hours each way.

From their heyday in the early 20th Century there ensued a gradual decline. This resulted in part initially from the rise of
Rotorua as the pre-eminent spa destination, a loss of rail and river access options, and then increasingly from a general decline
in the attraction of the ‘health-spa’ destination concept overall. People still continued to use the baths, but with emphasis on
more casual recreational enjoyment than the more formal health-driven ‘taking of the waters’. Most facilities had closed or
were re-purposed by the mid-20th century, although basic maintenance of the Domain and retention of its facilities continued.

In signs of turning the corner in more recent years there appear to have been some reconsolidation of experiences in the
Domain. ‘Te Aroha Mineral Spas’ was opened in 1980, providing modern spa pools using the thermal soda water. ‘Swim Zone
Te Aroha’ was opened in 1990, providing a new outdoor swimming and soaking pool. In 1997 the historic No.2 Bath House
was restored as a heritage bathing pool, the No.7 Bath House refurbished, a new Foot Pool established, and historic lakelets
re-established. Development of tracks for walking and mountain biking starting from the Domain has also added new activities
and visitors. Overall the focus appears to have now shifted to as much a historic heritage theme as a hot springs theme.
Compared to other thermal water attractions in New Zealand, the living historic heritage component now appears to represent
a particularly unique feature of the Te Aroha Hot Springs attraction.

2.2 DEMOGRAPHICS

This section addresses the population numbers, demographics and trends among potential domestic visitor catchments and
for the host community. It considers features such as age, ethnicity and other socioeconomic indicators.

TE AROHA SPA DEVELOPMENT | BUSINESS CASE                                                                                             9
The catchment populations for the proposed Te Aroha spa are viewed here at three ‘catchment’ levels - ‘Te Aroha’ (as the
host community); ‘Matamata-Piako’ District and the ‘Golden Triangle’ Regions 5. Information on changes in population
numbers and the compositions of age-groups and ethnicities are presented overleaf. The main summary points are that:

        •    There has been a population growth trend in Te Aroha over recent years after a long period of steady but slight
             decline. Across the wider ‘Golden Triangle’ Regions numerical growth has been strong (particularly in Auckland).
        •    An aging local age-profile with projections indicating those aged 65+ projected to increase (and reducing numbers in
             all other age-groups). This pattern was weaker across the Golden Triangle Regions, and least apparent for Auckland.
        •    Very high proportions of Europeans in local Te Aroha/Matamata-Piako populations, but higher proportions and
             larger numbers across the Golden Triangle Regions (particularly in Auckland).
        •    Projections of strongly increasing Non-European ethnicities generally, although this only represents large new
             population numbers in the Golden Triangle Region (and particularly Auckland).
        •    Lower proportions of overseas born people living more locally than for the ‘Golden Triangle’ Regions overall (and
             Auckland in particular).
        •    Lower socioeconomic indicators for the Te Aroha population compared with the populations of Matamata-Piako
             District overall and wider catchment areas. Underscoring the need for economic development in Te Aroha.

Overall, the market opportunities for the new spa development will need to focus on the Golden Triangle Region (particularly
Auckland) and/or overseas visitor populations (rather than just the local market).

OVERALL POPULATION NUMBERS AND TRENDS

Table 2.1 presents the populations of the respective catchment areas at the most recent 2018 Census. It also includes data
from the previous three censuses to illustrate recent population trends. This shows that over the last 15-20 years there has
been general growth across all potential population catchment areas. This growth has been less for the Matamata-Piako
District overall than the wider ‘Golden Triangle’ area (particularly Auckland). Within the District relative growth has actually
been somewhat higher in Te Aroha. This represent a change from the years prior to 2001 when the District population had
been declining.

Table 2.1: Current population and recent trends (2001-2018)

                                                         2001              2006              2013           2018          Change       % change
                                                                                                                          2001-18

    Te Aroha                                             3,684             3,771             3,906          4,554           870           24

    Matamata-Piako                                      29,469             30,480           31,536         34,404          4,935          17

    ‘Golden Triangle' Regions                         1,756,032        1,943,163          2,086,932      2,338,419        582,387         33

                                  Auckland Region        1,160,271         1,304,961         1,415,550     1,571,718       411,447             35

                                  Waikato Region           356,346           380,823          403,638        458,202       101,856             29

                              Bay of Plenty Region         239,415           257,379          267,744        308,499         69,084            29

Source: Statistics NZ Censuses 2001-2018

Closer examination reveals that most of this overall growth has occurred in the last few years (with higher rates in Te Aroha).
Table 2.2 compares the population growth in these areas for a 5-year period between the 2001-006 censuses, and more
recently in the 5-year period between the 2013-2018 censuses.

Table 2.2: Comparative population change 2001-06 and 2013-18

                                                     Change            %           Change        %
                                                     2001-06         change        2013-18     change

    Te Aroha                                             87            2            648             17

    Matamata-Piako                                     1,011           3            2,868            9

5   The immediate local user catchment area within around 5km of Te Aroha is labelled here as ‘Te Aroha‘, as represented by the ‘Te Aroha East’ and
    ‘Te Aroha West’ Statistical Areas (SA2s). Prior to Census 2018 Te Aroha was represented by the single Statistics New Zealand Census Area Unit
    (CAU) of ‘Te Aroha’. Beyond this local town catchment is the larger population of the Matamata-Piako District Council area, labelled here as
    ‘Matamata-Piako’. And from a Regional perspective the ‘Golden Triangle Regions’ (combining Waikato, Auckland and Bay of Plenty Regions)
    provide the larger population catchment for potential domestic visitors.

TE AROHA SPA DEVELOPMENT | BUSINESS CASE                                                                                                              10
‘Golden Triangle' Regions 187,131 11 251,487 12
Auckland Region 144,690 12 156,168 11
Waikato Region 24,477 7 54,564 14
Bay of Plenty Region 17,964 8 40,755 15
Source: Statistics NZ Censuses 2001-2018
This shows population growth has been occurring at higher rates over the last 5 years across the ’Golden Triangle’ Regions
generally, and for Te Aroha in particular. Looking forward this appears to signal a change from the relatively low-growth
population projections made by Statistics New Zealand for Matamata-Piako (based on standard census 2013 projections 6) and
of subsequent customised projections made later in 2013 and in 2017 7. Table 2.3 summarises the most recent Statistics NZ
projection (Census 2013 base) which illustrates relatively low projected growth.
6 Corresponding standard projections based on the most recent 2018 Census have not yet been released.
7
Customised growth projections for Matamata-Piako District based on Census 2013 data were made later in 2013 by the University of Waikato’s
National Institute of Demographic and Economic Analysis, and then reviewed out to 2048 along with the base Statistics NZ data by Rationale
Limited in 2017 as part of the Long-Term Plan 2018-2048. In both cases the actual Census 2018 population counts for Te Aroha exceeded those
that had been projected for 2018.
TE AROHA SPA DEVELOPMENT | BUSINESS CASE 11Table 2.3: Projected population and future trends (2018-2043)
2018 2043 Change %
2018-43 change
Te Aroha 4,240 4,360 120 3
Matamata-Piako 35,000 37,000 2,000 6
‘Golden Triangle' Regions 2,470,600 3,241,400 770,800 31
Auckland Region 1,699,900 2,326,200 626,300 37
Waikato Region 467,200 562,100 94,900 20
Bay of Plenty Region 303,500 353,100 49,600 16
Source: Statistics NZ Census 2013base
In all these cases the actual population counts from Census 2018 exceeded the population levels projected for 2018, indicating
that current population growth is tracking higher than that most recently projected. For Te Aroha in 2018, while Statistics New
Zealand had projected a population of 4,240, and the most recent 2017 ‘Rationale’ customised projection (as used for the
LTP) had estimated a population of 4,258, the actual Census 2018 count was 4,554.
This indicates growth is exceeding that projected and that the projected population of Te Aroha in future years may be notably
higher than indicated from currently available projections. The latest new projections based on Census 2018 figures are due
for release in late 2020. Overall, notable population growth can be anticipated for Te Aroha, for the surrounding Matamata-
Piako District and particularly for the wider Golden Triangle Regions.
Added to overall population growth will be changes in population composition, most significantly around age-group and
ethnic-group proportions. Socioeconomic indicators were also considered. Some key population characteristics and are
summarised below.
AGE CHARACTERISTICS AND PROJECTIONS
Figure 2.1 and Table 2.4 show that compared with the wider ‘Golden Triangle’ Regions the Te Aroha population’s age-group
distribution was notably ‘older’. Te Aroha had notably higher proportions of older adults (60+years), and notably lower
proportions of younger adults (20-39years). The effect was also apparent for Matamata-Piako population, although to a lesser
extent. This was reflected in the respective median ages of 48 for Te Aroha, 41 for Matamata-Piako and 37 for the ‘Golden
Triangle’ Regions overall.
Figure 2.1: Age-group distribution
25
Te Aroha
Matamata-Piako 20
20
Golden Triangle' Regions
% in age-group
15
15
15 14 14 14
13
14
13 13 13
12 13 12
12 12 12
11 11
11
10
10 9 9 9
5
0
0-9 Years 10-19 Years 20-29 Years 30-39 Years 40-49 Years 50-59 Years 60-69 Years 70+ Years
TE AROHA SPA DEVELOPMENT | BUSINESS CASE 12Table 2.4: Age group distribution
0-9 10-19 20-29 30-39 40-49 50-59 60-69 70+ Total Med
Years Years Years Years Years Years Years Years Age
Te Aroha 12 11 9 9 11 13 15 20 4,551 48
Matamata-Piako 14 13 12 11 12 13 12 14 34,407 41
‘Golden Triangle' Regions 14 13 15 14 13 12 10 9 2,338,419 37
Auckland Region 14 13 16 15 13 12 9 8 1,571,718 35
Waikato Region 14 13 13 12 13 13 11 11 458,199 37
Bay of Plenty Region 14 13 11 11 13 13 12 13 308,502 40
Source: Statistics NZ Census 2018
Looking forward over the next 25 years, Table 2.5 and Figures 2.2 and 2.3 show that a general pattern of domestic population
aging is projected for all catchments. In all catchment the oldest age groups (60+yrs) were projected to increase markedly,
with actual numeric population decline in the younger age groups.
The exception was in the Golden Triangle Regions where no age-group numbers decreased (reflecting a strong Auckland
profile of growing younger age-groups). In Te Aroha the already older age profile was projected to age most strongly, with the
proportion of those aged 65+ increasing from 26% of the population in 2018 to 35% by 2043. Corresponding figures for
Matamata-Piako were a projected increase from 19% to 30%, and in the Golden Triangle Region’s from 14% to 21% (although
less so in Auckland).
Table 2.5: Age-group projections 2018-2043
Te Aroha 2018 2043 Change 2018- % change
2043
0-14 Yrs 820 660 -160 -20
15-39 Yrs 1,010 970 -40 -4
40-64 Yrs 1,300 1,190 -110 -8
65 Yrs+ 1,120 1,530 410 37
Total 4,250 4,350 100 3
Matamata-Piako 2018 2043 Change 2018- % change
2043
0-14 Yrs 7,300 6,300 -1,000 -14
15-39 Yrs 10,200 9,200 -1,000 -10
40-64 Yrs 10,700 10,500 -200 -2
65 Yrs+ 6,700 11,000 4,300 64
Total 34,900 37,000 2,100 6
Golden Triangle Regions 2018 2043 Change 2018- % change
2043
0-14 Yrs 483,500 532,600 49,100 10
15-39 Yrs 908,600 1,008,300 99,700 11
40-64 Yrs 739,800 1,034,100 294,300 40
65 Yrs+ 338,600 666,400 327,800 97
Total 2,470,500 3,241,400 770,900 31
Source: Statistics NZ Population Projections (2018 base)
TE AROHA SPA DEVELOPMENT | BUSINESS CASE 13Figure 2.2: Projected age-groups (2018-2043) – Te Aroha
1,800
1,600
1,400
Number in age-group
1,200
1,000
800
0-14 Yrs
600
15-39 Yrs
400 40-64 Yrs
65 Yrs+
200
0
2018 2023 2028 2033 2038 2043
Source: Statistics NZ Population Projections (2018 base)
Figure 2.3: Projected age-groups (2018-2043) – Golden Triangle Regions
1,200,000
1,000,000
800,000
Number in age-group
600,000
0-14 Yrs
400,000
15-39 Yrs
200,000 40-64 Yrs
65 Yrs+
0
2018 2023 2028 2033 2038 2043
Source: Statistics NZ Population Projections (2018 base)
These data show that in the future (based on existing Statistics NZ projections) an environment of only slight local population
growth, but strong wider Regional population growth (particularly in Auckland) is likely to occur. Accompanying this will be
increasing proportions of older people represented in those populations.
ETHNIC CHARACTERISTICS AND PROJECTIONS
Figure 2. 4 and Table 2.6 illustrate that the Te Aroha and Matamata-Piako populations have higher proportions of Europeans
(around 85%) compared with the ‘Golden Triangle’ Regions (61%). They also have lower proportions of Asian (~6%) and Pacific
(~4%) residents compared with the ‘Golden Triangle’ Regions (22% Asian and 11% Pacific).
Figure 2.4: Ethnic Composition of Catchment Populations (including %’s)
TE AROHA SPA DEVELOPMENT | BUSINESS CASE 14100
90 86 85 Te Aroha
80 Matamata-Piako
70 Golden Triangle Regions
61
60
% of population
50
40
30
22
18
20 17 16
12
10 4
6 6
2 1 1 2
0
European Māori Pacific Asian Other
Table 2.6: Ethnic Composition of the Catchment Populations
European Māori Pacific Asian Other Total
Te Aroha 3,909 804 177 291 39 4,554
Matamata-Piako 29,370 5,733 729 1,968 279 34,404
Golden Triangle Regions 1,426,638 380,460 275,634 508,551 51,465 2,338,419
Auckland Region 851,583 181,194 243,966 442,674 42,399 1,571,718
Waikato Region 345,198 109,488 20,742 43,755 6,357 458,202
Bay of Plenty Region 229,857 89,778 10,926 22,122 2,709 308,499
Source: Statistics NZ Census 2018
Looking forward in Tables 2.7 and 2.8, ethnic population composition is projected to diversity. The effect of this growth in
Matamata-Piako will only be slight given low base numbers currently identifying with the non-European ethnicities. The
relative proportions of groups are projected to barely change. By contrast the larger scale growth of ethnic diversity across
the Golden Triangle Regions is much more significant, particularly in Auckland. Across these regions while base numbers
increase the proportion identifying as Europeans decreases from 59% (2023) to 54% (2038), while the proportion identifying
as Asian increases from 25% (2023) to 29% (2038).
Table 2.7: Projected ethnic group proportions (2023-38) – Matamata-Piako
2023 2028 2033 2038 Change 2018- % change
38
European 30,000 30,300 30,400 30,300 300 1
Maori 6,390 7,030 7,730 8,510 2,120 25
Pacific 870 1,020 1,180 1,360 490 36
Asian 2,630 3,000 3,370 3,720 1,090 29
Total 35,900 36,500 36,900 37,100 1,200 3
Source: Statistics NZ Subnational ethnicity projections 2013base
TE AROHA SPA DEVELOPMENT | BUSINESS CASE 15Table 2.8: Projected ethnic group proportions (2023-38) – Golden Triangle Regions
2023 2028 2033 2038 Change 2018- % change
38
European 1,585,700 1,629,500 1,666,200 1,693,500 706,700 72
Maori 413,400 446,700 482,000 519,700 314,800 154
Pacific 318,050 352,250 388,250 425,050 145,550 52
Asian 656,700 747,800 834,400 916,800 349,300 62
Total 2,671,200 2,834,500 2,984,400 3,118,100 1,258,800 68
Source: Statistics NZ Subnational ethnicity projections 2013base
The low diversity of ethnicities in the local Te Aroha and Matamata-Piako areas is reflected further by the proportion of
residents born overseas. These proportions were only 17% and 15% respectively. Both were notably lower than the
corresponding figure for the ‘Golden Triangle’ Regions (32%), with most of this reflecting the Auckland Region (42%).
SOCIOECONOMIC STATUS INDICATORS
A selection of other variables was investigated to provide a summary socioeconomic context for the Te Aroha (host
community) and wider potential facility catchments. These provides some indication of the populations relative capacities to
engage in spa activities and to assist Te Aroha with its economic development. Selected results are briefly summarised below.
Median Incomes
Figure 2.5 shows that Te Aroha residents have relatively lower median incomes overall (i.e. personal, family and household
incomes) than do residents of the wider Matamata-Piako District and beyond.
Figure 2.5: Median Incomes
80,000
Te Aroha
70,000 Matamata-Piako
Golden Triangle Regions
60,000
Median income ($)
50,000
40,000
30,000
20,000
10,000
0
Median personal Income Median Family Income Median Household Income
Source: Statistics NZ Census 2018
Employment status
Figure 2.6 shows that Te Aroha residents have relatively lower levels of employment than the populations of the wider
catchment areas. However, those not working are more commonly out of the workforce rather than being unemployed. This
reflects the relatively older population in Te Aroha, which includes a higher proportion of retired residents. Data on sources
of income reinforced this with 34% of Te Aroha residents getting some income from super/pensions compared with 25% for
Matamata-Piako and 17% for the Golden Triangle Regions. Income sources from other benefits were largely consistent across
all areas, while income sources from wages/salaries/business were lower in Te Aroha.
Figure 2.6: Employment status
TE AROHA SPA DEVELOPMENT | BUSINESS CASE 1660
Te Aroha
50 Matamata-Piako
40 Golden Triangle Regions
% of population
30
20
10
0
Employed Full-time Employed Part-time Unemployed Not in the Labour
Force
Source: Statistics NZ Census 2018
Highest Education level
Figure 2.7 shows that Te Aroha residents have relatively lower education levels overall than do residents of the wider
Matamata-Piako District and beyond.
Figure 2.7: Highest Education levels
45
Te Aroha
40
Matamata-Piako
35
Golden Triangle Regions
30
% of population
25
20
15
10
5
0
No Qualifications Level 1-3 Certificate Level 4-6 Certificate Degree level Postgrad level
Source: Statistics NZ Census 2018
Overall Deprivation index
A key summary indicator of overall socio-economic conditions in an area is provided by the Deprivation Index, created by the
University of Otago using data from Statistics New Zealand Census (latest 2018). The index combines census data relating to
income, home ownership, employment, qualifications, family structure, housing, access to transport and communications.
Figure 2.8 below summarises the deprivation index scores for Statistic NZ SA2 units 8 around the Te Aroha area. The key
features are the relatively higher levels of moderate / high deprivation in the Te Aroha area (and in nearby settlements).
Figure 2.8: Deprivation Index levels around Te Aroha (by ‘Statistical Area 2’ units – SA2s)
8 Statistical Area 2 units which replaced the old ‘Census Area Unit’ areas in Census 2018.
TE AROHA SPA DEVELOPMENT | BUSINESS CASE 17Source: NZ Deprivation Index – University of Otago and Statistics NZ (Interactive map - NZ Herald Insights) Summary Conclusion The Te Aroha area has moderate / high deprivation levels, lower median incomes and higher proportion of people not in the labour force and higher proportions of residents with no or lower education qualifications. The area would clearly benefit from economic development initiatives such as the proposed spa redevelopment. The position of Te Aroha is also clearly very strategic with large catchment populations in the Waikato, Bay of Plenty and Auckland (The Golden Triangle) all within under two hours drive. These populations offer the proposed spa an excellent base domestic market. Auckland also serves as the gateway for many international visitors to New Zealand. TE AROHA SPA DEVELOPMENT | BUSINESS CASE 18
2.3 GOVERNMENT / LOCAL GOVERNMENT CONTEXT

  Central and local government policies, plans and strategies provide strategic context to the proposed spa development and
  the business case. The following section focuses on the Matamata-Piako District Council and central government’s Provincial
  Growth Fund.

  MATAMATA PIAKO DISTRICT COUNCIL

  The MPDC 2018-2028 Long Term Plan lists the Council’s vision as making the Matamata-Piako District the “place of choice”
  for lifestyle, opportunities and home, making our district an even better place to live, visit and an attractive place to invest”.

  The Strategic Priorities include:
  • Affordability:
           o To keep our rates at an affordable level.
  • Resilience:
           o     To ensure our debt is manageable and we allow ourselves some headroom to respond to emergencies or
                opportunities arising
  • Growth and Demand
           o Developing and implementing an economic strategy that encourages and supports economic growth in our
                District.
  • Compliance.

  These factors all have implications on the proposed development of the Te Aroha visitor precinct to help stimulate business
  growth and economic development that improves social cohesion, economic and cultural outcomes for the Te Aroha
  community. The proposed spa development forms part of a wider regeneration of the Te Aroha visitor precinct.

  The 2018-2028 Long Term Plan includes targets:

  •      That annual rates do not increase by more than 4%.

  •      Debt as a percentage of revenue will not exceed 150%. Current debt at 39.1 million and is forecast at $51.1 million by 30
         June 2020 and to increase to $76 million by 2028, or 115% of forecast 2028 revenue. The spa proposal, if funded alone,
         would increase this by approximately $19 million, even before consideration of the other components of the wider
         precinct that may also require additional MPDC funding support.

  Therefore, other sources of funding are required to achieve the Te Aroha precinct development.

  PROVINCIAL GROWTH FUND (PGF)

  The aim of the Provincial Growth Fund is to lift productivity potential in the provinces. Its priorities are to enhance economic
  development opportunities, create sustainable jobs, enable Māori to reach their full potential, boost social inclusion and
  participation, build resilient communities, and help meet New Zealand’s climate change targets.

  Investment tiers

  The Fund has three investment tiers which will deliver these priorities:

      Regional projects and capability                  Sector investment                               Enabling infrastructure projects
      Supporting    initiatives    for     economic     Investing in initiatives targeted at priority   Investing in regional infrastructure projects
      development, feasibility studies and capability   and/or high value economic opportunities.       that will enable connectivity, lift productivity
      building.                                                                                         and grow jobs.

  Oversight

  The Fund is overseen by a core group of Regional Economic Development Ministers who monitor the Fund’s performance and
  discuss regional opportunities. Supporting the Fund are two key groups – a Regional Economic Development Unit within the
  Ministry of Business, Innovation and Employment (MBIE) and an Independent Advisory Panel.

  TE AROHA SPA DEVELOPMENT | BUSINESS CASE                                                                                                                 19
The Unit is responsible for the Fund’s administration and monitoring its operation in consultation with other government
agencies. The Panel provides independent advice on sector projects and the balance of the portfolio of investments. The type
of project and scale of investment determines how funding is approved – whether senior government officials or Ministers.
Criteria for all tiers
Projects will be assessed against criteria organised around four themes:
1. Link to Fund and government outcomes: The project should lift the productivity potential of a region or regions and
contribute to other Fund objectives. This includes jobs, community benefits, and improved use of Māori assets,
sustainability of natural assets, and mitigating and adapting to climate change.
2. Additionality: The project needs to add value by building on what is there already and not duplicating existing efforts.
The project also needs to generate clear public benefit.
3. Connected to regional stakeholders and frameworks: Projects should fit in with (or link to) agreed regional priorities
and need to be supported by relevant local stakeholders.
4. Governance, risk management and project execution: Projects will need to be supported by good project processes and
those involved should have the capacity and capability to deliver the project. Projects need to have appropriate trade-
offs between risk and reward, and also need to be sustainable in the longer term beyond the Fund’s life.
PGF funding options
Investment types:
There are differing investment types made under the PGF.
• Non-commercial: An investment delivers a public benefit but has no revenue stream,
• Quasi-commercial: An investment generates a revenue stream, but this is insufficient to be funded by the private sector,
• Commercial: An investment may be viable for the private sector, but the PGF invests to create a public benefit that would
not otherwise occur.
Funding types:
The right form of project funding will depend on whether it's commercial, non-commercial, and the likely outcomes of the
project.
• Grants: Non-commercial projects will in general be funded through grants (including feasibility studies – projects that will
help define and scope future, larger projects),
• Debt: Debt is the preferred method of funding quasi-commercial and commercial projects. Loans will be made available
to projects on suitable and agreed terms,
• Underwrite: Underwriting the risk of a project - likely to take the form of guaranteeing a certain outcome for a project,
lowering the risk for other potential investors. For example, if a project estimates a certain volume of visitors to generate
a certain level of revenue for a project, the PGF may decide to underwrite that revenue risk to guarantee a certain revenue
stream,
• Equity: In some circumstances, the PGF may take an equity position (part-ownership) in a project. Usually, this will be
where the project cannot support further debt, or where there is sufficient extra return from the project which the
Government should benefit from,
• Attracting third party investors: The PGF may be able to help match the project with potential investors.
RELEVANCE TO TE AROHA
On the 4th October 2018, Prime Minister Ardern announced that Matamata-Piako District Council had been awarded a PGF
grant to study the potential for investment in tourism related redevelopment of the Te Aroha Domain and Spa Precinct. Up to
$810,000 was granted by the PGF, with $90,000 contributed by Council.
Visitor Solutions and partners were selected to develop the feasibility study and business investment case for a Te Aroha
Health and Wellness Tourism hub. The aim of the feasibility study is to have industry experts assess options for a tourism hub
concept that will support local and regional economic development by creating sustainable jobs and increasing the number
of businesses in the hospitality and tourism sectors.
The Feasibility Study has been completed, with the Business Case now outlining options for spa development and modelling
the financial and commercial viability of the project.
TE AROHA SPA DEVELOPMENT | BUSINESS CASE 20This project should help achieve the PGF's objectives by:
• Creating jobs, leading to sustainable economic growth,
• Increasing social inclusion and participation,
• Enabling Māori to realise aspirations in all aspects of the economy,
• Encouraging environmental sustainability and helping New Zealand meet climate change commitments alongside
productive use of land, water and other resources,
• Improving resilience, particularly of critical infrastructure, and by diversifying our economy.
2.4 THE NEED FOR INVESTMENT
There is a strong need for investment into the Te Aroha spa facilities. The existing spa facilities are very constrained and have
limited expansion potential. The existing spa is also very tired after approximately thirty years of use. It is turning away
hundreds of thousands of dollars in revenue currently due to a lack of capacity (even with a sub-optimal product). This is
occurring against a backdrop where the importance of having quality spa facilities is becoming more understood in the New
Zealand market. Having higher quality standards and greater capacity is essential in order to tap into the burgeoning domestic
and international growth in spa tourism.
EXISTING SPATIAL CONSTRAINTS AND LIMITED EXPANSION POTENTIAL
The existing Te Aroha Spa buildings were constructed around 1990. The existing size and layout of the building is now
considered inadequate to satisfy the current and anticipated increase in demand for a high-quality international level of spa
experience (see below).
Te Aroha Spa management identified significant constraints with the current facility including a lack of space for pre and post
treatment, a lack of treatment rooms, insufficient pools, a lack of functionality (poor linkages between, pre-treatment, pools,
treatment rooms and post treatment spaces). These assertions were supported by Visitor Solutions functional review of the
facility (Plates 2.1 and 2.2).
Addressing the existing spa’s identified limitations requires additional floor space. Market and financial analysis, geothermal
considerations (primarily around water volumes) and functionality improvements (guided by a specialist spa consultant)
dictated a required building of approximately double the size of the existing spa.
Ngati Rahiri Tumutumu have made it clear that the existing Spa is not in an appropriate location for a range of cultural and
landscape reasons and they would not support the expansion of the facility on its existing site. The consultant team agree with
this assertion on cultural grounds and for heritage and landscape reasons. Any extension to the footprint on the existing site
would result in a very dominant structure requiring expansive and invasive modification of the area in front of the main
geothermal spring (spa water source).
The consultant teams view is that any further expansion of the existing spa building would only further block sightlines and
demean the significance of what is essentially a main entry up into the mountains behind. Developing a new spa on an
alternative site presents both the opportunity to establish an optimal facility (in terms of size and layout) and also to create
an appropriate and respectful new “gateway” design (which would not involve a building on the existing spa site).
Plate 2.1: Single post treatment space Plate 2.2: Single Treatment Space
TE AROHA SPA DEVELOPMENT | BUSINESS CASE 21You can also read