Circular Business Opportunities in Poland - Commissioned by the Netherlands Enterprise Agency - RVO
←
→
Page content transcription
If your browser does not render page correctly, please read the page content below
Circular Business Opportunities in Poland

Commissioned by the Netherlands Enterprise Agency
Circular business
  opportunities
    in Poland
Prospects for Dutch entrepreneurs
                    2021

                    Authors:
  Hubert Bukowski / dr Anna Sapota / Jan Szydło

                                      Commissioned by:
2

Executive summary

Polish favourable economic conditions

Exporters and entrepreneurs, Dutch as well, are drawn to Poland due to the country’s large domestic
market, well-educated and competitive workforce, strong prospects for economic growth and location
in the centre of Europe.

Push towards sustainability-oriented businesses

Current consumer behaviour, material supply issues and regulatory changes necessitate new invest-
ments to consider environmental and social factors. The basic concept for implementing such consid-
erations and not losing profitability in the process is to adopt the circular economy model. The model’s
primary goal is value retention in result of closing economic loops.

Lagging circular economy adoption in Poland

In the last decade, improvements in the efficiency of material use fuelled approximately half of the eco-
nomic growth in Poland, the other half stemmed from growing material consumption, while EU’s eco-
nomic growth was not based on material consumption increase at all. Additionally certain indicators,
such as the percentage of circular materials use rate, indicate the gap between the European leaders
has widened considerably in the last decade.
2.5                                                                                                         15

2.0

                                                                                                            10
1.5

10.
                                                                                                            5

0.5

 0                                                                                                          0

        2010     2011      2012       2013        2014       2015        2016     2017        2018   2019

                           POLAND - Circular material use rate (%, right hand side)

                           EU - Circular material use rate (%, right hand side)

                           POLAND - Resource productivity in EUR (2010 chain linked) per kg

                           EU - Resource productivity in EUR (2010 chain linked) per kg
3

Momentum for circular transition in Poland is already visible

The bleak picture, painted by macroeconomic circularity indicators does not tell the whole story. There
are more and more circular initiatives, ranging from grass-root projects to governmental actions. Com-
mercial companies, both small and medium ones, as well as global corporations operating on the Pol-
ish market are eager to implement circular economic models in their products and services.

Covid-19 pandemic has highlighted the feasibility of circular
economy also in Poland

During the pandemic, people in Poland and around the world started limiting their consumption, de-
creasing transportation, adjusting their dietary habits, etc. These actions provide evidence on our previ-
ous excessive usage of earth’s valuable resources and the overcapacity of our assets. Circular economy
could help to keep the decreased pressure on our planet’s resources beyond time of the pandemic.
Closing the loops, especially on the local level, should provide the supply chains with appropriate flex-
ibility and self-sufficiency on the regional scale, also preparing our economy for future crises, which
makes the benefits of circularity even more compelling.

A number of drivers support the process of circular transition in
Poland

Existing and prospective regulations, especially on the EU level, push the implementation of the cir-
cular economic model. Consumer demand is gradually shifting towards more sustainable products
and services. There is a growing number of initiatives that aim to educate, train, inform and transfer
knowledge on the circular economic model. Resource use reduction was and still is, one of the main
objectives of Polish businesses. Grants, subsidies, loans and other public financial incentives for circular
business activities are available on the EU and national level. These concern EU funds in particular, as
Poland will be one of the largest beneficiaries of the EU 2021-2027 financial framework as well as the
EU’s Reconstruction Fund.

                                    Recovery and Resilience Facility

                          EUR 23.1                               EUR 34.2
                           billion                                billion

                          subsidies                                 loans
4

Polish legal framework for circularity is insufficient

There is relatively little interest of Polish regulators to implement schemes and programmes, beyond
those proposed on the EU level. The general, cross-sectoral strategies and specific targets and goals are
still lacking. There are few examples of such actions, with the most notable one being Roadmap for the
transformation towards a circular economy. The roadmap prioritizes innovativeness and cooperation
between industry and academia, providing high-quality secondary raw materials as a result of sustaina-
ble production and consumption, as well as facilitating those markets and the service sector. In order to
implement the above-mentioned priorities, the roadmap distinguishes measures in the following areas:

                                                New
                                              business
                                               models

                     Sustainable
                                                                      Sustainable
                      industrial
                                                                     consumption
                     production

                                               Sector
                                                 of
                                               focus

                                            BIOECONOMY

Relative differences of Polish and Dutch economies could be har-
nessed to attain a competitive advantage for circular endeavours

The Dutch economy is more service-oriented, while the Polish one is still dependant on its historical
heritage, with a decisively higher importance of industry, agriculture and manufacturing, especially in
terms of employment. These relative differences can be put to use, by facilitating trade and fuelling
cooperation between the two economies. The circular model implementation could further enhance
cooperation and result in finding synergies between the two economies and by complementing each
other. Especially, that Dutch economic activities as well as developed technologies match the Polish
resources supply in the sectors prioritized by the Dutch government.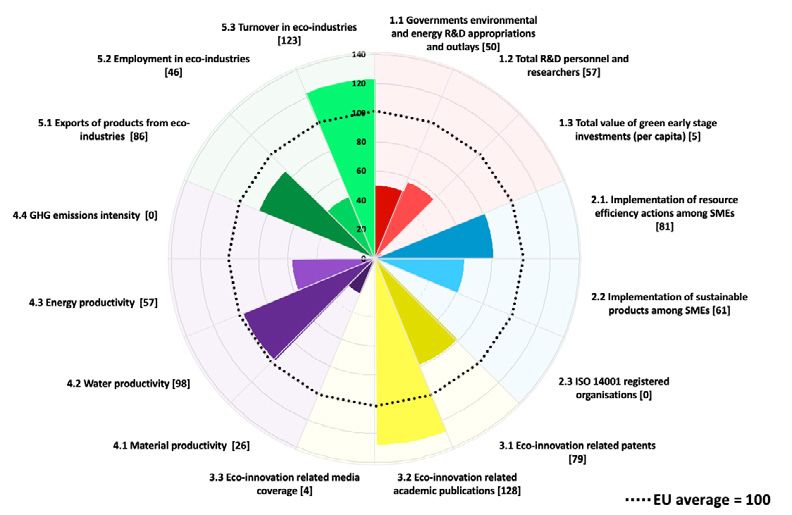
5

   100%
                                                                     Arts, entertainment and recreation; other
                                                                     service activities; activities of household and
    90%                                                              extra-territorial organizations and bodies

                                                                     Public administration, defence, education,
    80%                                                              human health and social work activities

                                                                     Professional, scientific and technical activities;
    70%                                                              administrative and support service activities

    60%                                                              Real estate activities

                                                                     Financial and insurance activities
    50%
                                                                     Information and communication
    40%
                                                                     Wholesale and retail trade, transport, accom-
                                                                     modation and food service activities
    30%
                                                                     Construction

    20%
                                                                     Manufacturing

    10%                                                              Industry (except construction)

                                                                     Agriculture, forestry and fishing
      0
            % of       % of          % of        % of
           Dutch      Dutch         Polish      Polish
            GDP     employment       GDP      employment

Availability of production factors ensures relatively simple repli-
cability of Dutch circular business models

Dutch companies may use their expertise and experience to easily replicate business models and tech-
nology implementation in Polish conditions. The easily available production factors may facilitate this
process. To some degree, those businesses could cater to the expectations of environmentally-aware
Poles and businesses that are eager to decrease their resource use. They could also make use of Po-
land’s favourable location for export activities. As a first-mover, such companies could gain competitive
advantage, as companies already present on the market have not yet realized the possible economic
benefits of either implementing the circular economy model or cooperating with academia. They
could also be on an advantageous position in applying for a sizeable chunk of the EU 2021-2027 funds.

Bioeconomy, energy sector and built environment are areas with
the most potential for circular business development in Poland

Bioeconomy

   Poland – Europe’s future food production and processing hub

   Poland has the fourth-largest area of arable land in the European Union. Furthermore, a sizeable
   portion of the country is less industrialized, which could be a terrific starting point for production
   of eco-friendly and organic foods, possibly with the aim of exporting it to environmentally-aware
   Western European consumers. The highest potential concern poultry, horticulture and milk pro-
   duction.
6

Number of processors of organic products in chosen countries in 2019 (or latest available data)

25 000

20 000

15 000

10 000

 5 000

     0
                 y

                               s

                                       a

                                                   l

                                                              k

                                                                            s

                                                                                     m

                                                                                             ce

                                                                                                    n

                                                                                                           ce

                                                                                                                 ly
                                                ga
                             nd

                                                                          nd
                                                            ar
                                       hi
                r

                                                                                                    ai

                                                                                                                Ita
             ga

                                                                                   iu

                                                                                            e

                                                                                                           an
                                               rtu

                                                           m
                                     ec

                                                                                                  Sp
                                                                                         re
                        rla

                                                                     rla

                                                                                 lg
            un

                                                                                                         Fr
                                                       en
                                   Cz

                                                                                         G
                                                                                Be
                                            Po
                        he

                                                                     he
           H

                                                       D
                      et

                                                                   et
                     N

                                                                  N

    Sustainable biogas production could follow agricultural development

    With a considerable size of the arable land and feedstock in Poland, coupled with the country being
    a net energy importer, thriving biogas sector based on agricultural waste could be a possible route
    for assuring appropriate energy mix in the country.

    Sustainable soil management, including organic fertilization is needed

    In Poland, there is a considerable unmet need for a more sustainable agricultural production through
    soil management, including organic fertilisation. This process is carried out only by large farms ran
    by well-educated farmers, mostly in the western parts of Poland, while broader application still
    awaits.

    Cooperation and consulting for a more sustainable farming

    Due to a high fragmentation of farms in Poland there is a huge untapped potential for compa-
    nies that seek synergies through cooperation. Poland’s agriculture and food industries are skewed
    toward low value-added produce. To process produce additional infrastructure is needed. Coop-
    eration on improving quality, scaling supply for processing activities is possible thanks to vertical
    integration and clustering.

Energy

    Rapid development of solar energy will continue

    Photovoltaics is one of the fastest growing segments of the renewable energy sector in Poland.
    The capacity of photovoltaic installations increased almost fivefold in just two years. This growth is
    expected to continue in the upcoming years. Dutch companies can enter the market, possibly using
    circular business models, e.g. product as a service.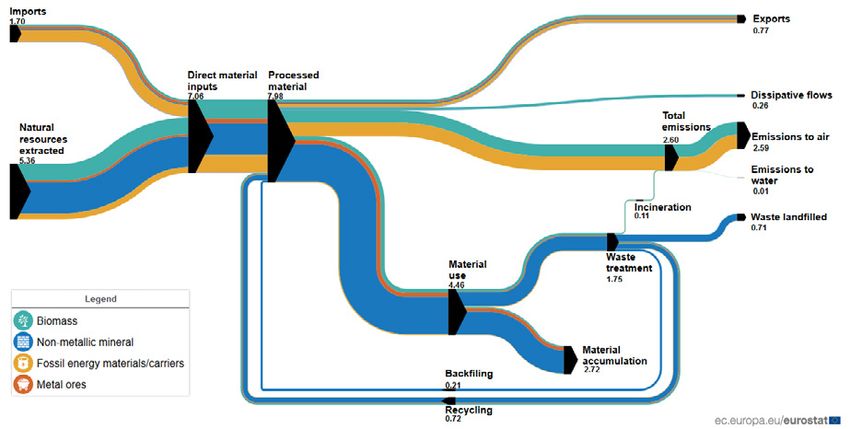
7

  Wind energy is indispensable in Polish energy mix, especially offshore energy

  In 2020 63,7% of all renewable energy in the country was produced using wind. Due to the need to
  improve Polish energy mix offshore wind production is still on the rise as the basic source of renew-
  able energy in the country. Currently onshore wind generation capacity development is somewhat
  restricted, but there are plans to revise parts of the bill that hindered onshore wind energy develop-
  ment.

  Installed renewable energy power in Poland (MW).

   10 000

    8 000

                                                                                                 hydropower

    6 000
                                                                                                 wind

                                                                                                 photovoltaic
    4 000

                                                                                                 biomass

    2 000
                                                                                                 biogas

       0
            2010    2011   2012   2013   2014   2015   2016   2017   2018   2019   2020

  Energy distribution and storage is in need of expansion and renovation

  Investments undertaken by distribution system operators for distribution grid expansion, upgrade,
  automation and cyber-security are substantial. These market areas could be accessed by Dutch
  companies, which are one of the leaders in renewable energy technologies in Europe. Value chain
  benefits are also present.

Built environment

  From a European leader in furniture production to a circular furniture frontrunner

  There is a number of advantages that resulted in Poland becoming one of the world’s biggest
  furniture producers that could also be used for the development of circular furniture production.
  These are: relatively low production costs, including labor costs for highly-skilled employees, strong
  governmental support for the furniture industry and availability of various aid funds, the proximity to
  resources of both solid wood and wood-based materials. One untapped potential business route is
  to enter repair, refurbishment and remanufacture activities in upmarket furnishing. Beyond product
  design and manufacture, circular companies in the furniture sector may also innovate to reclaim the
  economic value of their waste.
8
There is still a lot of untapped revitalizing potential
The high priority of revitalization in the urban policy in Poland is included in a number of official
public documents and is one of the governmental priorities. Such areas are drawing more and
more interest from commercial companies that are willing to profit on their investment and at the
same time build and operate according to circular concepts - using existing resources to the fullest
and increasing social cohesion in the cities. Entrepreneurs may benefit from revitalization of some
areas occupying whole city blocks, often in prime locations. Some of them are heritage properties
of interest to affluent buyers.
Circular innovation in construction is still negligible but imminent in the future
Circular technologies in construction have not been applied or their implementation in Poland has
just begun. The extensive building management system, extensive energy consumption metering,
lighting sensors, the use of high-quality filters in ventilation systems, water-saving flushing systems,
temporary batteries with flow limiters or aerators, leakage detection systems are just a few of the
solutions that could be offered to the Polish consumer.
Primary obstacles that have to be taken into account or mitigated
when establishing circular businesses in Poland:
Regulatory obstacles
• Complexity and instability of legal framework
• Policies based on linear models
• Lack of support for circular business models
Lack of know-how
• Lack of knowledge on circular economy and circular solutions
• Lack of technical skills
Linear approach to day-to-day business
• Limited internal and external cooperation
• Incorrect perception of the circular economy model and its benefits
Focus on short term return and cost reduction
Lack of business environment for circular economy initiatives
• Little support for circular value chains
• Reluctance to share information
Insufficient customers’ awareness
Barriers specific to foreign investors
• Language barrier
• Lack of local network
• Limitations in international transactions or deliveries
• Difference in the acceptable level of price of the final product
• Linear approach to waste9
SWOT analysis on possible Dutch engagement
in Poland in circular businesses
Strengths Weaknesses
• Economic resilience and strong growth perfor- • Consumers typically prioritize short-term costs over
mance. long-term economic and environmental outcomes.
• Well-educated and competitive workforce (especially • Liquidity barriers disable customers from buying
in ITC sector, which can facilitate virtualization and circular or sustainable product and services that offer
circular business models application). better long-term value.
• Substantial industrial capacity and arable land supply. • Lack of trust between the seller and the buyer, as
• Poland is one of the biggest beneficiaries of EU funds well as limited access to quality product information.
including the Reconstruction Fund; a considerable • Still limited market scope consisting of a narrow
portion of those funds is used for circular transition. group of environmentally-aware consumers.
• Incentives in the form of special economic zones • Few green procurement examples; majority of the
and tax deductions, etc. are available. procedures based mainly on price.
• Poland has favourable location that enables an easy • Poorly developed circular business environment and
access to both East- and West-European markets; value chains.
the country is a gateway to other countries in the • Lack of cross-sector cooperation between compa-
region. nies.
• Polish companies are eager to decrease their costs, • Weak industry-science links and insufficient diffusion
this also concerns resource use reduction, which is of knowledge at the national level.
in line with circular economy concept. • Inefficient commercial judiciary and bureaucratic red
• Existing regulations, especially on the EU level, fuel tape.
transition towards circular economy.
• A number of NGO’s and grass-root projects already
started educating, informing and supporting con-
sumers and policy-makers in a circular transition.
Opportunities Threats
• The process of gradually shifting Polish consumer • Ad-hoc legislatory changes and legal instability, con-
demand and society awareness towards more sus- cerning waste in particular.
tainable products and services has already started; • Differences in working environment between Poland
first movers may gain advantage. and the Netherlands may cause complications in
• Growing regulatory requirements e.g. rising waste day-to-day operations.
handling fees, may push both companies and con- • Circular economy could be understood as a PR or
sumers to turn to circular solutions. CSR stunt not as a genuinely profitable endeavour,
• Competition has not yet realized the possible bene- which may limit the development of circular busi-
fits of implementing innovative circular solutions. ness environment
• Small and medium enterprises are reluctant to inno- • Government’s reluctance to reform some sectors
vate, thus a number of niches is still available. (energy and farming in particular) may limit circular
• Already developed circular technologies can be eas- model application in those areas
ily implemented by replicating existing ones as there • Government’s political stance may be a source for
is little competition and circular businesses are only concern for financing possibilities, especially from EU
beginning to gain momentum. funds.
• Connections between business and academia may
offer a competitive advantage, as such cooperation
is still negligible.
• Untapped potential for organisational changes
towards circularity (industrial symbiosis, sharing
economy, etc.).CONTENT
11

Executive summary                                                              2
1. Overview of circular economy in Poland                                      12
  1.1 State of play                                                            13
  1.2 Regulatory landscape                                                     17
  1.3 Fundamental drivers of circular economy in Poland                        21
  1.4 Fundamental barriers to circular economy in Poland                       21
2. Links between the Netherlands and Poland in regards to circular
opportunities                                                                  23
  2.1 Overview of trade connections between the Netherlands and Poland         24
  2.2 Overview of investment inflows from the Netherlands into Poland          26
  2.3 Identification of biggest businesses in Poland related to circular
  economy concept                                                              28
  2.4 Identifying Polish businesses with circularity as their core competence 29
  2.5 Analysing Dutch circular businesses and their overall business
  potential in Polish market conditions - demand and supply analysis           30
3. Identifying most promising sectors for circularity development in Poland 36
  3.1 Prioritization criteria                                                  37
  3.2 Promising sectors identified and Dutch stance on chosen sectors          40
4. Circular opportunities in the bioeconomy area and market entry factors      42
  4.1 Circular business opportunities                                          43
  4.2 Barriers to entry                                                        48
  4.3 Market competition                                                       49
  4.4 Financing options                                                        50
5. Circular opportunities in the energy sector and market entry factors        51
  5.1 Circular opportunities                                                   52
  5.2 Barriers to entry                                                        55
  5.3 Market competition                                                       56
  5.4 Financing options                                                        56
6. Circular opportunities in the built environment and market entry factors    57
  6.1 Circular business opportunities                                          58
  6.2 Barriers to entry                                                        62
  6.3 Market competition                                                       62
  6.4 Financing options                                                        63
7. Barriers to successful circular businesses in Poland with suggestions for
tackling them                                                                  64
  7.1 Regulatory obstacles                                                     65
  7.2 Lack of know-how                                                         66
  7.3 Linear approach to day-to-day business                                   67
  7.4 Focus on short term return and cost reduction                            68
  7.5 Lack of business environment for circular economy initiatives            69
  7.6 Insufficient customers’ awareness                                        70
  7.7 Barriers specific to foreign investors                                   71
Useful definitions                                                             74
Bibliography                                                                   76
12

        chapter 1

     Overview of circular
      economy in Poland
13
1.1 State of play
Poland is an important and dynamic market located in the heart of Central Europe. Exporters and in-
vestors, Dutch as well, are drawn to Poland due to the country’s large population, well-educated and
competitive workforce, strong prospects for economic growth and location in the centre of Europe.
However circular economy model adoption has been lagging, despite growing awareness among
Polish society.
Since the beginning of the XXI century, we have been observing a constant improvement in the produc-
tivity of raw materials in Poland. In the 2005-2019 period it has increased by 36,6% in real terms. Howev-
er, it should be noted that Poland is not shortening the distance to the average for the entire European
Union, whose material productivity in the same period rose by a comparable 35,5%. Furthermore the
distance to EU countries with fastest productivity growth has widened considerably1. In 2019 the level of
material productivity seen in the Netherlands - the EU leader was six times higher than in Poland.
Figure 1 Resource productivity and domestic material consumption (in EUR in real terms per kg of
material)
5
Poland
4
Netherlands
3
Ireland
2
Spain
1 EU average
0
2005 2006 2007 2008 2009 2010 2011 2012 2013 2014 2015 2016 2017 2018 2019
Source: Eurostat.
This picture should be assessed in even darker colours, considering that in the 2005-2019 period Po-
land’s GDP, according to Eurostat, grew in real terms by 74.0%, while for the entire European Union
this indicator amounted to only 19,9%. This means that the economic growth in Poland was to a large
extent the result of an increase in the consumption of production factors - in this case materials. Im-
provement in the efficiency of material use, that can be seen as a gauge for circular model adoption,
was responsible for less than half of the economic growth in the analysed period, while in the whole
EU it was the sole contributor to the rise in GDP.
The implementation of circular concepts should result in minimizing the use of raw materials while
achieving the highest possible returns on the material used - unfortunately this was not the case in
Poland in the last 15 years. Certain indicators, such as the percentage of re-used materials, which until
recently were above the EU average, have now deteriorated, while the gap between the leader in clos-
ing material loops - the Netherlands, has widened considerably.
1. In the 2005-2019 period material productivity in Ireland has grown by 146,1%, while in Spain this indicator reached 143,2%.14
Figure 2 Circular material use rate (%)
30
25
20
Poland
15
Netherlands
10
EU average
5
0
2010 2011 2012 2013 2014 2015 2016 2017 2018 2019
Source: Eurostat.
Material flow analysis corroborates the findings based on the aforementioned indicators. The Polish
economy uses considerably more material resources than the EU average. In 2018 direct material
inputs were equal to 22.3 tonnes per capita, compared to 15.9 tonnes in the whole EU. This means
that the Polish economy uses approximately 40% more resources per capita in terms of mass. The
difference is partially a consequence of higher usage of fossil energy material/carriers, though it is not
limited to this factor. Consequently, total emissions to air and exports of processed materials per capita
are higher than the EU average in absolute terms.
However, what is somewhat puzzling is the disproportionally high mass of materials accumulated in
the economy. It may be a result of relatively low level of Poland’s development, which in consequence
requires higher accumulation of durable goods (mainly building and constructions), instead of their
replacement. According to this interpretation a lower proportion of waste would be landfilled, which is
indeed the case. Additionally, one would expect a lower proportion of recycled or backfilled materials
than the EU average. It seems however that Poland recycles materials or uses them as backfilling to
a greater extent, compared to other EU members (it concerns mostly construction materials, though
according to some sources this data is questionable2).
2. Bukowski, Fabrycka (2019): Circular construction in practice.15
Figure 3 Material flows in Poland in 2018 (tonnes per capita)
Source: Eurostat
Unfortunately, eco-innovation is also lagging behind compared to other European countries. In the Euro-
pean Eco-innovation Scoreboard 2019 edition, Poland ranked 24th among the EU countries, significantly
below the EU average. The overall low score reflects the low innovativeness of the country in general.
Figure 4 European eco-innovation index for 2019
Luxembourg
Denmark
Finland
Sweden
Austria
Germany
Italy
Netherlands
France
Spain
Portugal
EU average
Ireland
Czechia
Slovenia
Latvia
Belgium
Lithuania
Greece
Malta
Estonia
Croatia
Slovakia
Poland
Romania
Cyprus
Hungary
Bulgaria
0 40 80 120 160 200
Source: European Commission (2020): Eco-innovation in Poland.16 The low eco-innovation score is particularly a result of low investments and R&D outlays. A situation that foreign entrepreneurs could take advantage of. Figure 5 All indicators of the Eco-innovation index for Poland, 2019 Source: European Commission (2020): Eco-innovation in Poland. The bleak picture, painted by circularity indicators does not tell the whole story. There are more and more circular initiatives, ranging from grass-root projects to governmental actions. Commercial com- panies, both small and medium ones, as well as global corporations operating on the Polish market are eager to implement circular economic models in their products and services3. Though the scale of those endeavours is still to minuscule to affect the cited circularity indicators, there is a visible momen- tum to make a transition towards circularity. Current Covid-19 pandemic, although an unfavourable event itself, could be used to further support the switch from a linear to circular economic model in Poland and in the whole world4. This is mostly visible from the macroeconomic perspective, as during the pandemic, people around the world started limiting their consumption, decreasing transportation, adjusting their dietary habits, etc. All of these actions provide evidence on our previous excessive usage of planet earth’s valuable resources5. It is only now that the broad society in Poland has seen the staggering overcapacity of our assets and its overconsumption. This concerns office space and cars in particular. New, circular business models as well as modularity and standardization could help keep the decreased pressure on our plant’s resources beyond the time of the pandemic. 3. Showcased inter alia by the members of Polish Circular Hotspot. 4. https://www.weforum.org/agenda/2020/06/opportunities-circular-economy-post-covid-19/ 5. Material Economics (2020): the Circular Economy and Covid-19 Recovery. How pursuing a circular future for Europe fits with recovery from the economic crisis.
17

The pandemic is also an important opportunity for increasing the resiliance of the Polish and the
world’s economy. Global economy’s supply chains have proved to be unexpectedly fragile, as show-
cased by medical equipment, consumer electronic and lithium batteries markets in the beginning of
the pandemic. Closing the loops, especially on the local level, should provide supply chains with appro-
priate flexibility and self-sufficiency on the regional scale, which makes the benefits of circularity even
more compelling6. Designing out waste and pollution, keeping products and materials in use to the
greatest possible extent and regenerating natural systems could prepare our economy for future crises7.

1.2 Regulatory landscape

Polish regulations related to the implementation of the circular economy are a direct result of legisla-
tion at the EU level. Legal acts supporting the implementation of this concept have been translated into
Polish legislation and constitute the basis for the activities of the Polish government aimed at transition-
ing from a linear economic model towards a circular one.

For the current term the European Commission has set itself the goal of continuing the direction of
implementing the circular economic model8. The introduced changes will soon also apply in Poland.
The creation of an appropriate legal framework is expected to make sustainable products, services and
business models a core activity, primarily with the aim of preventing waste. The development of the
secondary raw materials market, a more complete application of the principles of eco-design in as
many products as possible and further expansion of producer responsibility are also prioritized.

There is relatively little interest among Polish regulators to implement additional strategies and pro-
grammes on the national level, beyond those proposed on the EU level. The general, cross-sectoral and
specific targets and goals are still lacking, while they are quite essential to the advancement of circular
economy. There are however some examples of such actions. Among those, the most notable one is
the Roadmap for the transformation towards a circular economy9. It sets the directions for the trans-
formation of the Polish economic model from a linear to a circular one. The key priorities for building
circular economy in Poland highlighted in the document are:

             Innovativeness,
                                                                                       Creation of a European
 strengthening cooperation
                                                                                       market for secondary
  between industry and the
                                                                                       raw materials in which
 science sector - as a result,
                                                                                       their movement would
   implementing innovative
                                                                                       be facilitated.
  solutions in the economy.

                                                                                       Providing high-quality
                                                                                       secondary raw materials,
           Development of the
                                                                                       as a result of sustainable
                service sector.
                                                                                       production and
                                                                                       consumption.

6. Doussoulin (2020): COVID-19: Turning a Threat into an Opportunity for the Circular Economy.
7. http://www.fao.org/land-water/overview/covid19/circular/en/
8. European Commission (2020): Circular Economy Action Plan.
9. Kancelaria Prezesa Rady Ministrów (2019): Mapa drogowa transformacji w kierunku gospodarki o obiegu zamkniętym.
18
In order to implement the above-mentioned priorities,
the roadmap distinguishes measures in the following areas:
The roadmap raises the issue of cooperation, not only between consumers and producers, but also among
producers and between entrepreneurs, scientists and the public sector. This cooperation was identified as
a key element of circular business models. As a consequence of this cooperation, resource productivity
increases significantly. Attention is paid to social economy entities as a source of new solutions in the area
of business models. These entities provide services tailored to the needs of the community, raise its
awareness and reduce social exclusion.
New
business
models
Sustainable
Sustainable
industrial
consumption
production
Sector
of
focus
• waste from mining, • municipal waste,
• manufacturing and energy • food waste,
production, • education.
• extended producer respon-
sibility, Activities in this area included,
• life cycle assessment. above all, those increasing con-
sumer awareness and reducing
Attention is paid to the potential BIOECONOMY information asymmetries be-
of reducing waste generation in tween market actors (ensuring
production activities and their the availability of information
optimal management in other on repair and spare parts, bet-
production processes in order • conditions for bioeconomy ter enforcement of guarantees,
to increase its profitability and development, elimination of false claims re-
reduce its negative impact on • local value chains, garding environmental impact,
the environment. • industrial use, or determination of maximum
• use as an energy source shelf life without harming the
consumer or the environment).
The development of bioecono- High emphasis is placed on ed-
my should result in limiting the ucation in the field of sustaina-
negative impact of economic ble consumption carried out at
activity (conducted in accord- all stages of education, as well
ance with the current linear as the proper management of
model) on the natural environ- municipal waste.
ment. It also contributes to the
creation of new jobs, in particu-
lar in rural areas.
Unfortunately, among specific activities enumerated in the roadmap there are few significant ones.
Most of the activities take the form of analyses and concept development (78,6% of total number of ac-
tivities). They may be the basis for further development of legislatory acts facilitating circular economy
implementation, nevertheless they provide little direct support for the concept’s implementation. The
same conclusion applies to the remaining activities, which have mostly educational purposes.19
Figure 6 Types of activities included in the Roadmap for the transformation towards a circular economy
2 Analyses
7
Concept development
17
Education
16
Forming expert panels
Source: Own elaboration based on Kancelaria Prezesa Rady Ministrów (2019): Mapa drogowa transformacji w kierunku gospo-
darki o obiegu zamkniętym.
Other type of Government’s strategy regarding transitioning towards circular economic model is en-
capsulated in the 2030 National Environmental Policy10. The role of the policy is to ensure Poland’s eco-
logical safety and high quality of people’s lives. It will also become one of the bases for European funds
absorption during the 2021-2027 EU financial framework. National Environmental Policy also supports
the implementation of Poland’s objectives and commitments at the international level, including those
of the EU and the UN, especially in the context of the EU’s climate and energy policy objectives for
2030 and the sustainable development goals (SDGs) included in Agenda 2030. The specific directions
of intervention included in the policy are:
sustainable water management,
elimination of air pollutant emission
including ensuring access to clean
sources or significant reduction of
water for society and economy, and
their impact,
achieving good water status,
counteracting environmental thre-
protection of the earth’s surface,
ats and ensuring biological, nuclear
including soils,
and radiological protection,
management of natural and cultural
heritage resources, including pro- supporting multifunctional and su-
tection and improvement of biologi- stainable forest management,
cal diversity and landscape,
management of geological resour-
waste management towards
ces by developing and implemen-
a circular economy,
ting the state resource policy,
supporting the implementation of
eco-innovation and disseminating
counteracting climate change,
the best available techniques BAT
(best available techniques),
adaptation to climate change and environmental education, including
managing the risk of natural disa- shaping sustainable consumption
sters, patterns,
improvement of the environmental protection
control and management system and impro-
vement of the financing system.
10. Kancelaria Prezesa Rady Ministrów (2019): Polityka Ekologiczna Państwa 203020
The transition towards circular economy offers an all-encompassing approach to achieving the goals
stated in the 2030 National Environmental Policy, as all of the aforementioned directions of interven-
tion described in the policy are connected to the notion of circular economy. However only the goal
of waste management improvement mentions the concept directly. Apart from this single exception,
directions of intervention do not state the means or ways to attain the desired objective, while it is the
circular economic model that offers the possibility of achieving them.
There is a number of other policy measures adopted recently that somewhat relate to the concept of
circular economy. They include e.g. regulations and programmes to support the development of elec-
tromobility in Poland11, as well as an act aimed at limiting food waste12.
The Polish government is in the process of consulting the National Reconstruction Plan (Krajowy Plan
Odbudowy i Zwiększania Odporności13) that will be the basis for acquiring financing from the European
Union’s Reconstruction Fund and its largest part - the Recovery and Resilience Facility. The fund is the
European response to new threats and challenges caused by the pandemic, with the goals of restoring
its economy and building resilience to possible future crises. As part of the Recovery and Resilience
Facility, Poland will receive ca. EUR 23.1 billion in the form of subsidies and EUR 34.2 billion in loans to be
used by 2026. Although the National Reconstruction Plan is still consulted, the government has already
stated financial support and proposed the division of subsidies for businesses, innovation, infrastructure,
healthcare, green energy, digitization and measures to protect climate and ensure clean air. This also
means financing of investments connected with circular economy, though specific focus on this topic
is still to be confirmed.
Figure 7 Division of available subsidies according to National Reconstruction Plan draft.
17.3%
25.5%
economic resilience and
competitiveness
green energy and reduction of
energy consumption
digital transformation
availability and quality of health care
26.6%
17.9%
green and intelligent mobility
12.7%
Źródła: KPRM (2021): Krajowy Plan Odbudowy i Zwiększania Odporności, February 2021 draft.
11. Electromobility and alternative fuels bill of 11 January 2018 (Dz. U. 2018 poz. 317).
12. Counteracting food waste bill of 19 February 2019 (Dz.U. 2019 poz. 1680).
13. KPRM (2021): Krajowy Plan Odbudowy i Zwiększania Odporności, February 2021 draft.21
1.3 Fundamental drivers of circular economy in Poland
Regulatory push Circular activities Companies prioritize Financial incentives
towards circularity gain momentum cost reduction - re- support circularity
Existing and prospecti- Consumer demand is source use as well Grants, subsidies, loans
ve regulations, espe- gradually shifting to- Cost reduction was and other public finan-
cially on the EU level, wards more sustaina- and still is, one of the cial incentives for circu-
fuel transition towards ble products. There is main objectives of lar business activities are
the circular economy. a growing number of Polish businesses. This available on the EU and
initiatives that aim to also concerns cost of national level. These
educate, train, inform water, materials and concern EU funds in
and transfer know- energy (also emission particular, as Poland
ledge on the circular trade scheme costs), is one of the biggest
economic model. which is in line with beneficiaries of the EU
resource use reduc- 2021-2027 financial fra-
tion as a result of the mework, but also con-
implementation of cern special economic
the concept of circular zones, tax exemptions
economy. for certain investments,
tax relief on innovation
and property rights
incomes.
1.4 Fundamental barriers to circular economy in Poland
• Prioritizing short-term price
Consumers and companies (also public ones14) are still primarily prioritizing short-term
costs over long-term economic and environmental outcomes. In effect the limited demand
restricts attaining economies of scale for circular products, which results in a vicious cycle
of high prices and low scale production.
• Insufficient business environment development
Lack of appropriate business environment in the form of subcontractors, circular materi-
als provision, waste collection systems, etc. Increasing innovation and competitiveness in
sectors typically focused on price minimization requires intensive cross-sector cooperation
between companies and appropriate diffusion of knowledge at the national level, which is
still lacking.
• Underestimated role of information
Limited access to reliable information, interest in such data and lack of trust between the
seller and the buyer. Information about the origin and entire life cycle of a product is hard
to acquire, thus it does not influence consumption choices to the extent it should.
14. Public procurement law and practices in Poland do not prioritise circularity oriented selection criteria. For example in 2017
only 0,01% (17) of total public procurements used lifecycle assessment (LCA) in the procedures.22
• Insufficient research and development efforts
Weak industry-science links as well as insufficient research effort limits international com-
petitiveness. While large companies are more likely to innovate, small and medium en-
terprises are reluctant to do so. There is insufficient awareness about possible benefits of
implementing innovative circular solutions and weak knowledge about tools supporting
circular assessment in value chain i.e. EPD, carbon footprint, environmental footprint, ETV,
etc.
• Legal instability
In order to thrive, it is necessary to ensure adequate legal stability for circular technologies
and businesses. This applies to the entire system and the predictability of the directions of
its changes, as well as the modification of detailed regulations. In this context, specifically
both reporting and technical requirements on waste change exceptionally frequently.23
chapter 2
Links between
the Netherlands and
Poland in regards to
circular opportunities24
2.1 Overview of trade connections between the Netherlands and Poland
In the last decade Polish burgeoning economy has seen a steady rise in the value of goods and services
imported. This growth has come, inter alia, from the Netherlands. During the 2010-2019 period imports
from the Netherlands to Poland have seen an almost twofold increase. The country has become the
fifth biggest source of imports of goods and services to the Polish economy, while ten years earlier it
took the 7th place. It seems that the Dutch-Polish trade relations are strengthening year by year. Judg-
ing by the dynamics in the 2010-2019 period in five years imports from the Netherlands could overtake
those from Russia.
Figure 8 Imports of goods and services to Poland from top ten countries (in bln EUR)
70
Germany
60 China
Russia
50
Italy
40 Netherlands
France
30
Czechia
20
USA
10 Belgium
Spain
0
2010 2011 2012 2013 2014 2015 2016 2017 2018 2019
Source: Polish Statistical Office.
According to CBS (Centraal Bureau voor de Statistiek, eng. Statistics Netherlands) the value of Dutch
exports to the country, as of 2019 place Poland as its eight most important export market. Furthermore
the growth observed in the 2012-2019 period (58,2%) was significantly higher than the average for top
fifteen countries (15,1%), and was second only to China (67,3%) among this group of countries.
By far, the most significant category of exports to Poland is machinery and transport equipment, which
constituted 40% of total exports. Chemical and related products came second with 17,6%, followed by
food and live animals (13,5%), miscellaneous manufactured articles (12,3%) and manufactured goods
(9,5%).25
Figure 9 Composition of types of goods exported from the Netherlands to Poland in 2019
food and live animals
0.1%
12.3% 13.5%
beverages and tobacco
0.5% crude materials
4.7%
0.8% mineral fuels, lubricants and related goods
0.9%
animal and vegetable oils, fats and related goods
chemicals and related products
17.6% manufactured goods
40.0%
machinery and transport equipment
miscellaneous manufactured articles
9.5%
commodities and transactions
Source: Centraal Bureau voor de Statistiek
Imports from Poland to the Netherlands have also seen a considerable growth the numbers in 2012-
2019 period. In fact, imports grew faster than exports, 66,2% compared to 58,2% respectively. Among
top fifteen trade partners only Ireland has seen higher dynamics. This resulted in Poland ranking 11th
(an improvement by two positions compared to 2012) on the list of Dutch most important import
partners.
The types of goods imported to the Netherlands from Poland somewhat resembles those exported.
Machinery and transport equipment is the most important import category, while food and live animals
category takes third place with 14% of total imports. However, manufactured goods and articles im-
ports are proportionally more significant than their exports (31,7% of total imports, compared to 21,8%
of exports). The same applies to mineral fuels and lubricants. On the other hand, chemicals and related
products, an important export category, is less significant in the imports composition.
Figure 10 Composition of types of goods imported to the Netherlands from Poland in 2019
food and live animals
0.1%
14.0%
18.0% beverages and tobacco
crude materials
3.4%
2.0% mineral fuels, lubricants and related goods
animal and vegetable oils, fats and related goods
8.4%
chemicals and related products
0.3%
manufactured goods
7.0%
machinery and transport equipment
33.3%
miscellaneous manufactured articles
13.7%
commodities and transactions
Source: Centraal Bureau voor de Statistiek26
2.2 Overview of investment inflows from the Netherlands into Poland
Since the economic transformation, after the collapse of the communist regime, there has been a
stable interest of foreign entrepreneurs to engage in activities on the Polish market. Historically, the
most popular sectors for foreign investors included automotive, information technology, food prod-
ucts, logistics, pharmaceuticals, paper production, appliances and financial services15. Poland is also a
popular location for business processing centres, including call centres, shared services centres and
research and development operations. Dutch companies have been present in these areas as well as
the Netherlands which is one of the biggest foreign investors in the world and ranks second in Europe
after Luxembourg16.
In 2018 the Netherlands is by far the biggest foreign investor in Poland17. The inflow of 7 bln EUR (31,6
bln PLN) accounted for approx. 63% of the total value of foreign direct investments in 201818. As of the
end of 2018 liabilities to direct investors from the Netherlands amounted to 40,5 bln EUR (PLN 183.4 bil-
lion), i.e. 21.3% of the total liabilities to direct foreign investors - the highest portion among any country.
Figure 11 Composition of foreign direct investments in Poland broken down by geography as of the
end of 2018
21.3%
37.9% Netherlands
Germany
Luxembourg
France
Other
17.5%
9.1%
14.2%
Source: National Bank of Poland
The statistics of foreign direct investments in Poland according to the country of the seat of the parent
entity in the capital group to which the direct investing belongs (UIC - ultimate investing country) gives
a slightly different picture of the geographical structure of liabilities due to inward direct investments
in Poland. This is an outcome of many foreign companies with a global reach choosing Netherlands
as their ‚European headquarters’. The most important ones include American, British, Belgian, German
and Japanese companies, while their operations mainly concern mining, petrochemical production,
15. Polish Investment & Trade Agency (2019): Investment climate in Poland.
16. Based on OECD data in USD, 2018 or latest available (outward FDI stocks by partner country).
17. Narodowy Bank Polski (2020): Zagraniczne inwestycje bezpośrednie w Polsce i polskie inwestycje bezpośrednie za granicą
w 2018 roku.
18. It has to be noted that in 2018 a one-off transaction has resulted at significantly higher foreign direct inflows from Nether-
lands and, at the same time outflows from Spain.27
food industries, banking and insurance services. This is due to the central location of the Netherlands
in Western Europe, the proximity of the largest economic markets, as well as legal and tax facilities for
foreign investors. Therefore a big chunk of foreign investments from Netherlands have a multinational
origin. Thus, when using ultimate investing country perspective, the value of liabilities to Dutch inves-
tors is significantly reduced and in 2018 amounted to EUR 17,4 billion (PLN 78.7 billion). This places the
Netherlands fourth on the list of biggest investors in Poland.
Figure 12 Composition of foreign direct investments in Poland according to ultimate investing country
as of the end of 2018
20.1%
Germany
France
10.4%
United States
50.0%
Netherlands
Other
10.3%
9.2%
Source: National Bank of Poland
Among the biggest foreign investors registered in the Netherlands are:
AkzoNobel, paints and chemical products;
BP, petrochemical production;
CBR Baltic B.V. , production of cement and gypsum;
Damen Shipyards Group, shipyard;
DSM B.V., nutrition, health and sustainable living;
Harbin B.V., breweries;
Heineken International B.V., breweries;
ING group, banking, finance, real estate;
Philip Morris Holland B.V., tobacco products;
Procter & Gamble, consumer goods;
Randstad, human resource consulting;
Royal Philips Electronics N.V., lighting equipment;
Shell, petrochemical production,
Unilever, consumer goods.28
2.3 Identification of biggest businesses in Poland related to circular
economy concept
There is a number of classifications of circular businesses. The most rudimentary approach comes
from Eurostat. The statistical office of European Union defines sectors which are related to circular
economy according to NACE rev.2 classification19. The sectors concern only two areas: recycling as
well as repair and reuse. This narrows down the circularity scope for companies and could only be
assessed as a proxy for circular businesses. Nevertheless it gives a simplistic method for identifying
circular businesses in Poland.
In the last decade the aforementioned areas of business activities in Poland have been relatively stable,
when economic value added is concerned, while the employment has risen only slightly. The two indi-
cators’ levels have been relatively higher than in the European Union and the Netherlands. This howev-
er does not imply that Poland is more advanced in circular model implementation. It is more likely that
the overall lower development of the Polish economy results in higher numbers for those indicators.
This is corroborated by a decrease in value added by those two areas of activity in the Netherlands,
despite the observed growth of other circularity indicators (see chapter 1.1).
Figure 13 Employment (in % of total employment) and gross value added (in % of GDP) related to cir-
cular economy sectors.
2.5
EU - % of GDP
2
Netherlands - % of GDP
Poland - % of GDP
1.5
EU - % of total employment
1
Netherlands - % of total employment
Poland - % of total employment
0.5
0
2011 2012 2013 2014 2015 2016 2017
Source: Eurostat.
In the recycling area in Poland, the most important businesses are those connected to managing
metals and scrap waste. An overwhelming number of companies dealing with aluminium, iron or
steel products use recycled materials20. Among notable examples of aluminium packaging businesses
19. Vide: https://ec.europa.eu/eurostat/documents/8105938/8465062/cei_cie010_esmsip_NACE-codes.pdf (accessed on Janu-
ary 14 2021).
20. According to available data, in Poland approximatelly 2/3 of iron production comes from recycling operations (see: https://
www.stenarecycling.pl/top-menu/aktualnosci/zlom-elazny--jak-wykorzysta-100- potencjau/). The last aluminum smelter
using raw materials has switched to 100% recycling content in 2009 (Hurta Konin). Of course this does not imply that no raw
aluminum is used in Poland as it is imported. Nevertheless aluminum products produced in Poland in a significant proportion
are made from recycled materials.29 are Can-Pack and Ardagh Metal Beverage Trading Poland. There is a number of aluminium using con- struction products companies as well, e.g. Grupa Kęty, Alumetal SA, Aluprof SA. The same concerns the steel industry, which predominantly sources its materials from scrap. The most important players on this market are: Impexmetal, CMC Poland, Celsa Huta Ostrowiec, and many more (16 among top 500 biggest companies in Poland21). Among the biggest companies in Poland operating in recycling there are notable examples of companies operating strictly with circular concept in mind. Elemental Holding S.A. recycles waste electrical and electronic equipment (WEEE) and catalytic converters, and aims to treat waste as a resource. Nicromet is an aluminium recycling company with sustainability as one of their core values. Among the reuse area there is a number of disparate business activities. One of them is providing platforms for reusing products and materials. Allegro and OLX are leaders in this domain on the Polish market. In recent years there has been a growing interest in used clothing. Vive Textiles (established by a Dutch entrepreneur in Poland) is the leading provider of used clothes in Poland. The repair area is notably represented by shipyards dealing with ship renovation. Two biggest of them are Grupa Kapitałowa Remontowa Holding and Gdańska Stocznia Remontowa. Other repair compa- nies take on car maintenance. Among them providers of spare parts are the most important entities. These are e.g. Inter Cars and Moto-Profil. Among other types of companies with circular concepts in mind, one can surely distinguish those operating in modular constructions. Among 500 biggest companies in Poland there are two such ex- ample: Goldbeck and Pekabex. Among the companies enumerated above there is a significant representation of those with at least a portion of foreign capital involved. Typically, foreign investments occurred only after companies be- came successful, in some cases after their listing on the stock exchange. 2.4 Identifying Polish businesses with circularity as their core com- petence There is a gradually growing number of start-ups and small companies that put circular concept as the focus of their activities. They are typically small and medium enterprises that still need to prove their long-term economic viability. Their activities centre around making use of state-of-the-art technolo- gies or trying to cater to ecologically-aware consumers. Polish Circular Hotspot participants analysis may provide insight on types of circular businesses in Poland. The Polish Circular Hotspot is a platform for cooperation of stakeholders interested in the im- plementation of the circular economic model in Poland. Among its members commercial entities form the majority. Most of the companies operate in the construction sector and range from 3D-printed housing (Rebuild) to enabling energy-construction industrial symbiosis (Eco-Tech). The second area where companies show the most interest is tackling the problem of plastics overconsumption and inappropriate plastic waste management (e.g. TOMRA). Textile sector is an area where companies are engaged in the imple- 21. Vide: https://rankingi.rp.pl/lista2000/2020/lista_2000 (accessed on January 14 2021).
30

mentation of the circular economic model as well. This ranges from production of sustainable clothing
(Bohema clothing) to upcycling (Dekoeko). Analysis of Polish Circular Hotspot’s members shows that
other important areas for circular transformation are: food, energy and IT.

Figure 14 Composition of Polish Circular Hotspot members according to sectors they operate in

                                             4%
                                 15%

                                                                                     transportation
                                                               22%
                                                                                     plastics

                     11%                                                             IT

                                                                                     construction

                                                                                     food
                     4%
                                                                 7%                  energy

                                                                                     textiles
                            7%
                                                                                     miscelnous

                                            30%

Source: own elaborations.

From a vantage point it seems that businesses with circularity at their core, are focused either on pro-
viding ecological replacements for current mainstream products and services or increasing productiv-
ity compared to currently available methods. They are more interested in using modern technologies
(e.g. they offer their services in a mobile applications, use 3D printing) than current market leaders. At
the same time it seems that, despite growing consumer awareness, lack of appropriate business envi-
ronment, financing opportunities, etc. precludes or hinders the process of scaling-up their endeavours.
Typically such companies operate in a niche.

2.5 Analysing Dutch circular businesses and their overall business
potential in Polish market conditions - demand and supply analysis

Polish and Dutch economies differ in many important aspects. As of 2019 the Netherlands is the fifth
most developed economy in the EU (judging by GDP per capita), while Poland ranks fifth less devel-
oped country, by the same measure. In fact, according to Eurostat, the GDP per capita for the Nether-
lands is over three times that of Poland in 2019 (EUR 41,9 thousand and 13,0 thousand respectively). The
economic development also manifests itself in different compositions of sectors in the total production
and employment in each country. Dutch economy is visibly more service-oriented, while the Polish
one is still dependant on it historical heritage, with a decisively higher importance of industry, agricul-
ture and manufacturing, especially in terms of employment.
You can also read