Plant Breeding and Evaluation - Tim Rinehart Section Editor - Southern Nursery Association
←
→
Page content transcription
If your browser does not render page correctly, please read the page content below
SNA Research Conference Vol. 59 2014

Plant Breeding
      and
  Evaluation
    Tim Rinehart
       Section Editor

   Plant Breeding and Evaluation        180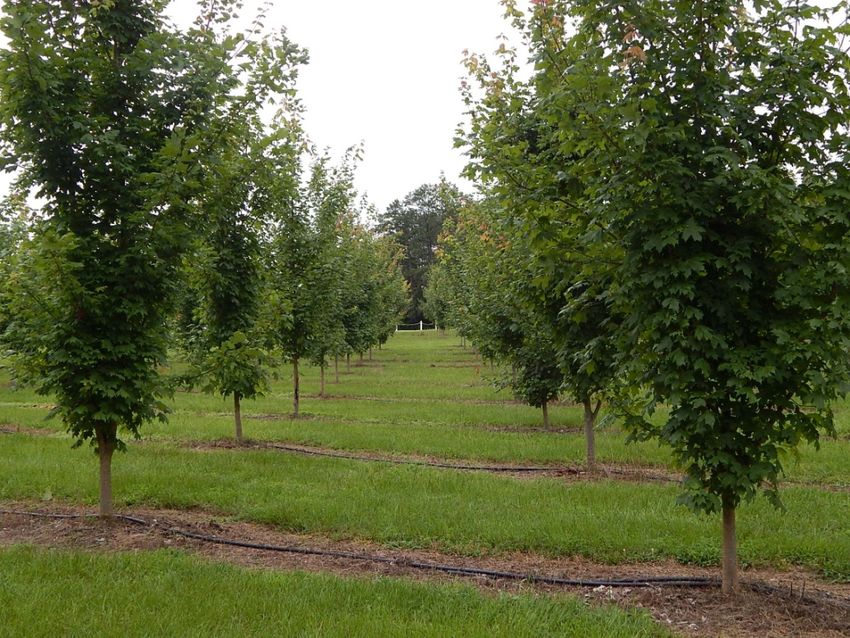
SNA Research Conference Vol. 59 2014

                       Ploidy Levels and Interploid Hybridization in
                        Panicle Hydrangea (Hydrangea paniculata)

                       Winston T. Beck and Thomas G. Ranney
           Department of Horticultural Science, North Carolina State University
             Mountain Horticultural Crops Research and Extension Center
                       455 Research Dr., Mills River, NC 28759

                                    tom_ranney@ncsu.edu

Index Words: cytotype, DNA content, genome size, plant breeding, polyploidy,
reproductive biology

Significance to Industry: Hydrangea paniculata is a medium to large shrub noted for its
excellent floral displays throughout summer, followed by notable winter interest as the
flowers dry and persist through the seasons. Although this species is native to Japan,
Taiwan, and parts of China, it is grown in landscapes around the world (3, 9).Breeding
efforts have been recently been directed towards smaller stature, quality architecture,
panicle size, and coverage of sterile (showy) florets, among other attributes. In nature, H.
paniculata occurs as diploid, tetraploid, and hexaploid cytotypes, where 1x = 18. There is
evidence that most plants in cultivation are tetraploids (10). However, little is known about
the ploidy levels of specific cultivars or potential for interploid hybridization and fertility of
anisoploid progeny. To better understand the reproductive biology and to further breeding
efforts within H. paniculata the objectives of this study were to: 1) determine the ploidy
levels of diverse clones and cultivars, and 2) determine fertility and cytotypes of interploid
and anisoploid hybrids. Although most cultivated plants were tetraploids, pentaploids and
hexaploids were also found. Information on ploidy levels of specific cultivars will facilitate
the development of more strategic and efficient breeding programs. The potential for
interploid hybridization and maintenance of fertility of pentaploids may also allow for the
introgression of traits between these cytotypes and the development of improved
cultivars.

Nature of Work: Samples of cultivated H. paniculata were collected from public gardens
and arboreta for ploidy determination. Interploid crosses were completed between
unnamed tetraploid H. paniculata and hexaploid H. paniculata ‘Dharuma’, a 1989
introduction to the market (9) to create pentaploids. Pentaploids (H2008-081-010 and
H2008-149-032) were open-pollinated to create the H2012-191, H2012-189, and H2012-
185 populations. ‘Jane’ Little Lime® (4x) x H2008-076-030 (5x) generated the H2013-133
population. The reciprocal cross, H2008-076-030 x ‘Jane’ Little Lime® generated the
H2013-132 population. H2008-081-010 (5x) x ‘Phantom’ (4x) generated the H2012-127
population. Due to self-incompatibility in H. paniculata, interploid crosses were completed
by isolating parents in pollination cages.

Flow Cytometry. Relative genome sizes (DNA content) were determined using flow
cytometry (4). Tissue samples (~1 cm2 ) were collected from expanding leaves, placed in
a plastic petri dish with ~0.1g of young floral bud tissue from Magnolia virginiana ‘Jim

                                Plant Breeding and Evaluation                                  181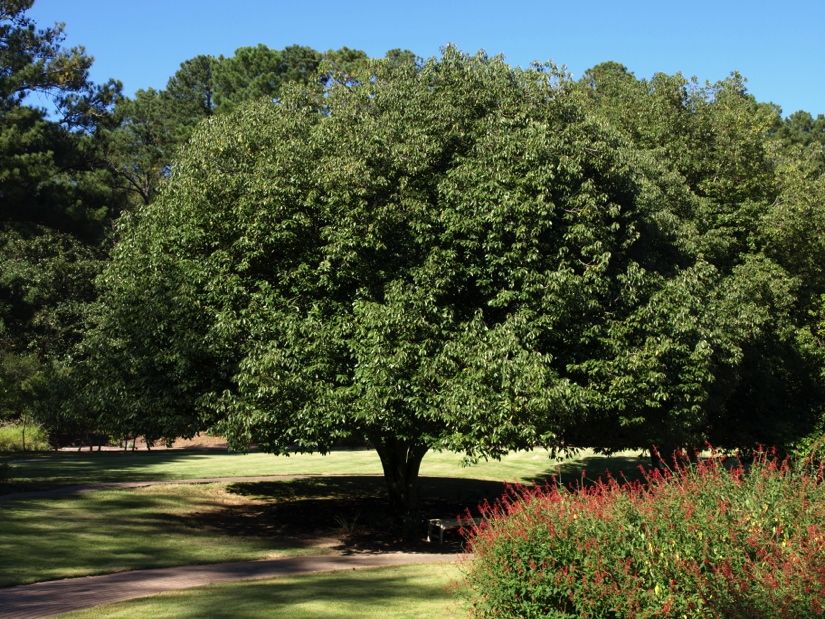
SNA Research Conference Vol. 59 2014

Wilson’ serving as an internal standard with a known genome size of 2C = 3.92 pg (5).
Samples were finely chopped with a razor blade in 0.4 mL of nuclei extraction buffer
(Partec CyStain UV Precise P Nuclei Extraction Buffer; Partec GMBH, Munster,
Germany) and filtered through a 50 µm nylon mesh filter. Nuclei were stained with1.6 mL
4’,6-diamidino-2-phenylindole (DAPI) immediately prior to analysis with a flow cytometer
(Partec PA II, Munster, Germany). Samples were run until 5000 nuclei were counted with
a CV of less than 5%. Two subsamples were analyzed for each accession.

Cytology. ‘Jane’ Little Lime®, H2009-149-046, and ‘Dharuma’ were used to confirm and
calibrate ploidy levels with genome sizes for 4X, 5X, and 6X plants, respectively. Actively
growing root tips were excised from containerized plants in late July and placed into 3 mL
of 2mM 8-hydroxyquinoline/0.248mM cycloheximide. Roots were incubated in
hydroxyquinoline/cycloheximide solution for 2 HR at 23°C, and moved to 40°F for an
additional 3 HR. Roots were then fixed in 3mL of 3 parts 95% Ethanol : 1 part propionic
acid fixative solution at 70°F for 18 HR prior to examination.

Results and Discussion: Ploidy levels and chromosome numbers for ‘Jane’ Little Lime®,
H2009-149-046, and ‘Dharuma’ were confirmed to be tetraploid (2n = 4x = 72), pentaploid
(2n = 5x = 90), and hexaploid (2n = 6x = 108), respectively. Ploidy levels were calibrated
with genome sizes based on these representative cytotypes. Relative genome sizes were
determined for 46 cultivars, 12 wild-collected accessions, and 61 interploid/anisoploid
crosses of H. paniculata (Table 1). Mean genome sizes were found to be 7.4, 8.5, and
10.5 pg for 4x, 5x, and 6x plants respectively, clearly differentiating among ploidy levels.
Overall mean1Cx genome size was1.80pg, slightly higher than values reported by
Zonneveld (10) when using propidium iodide stain and Agave americana as an internal
standard.

The vast majority of cultivated H. paniculata were found to be tetraploids (or near
tetraploids) with 2C genome sizes ranging from 6.4 to 7.96 pg. ‘Dharuma’ and ‘Praecox’
were the only hexaploid cultivars found, though several wild-collected hexaploids from
Japan were also identified. These two cultivars are noted for early blooming, although the
panicles on ‘Dharuma’ have a flattened, less attractive appearance than other cultivars (2,
7, 8). The bloom-time differences and floral morphologies of ‘Dharuma’ and ‘Praecox’
have been noted before. However, these differences were thought to be a result of sub-
specific variation, rather than the effect of ploidy (9). Three commercial cultivars were
found to be pentaploid including ‘Bulk’ Quick Fire®, ‘SMHPLQF’ Little Quick Fire™, and
‘Wim’s Red’ Fire and Ice. These most likely resulted from interploid hybridization,
potentially with ‘Dharuma’ as a parent (9).

Interploid crosses between tetraploids and hexaploids produced pentaploid progeny with
genome sizes ranging from 8.1 to 8.8 pg. Unlike many anisoploids, pentaploid H.
arborescens maintained some fertility as both males and females. Crosses between
pentaploids and tetraploids tended to produce progeny with genome sizes within or near
the tetraploid range, suggestion a bias towards euploidy/isoploidy. Open pollenated
pentaploids produced progeny with genome sizes ranging from 7.3 pg (~4X) to 9.0 pg

                              Plant Breeding and Evaluation                              182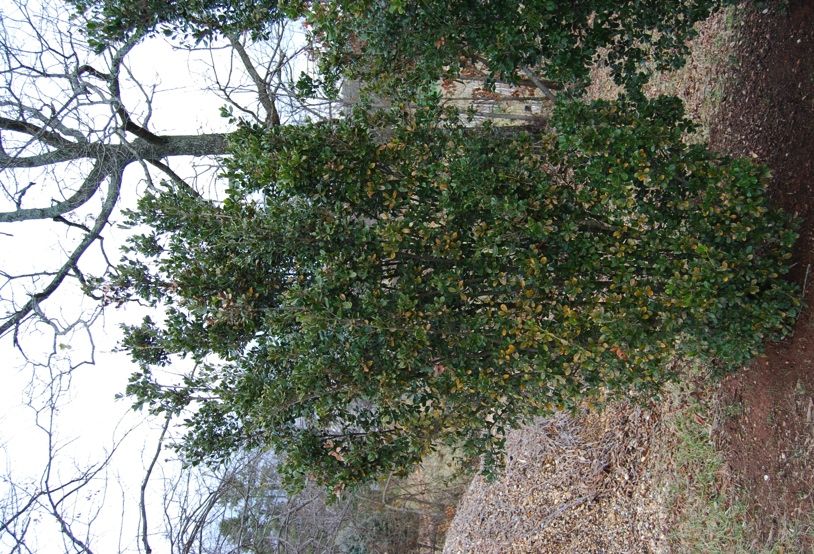
SNA Research Conference Vol. 59 2014

(~5X), as well as one plant with 12.8 pg (~7.5X), most likely resulting from an unreduced
gamete from one parent. Reed (6) showed that H. macrophylla can produce unreduced
gametes with some regularity. Triploids reported in by Funamoto (3) in H. paniculata
could have been the result of unreduced gametes from diploid parents or potentially from
interploid hybridization.

Another point of interest is the lack of diploid plants in commerce and from the wild-
collected material. While Funamoto and Ogawa (3) suggested that there were no
morphological differences between cytotypes of H. paniculata, it appears that tetraploids
and to a lesser degree hexaploids have been preferentially selected for horticultural use.

These results document genome sizes and ploidy levels of diverse cultivars, hybrids, and
wild-collected accessions of H. paniculata. Furthermore, it was found that interploid
hybrids can be easily produced and that pentaploid hybrids maintain fertility and can
produce offspring with a wide range of cytotypes including aneuploids, (near) euploids,
and higher ploidy levels resulting from unreduced gametes.

Acknowledgements: We would like to thank those at the institutions that have donated
material for research purposes: Chicago Botanic Gardens, Morton Arboretum, J.C.
Raulston Arboretum, Smithgall Woodland Gardens, and Juniper Level Botanic Gardens,
as well as the staff of the Mountain Crop Improvement Lab for their support on this
project.

Literature Cited
1.     Bulk, R. (2006). Hydrangea plant named ‘Bulk’. United States Plant Patent
       PP16812. Canada Food Inspection Agency. 2012. Applications Accepted for Filing.
       Plant Varieties Journal, 85. 16 August, 2013.
       http://www.inspection.gc.ca/english/plaveg/pbrpov/journal/appsaccept85e.shtml#hy
       dr
2.     Dirr, M. A. (2009). Manual of Woody Landscape Plants: Their Identification,
       Ornamental Characteristics, Culture, Propagation and Uses. 6th edition. Stipes
       Publishing L.L.C., Champaign, IL.
3.     Funamoto, T. and Ogawa, M. (2002). A Cytogeographical Study in Hydrangea
       paniculata Sieb. (Saxifragaceae s.l.) in Japan. Chromosome Science, 6, 73-82.
4.     Kao, K.N. 1975. A Nuclear Staining Method for Plant Protoplasts p. 60-62. In: O.L.
       Gamborg and L.R. Wetter (eds.). Plant Tissue Culture Methods. National Research
       Council of Canada Prairie Regional Laboratory, Saskatoon, Saskatchewan
5.     Parris, K. J., Ranney, T. G., Knap, H. T., Baird, W. V. 2010. Ploidy Levels, Relative
       Genome Sizes, and Base Pair Composition in Magnolia. J. Amer. Soc. Hort. Sci.
       135(6): 533-547.
6.     Reed, S. M., T. A. Rinehart. 2007. Analysis of Ploidy Level and Its Effects on
       Guard Cell Length, Pollen Diameter, and Fertility in H. macrophylla. HortScience
       42(3): 483-488.
7.     Reed, S.M., T. A. Rinehart. 2009. Simple-Sequence Repeat Marker Analysis of
       Genetic Relationships Within Hydrangea paniculata. Hort Science 44 (1): 27-31.

                              Plant Breeding and Evaluation                              183
SNA Research Conference Vol. 59 2014

8.    Sanders, C. 2009. The RHS Hydrangea paniculata Trial. The Plantsman 8 (3):
      168-175.
9.    Van Gelderen, J. and Van Gelderen, D. M. (2004). Encyclopedia of Hydrangeas.
      Portland, OR: TimberPress.
10.   Zonneveld, B. J. M. (2004). Genome Size in Hydrangea. Chapter in: Van
      Gelderen, J. and Van Gelderen,
      D. M. (2004). Encyclopedia of Hydrangeas. Portland, OR: Timber Press. 245-251.

Table 1. Relative genome sizes and ploidy levels determined via flow cytometry for
cultivars and hybrids of H. paniculata.
                                         Relative 2C genome size
        z
Source Taxa                                  [mean ± SE (pg)]           Ploidy level (x)
SWG 2012SM12118 Taiwan                          7.71 ± 0.02                    4
MOR 417-99 ‘White Tiara’                        7.51 ± 0.31                    4
MOR 533-57 Kyoto U. Exp. Station,               7.26 ± 0.07                    4
         Japan
MOR 101-99 Götenburg B.G.,                      7.67 ± 0.22                    4
         Sweden
MOR 149-2011 ‘Paszam'                           7.30 ± 0.17                    4
CBG ‘Angustipetala’                             7.04 ± 0.15                    4
CBG ‘Barbara’ The Swan™                         7.96 ± 0.04                    4
CBG ‘Big Ben’                                   7.34 ± 0.11                    4
PDN BL 17-01                                    6.87 ± 0.08                    4
CBG ‘Bokrathirteen’ Sweet Summer                7.30 ± 0.05                    4
JCR ‘Bokratorch’ Magical™Flame                  7.88 ± 0.53                    4
CBG ‘Bombshell’                                 7.29 ± 0.07                    4
CBG ‘Boskoop’                                   6.87 ± 0.05                    4
CBG ‘Brussel’s Lace’                            7.53 ± 0.13                    4
CBG ‘Burgundy Lace’                             7.36 ± 0.17                    4
CBG ‘Chantilly Lace’                            7.28 ± 0.02                    4
CBG ‘Dolly’                                     7.31 ± 0.03                    4
                                ®
CBG ‘Dvppinky’ Pinky Winky                      7.28 ± 0.13                    4
CBG ‘Floribunda’                                7.35 ± 0.03                    4
CBG ‘Greenspire’                                7.20 ± 0.07                    4
                                     ®
CBG ‘Hypmad I’ White Diamonds                   7.06 ± 0.03                    4
                                 ®
CBG ‘Hypmad II’ Tickled Pink                    7.31 ± 0.01                    4
                        ®
CBG ‘ILVOBO’ Bobo                                7.29 ±0.13                    4
                          ®
CBG ‘Jane’ Little Lime                           7.17 ±0.02                    4
CBG ‘Kyushu’                                    7.67 ± 0.17                    4
                                  ®
CBG ‘Le Vasterival’ Great Star                  7.43 ± 0.08                    4

                             Plant Breeding and Evaluation                             184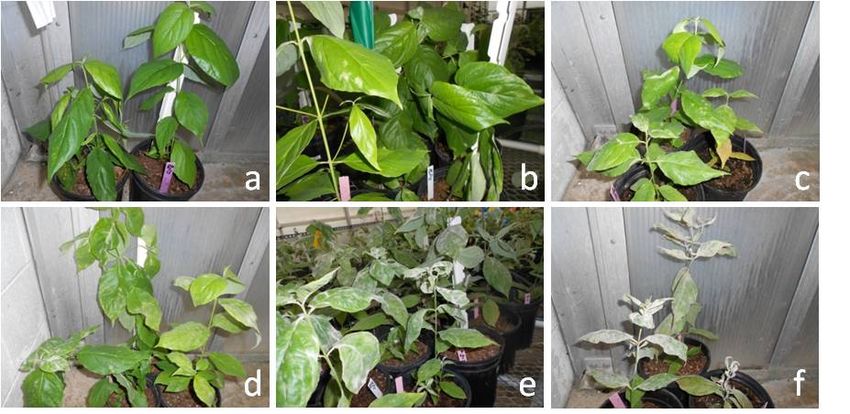
SNA Research Conference Vol. 59 2014

CBG   ‘Little Lamb’                          7.28 ± 0.02      4
CBG   ‘Mega Pearl’                           7.30 ± 0.19      4
CBG   ‘Interhydia’ Pink Diamond              7.02 ± 0.16      4
PDN   PD 01-01                               6.57 ± 0.03      4
PDN   PD 14-01                               6.74 ± 0.06      4
PDN   PD 14-01                               6.41 ± 0.02      4
CBG   ‘Pink Lady’                            7.45 ± 0.08      4
CBG   ‘Renhy’ Vanilla Strawberry™            7.29 ± 0.01      4
CBG   ‘Revival’ Honeycomb™                   7.48 ± 0.02      4
CBG   ‘Ruby’ Angel’s Blush™                  7.21 ± 0.12      4
SWG   ‘Shadow’                               6.92 ± 0.09      4
JCR   ‘Shikoku Flash’                        7.54 ± 0.10      4
CBG   ‘Silver Dollar’                        7.33 ± 0.04      4
CBG   ‘Skylight’                             7.29 ± 0.07      4
CBG   ‘SMHPFL’ Fire Light®                   7.27 ± 0.13      4
PDN   TCM 12-666                             7.40 ± 0.02      4
CBG   ‘Unique’                               7.52 ± 0.13      4
CBG   ‘Webb’s Grandiflora’                   7.22 ± 0.05      4
CBG   ‘White Lace’                           6.93 ± 0.00      4
CBG   ‘White Lady’                           7.42 ± 0.02      4
CBG   ‘White Moth’                            7.00 ±0.19      4
CBG   ‘White Tiara’                          7.27 ± 0.04      4
CBG   ‘WRHPBB2’ Polar Bear™                  7.54 ± 0.11      4
CBG   ‘Zwijnenburg’ = ‘Limelight’            7.15 ± 0.06      4
CBG   ‘Bulk’ Quick Fire® (1)                 8.76 ± 0.21      5
CBG   ‘SMHPLQF’ Little Quick Fire™           8.47 ± 0.14      5
CBG   ‘Wim’s Red’ Fire and Ice               8.79 ± 0.04      5
CBG   ‘Dharuma’                              10.48 ± 0.01     6
MOR   30-98 – Mt. Iwo, Hokkaido,             10.56 ± 0.03     6
      Japan.
MOR   374-82 ‘Praecox’                       10.52 ± 0.16     6
MOR   135-99 Kuta, Kyoto, Japan.             10.73 ± 0.05     6
MOR   140-2009 ‘Dharuma’                     10.49 ± 0.17     6
MOR   180-2001 Chiba U. Japan.               10.24 ± 0.04     6
MOR   186-2000 Tohaka U. Sendai,             10.41 ± 0.04     6
      Japan.

                          Plant Breeding and Evaluation           185
SNA Research Conference Vol. 59 2014

                               4x × 6x Crosses
MCI   H2008-076-030                       8.53 ± 0.13         5
MCI   H2008-081-010                       8.77 ± 0.01         5
MCI   H2008-081-018                       8.12 ± 0.15         5
MCI   H2008-081-024                       8.37 ± 0.10         5
MCI   H2008-082-011                       8.53 ± 0.10         5
MCI   H2008-082-027                       8.56 ± 0.03         5
MCI   H2008-095-002                       8.45 ± 0.14         5
MCI   H2008-095-021                       8.42 ± 0.08         5
MCI   H2008-095-027                       8.67 ± 0.08         5
MCI   H2009-146-046                       8.69 ± 0.04         5
MCI   H2009-149-032                       8.28 ± 0.07         5
                               5x × 4x Crosses
MCI   H2013-127-001                       7.52 ± 0.05        ~4.2
MCI   H2013-127-002                       7.52 ± 0.08        ~4.2
MCI   H2013-127-003                       7.48 ± 0.03        ~4.2
MCI   H2013-127-004                       7.57 ± 0.15        ~4.2
MCI   H2013-127-005                       7.51 ± 0.02        ~4.2
MCI   H2013-127-009                       7.62 ± 0.08        ~4.2
MCI   H2013-127-010                       7.66 ± 0.05        ~4.3
MCI   H2013-127-015                       7.58 ± 0.02        ~4.2
MCI   H2013-127-016                       7.62 ± 0.12        ~4.2
MCI   H2013-127-025                       7.63 ± 0.02        ~4.2
MCI   H2013-127-028                       7.51 ± 0.05        ~4.2
MCI   H2013-132-001                       7.61 ± 0.04        ~4.2
MCI   H2013-132-002                       8.19 ± 0.78        ~4.6
MCI   H2013-132-003                       7.61 ± 0.06        ~4.2
MCI   H2013-132-004                       8.17 ± 0.11        ~4.5
MCI   H2013-132-005                       7.47 ± 0.01        ~4.2
MCI   H2013-132-006                       7.68 ± 0.15        ~4.3
MCI   H2013-132-007                       9.71 ± 0.10        ~5.4
MCI   H2013-132-008                       8.10 ± 0.20        ~4.5
MCI   H2013-132-009                       7.64 ± 0.01        ~4.3
MCI   H2013-132-010                       8.85 ± 0.07        ~4.9
                               4x × 5x Crosses
MCI   H2013-133-001                       7.41 ± 0.02        ~4.1
MCI   H2013-133-002                       7.23 ± 0.01        ~4.0
MCI   H2013-133-003                       7.21 ± 0.07        ~4.0
MCI   H2013-133-004                       7.45 ± 0.01        ~4.1

                        Plant Breeding and Evaluation               186
SNA Research Conference Vol. 59 2014

                                      5x Open Pollinated
MCI    H2012-185-004                        7.58 ± 0.21                 ~4.2
MCI    H2012-185-005                        8.93 ± 0.33                 ~5.0
MCI    H2012-185-006                        8.95 ± 0.01                 ~5.0
MCI    H2012-185-008                        8.44 ± 0.19                 ~4.7
MCI    H2012-185-010                        7.96 ± 0.23                 ~4.4
MCI    H2012-185-011                        7.50 ± 0.31                 ~4.2
MCI    H2012-185-013                        7.82 ± 0.09                 ~4.4
MCI    H2012-185-015                        7.74 ± 0.04                 ~4.3
MCI    H2012-185-022                        8.04 ± 0.04                 ~4.5
MCI    H2012-185-023                        8.07 ± 0.03                 ~4.5
MCI    H2012-185-024                        8.17 ± 0.30                 ~4.5
MCI    H2012-185-028                        8.97 ± 0.13                 ~5.0
MCI    H2012-189-002                        8.46 ± 0.02                 ~4.7
MCI    H2012-189-003                        12.78 ± 0.04                ~7.1
MCI    H2012-189-004                        8.05 ± 0.03                 ~4.5
MCI    H2012-191-001                        8.86 ± 0.21                 ~4.9
MCI    H2012-191-002                        7.62 ± 0.02                 ~4.2
MCI    H2012-191-003                        8.85 ± 0.00                 ~4.9
MCI    H2012-191-004                        8.60 ± 0.06                 ~4.8
MCI    H2012-191-005                        8.72 ± 0.15                 ~4.9
MCI    H2012-191-006                        7.32 ± 0.02                 ~4.1
MCI    H2012-191-007                        8.00 ± 0.15                 ~4.5
MCI    H2012-191-008                        8.00 ± 0.15                 ~4.5
MCI    H2012-191-009                        8.22 ± 0.06                 ~4.6
MCI    H2012-191-010                        7.25 ± 0.05                 ~4.0

z
  Source Codes: CBG; Chicago Botanic Gardens. JCRA; JC Raulston Arboretum,
Raleigh, NC. MCI; Mountain Crop Improvement Lab, Mills River, NC. MOR; Morton
Arboretum. PDN; Plant Delights Nursery, Raleigh, NC. SWG; Smithgall Woodland
Garden, Gainesville, GA.
x
  Also known by the name “Early Sensation” in Europe.

                           Plant Breeding and Evaluation                        187
SNA Research Conference Vol. 59 2014

                     Inheritance of Powdery Mildew Resistance in
                       Flowering Dogwoods (Cornus florida L.)

                 Lipi Parikh, S. Kodati, M. T. Mmbaga and Gurong Zhang

                 Department of Agricultural and Environmental Sciences
                  College of Agriculture, Human and Natural Sciences
                              Tennessee State University
                    3500 John A Merritt Blvd, Nashville, TN 37209

                                 lparikh@my.tnstate.edu

Index Words: Cornus florida, powdery mildew, disease management, Erisyphe pulchra

Significance of Work: Powdery mildew of Cornus florida is one of the most destructive
diseases in nursery production throughout the Southeastern U.S. Planting resistant
cultivars is the most successful long term solution to powdery mildew control problem in
dogwoods. Host plant resistance is a cornerstone of IPM and a key strategy for powdery
mildew disease management. Efforts to breed for resistance have been undertaken, but
only a few cultivars show powdery mildew resistance. The mode of inheritance for
powdery mildew resistance in flowering dogwoods is not understood; such information will
facilitate the breeding efforts and allow plant breeders to develop new cultivars with novel
phenotypes and disease resistance.

Nature of work: Cornus is a large genus of trees, and shrubs with approximately 65
species collectively known as dogwoods. Several species of dogwoods are cultivated for
their showy bracts, attractive fall color of foliages, twigs and fruit color (5). Flowering
dogwoods (C. florida) and Kousa dogwood (C. kousa) are the two major species grown in
the nursery production industry (4). Flowering dogwood is an economically important
ornamental tree with 30 million dollars in total sales in U.S. and 23.2% of the total US
dogwood supplies are from Tennessee (9, 10). In early 90's powdery mildew caused by
Erisyphe pulchra emerged as one of the most destructive diseases of dogwood that limits
nursery production of flowering dogwood. In addition to reducing the aesthetic appeal and
commercial value of infected plants, it reduces the plant growth, thereby increasing the
time needed for infected plants to reach its prime size for sale (5, 11).

Effective fungicides for powdery mildew control have been identified, but frequent
application is required season long, that has increased production costs and forced small
growers out of business. Host resistance to powdery mildew would be the best method to
manage the powdery mildew disease problem in flowering dogwoods; it is friendly to the
environment and less expensive for growers. Host resistance has become a cornerstone
of IPM and a key strategy in plant disease management. While efforts to breed for
powdery mildew resistance are underway, only a few cultivars show powdery mildew
resistance in different locations. Understanding the pattern of inheritance of powdery
mildew resistance from parents to progeny is important to facilitate breeding strategies.

                              Plant Breeding and Evaluation                              188
SNA Research Conference Vol. 59 2014

This study was carried out at Tennessee State University, main campus, Nashville, TN
and Otis L. Floyd Nursery Research Center, McMinnville, TN. The aim of this study was
to understand the mode of inheritance of resistance/susceptibility to powdery mildew in
flowering dogwoods.

Controlled hand pollinations were conducted between susceptible cultivar of C. florida
‘Cherokee Princess’ (CP) and resistant selections R14, MI9 and ‘Cherokee Brave’ (CB).
On an average, 50 sets of 8 inflorescences were selected from each parent and the
inflorescence was covered with breathable plastic bags before flowers opened so as to
eliminate pollen contaminations. Since dogwood is self-incompatible (7), flower
emasculation was not needed. Crosses were conducted by controlled hand pollination by
rubbing the anthers on stigma of female parents in 2004, 2011 and 2012. Breathable
bags were maintained until seeds from the crosses were harvested. Normal procedure in
depulping the seed was done manually and seeds were air-dried at room temperature,
vernalized at 4°C for 3 months to overcome the dormancy. Following seed germination at
4°C, seeds were sown and seedlings grown in 4 inch pots in greenhouse environment.
The progeny seedlings were exposed to powdery mildew pathogen using air-borne
spores from previously infected plants and evaluated for disease severity in the year after
controlled crosses were conducted. Disease severity was monitored and rated using a 0-
5 scale where, 0= no disease, 1 = 1-10%, 2 = 11- 25%, 3 = 26- 50% ,4 = 51- 75% and 5
= 76- 100% of foliage area with powdery mildew symptoms (5) (Fig. 1). Disease rating
was scored 3 times starting in end of June, July and August. The highest disease reading
scores were used for subsequent data analysis. Data obtained from disease severity
measurements was analyzed using Microsoft Excel. The distribution frequency for the
progeny disease severity readings was plotted to determine whether the distribution was
continuous or formed discrete classes. Narrow sense heritability (h2) was calculated by
using the regression between mid-parent value and progeny mean. The slope of
regression line will be the value for h2 that would suggest effect of additive gene for the
disease resistance trait (8).

Results and Discussion: Controlled crosses between the parents CP (susceptible), CB
(moderately resistant), R14 and MI9 (resistant selections) C. florida produced ‘pseudo’ F2
progeny plants with a wide range of susceptibility to powdery mildew disease that ranged
from highly susceptible to resistant reactions (Figure 1). Some of the progeny
susceptibility levels exceeded the parental susceptibility. Powdery mildew disease
severity for the parents in the three years’ study is shown in Table 1. The lowest disease
severity was from selections R14 followed by MI-9, Cherokee Brave exhibited moderate
resistance (Table 1).

The distribution frequency of powdery mildew disease readings for pseudo F2 progeny of
controlled crosses of 2005, 2012 and 2013 is shown in the Figures 1, 2 and 3. The
distribution showed a continuous phenotypic variation (Fig 2, 3, 4). No discrete classes of
powdery mildew reactions were observed; amongst progeny population from each cross,
the transgressive segregations fit a normal curve with slight skew. This type of continuous
distribution of powdery mildew disease severity amongst pseudo F2 progeny indicates that

                              Plant Breeding and Evaluation                             189
SNA Research Conference Vol. 59 2014
the resistance to powdery mildew in C. florida has a quantitative inheritance. These
results are similar to a report on bacterial leaf spot disease resistance in pseudo F2
population of Mulbery (8). In 2006 and 2009, Han et al. (1)and Bokmeyer et al. (3)
reported similar continuous distributions of grey leaf spot and brown patch disease
severity on perennial rye grass and tall fescue respectively and suggested that the
inheritance was quantitative (1,3).
Narrow sense heritability estimates based on the mid-parental value and progeny mean
regression analysis were 0.69, 0.84 and 0.86 for the progeny of the controlled crosses of
2005, 2012 and 2013 respectively (Figure 5, 6, 7). The R squared values for the 2005
progeny was 0.54 and 2012 and 2013 had the R squared values of 1.0 and 0.69. High
narrow sense heritability suggested the presence of additive gene effects. Bovi et al. in
2004 also reported high narrow sense heritability values for sooty mold resistance in
Archonotophoenix palm (2).
The continuous distribution, high narrow sense heritability estimates (0.69, 0.84, and
0.86) suggested that powdery mildew disease resistance may be controlled by additive
gene effects. Powdery mildew severity is highly affected by environmental conditions
especially temperature and moisture. It is likely that environmental variations from year to
another somewhat affected disease severity and contributed to variations in disease
severity from year to year. However, the narrow-sense heritability, h2 = VA/VP, for all
crosses in the three years show the proportion of genetic variation that is due to additive
genetic values (VA) that is most important in plant selections. Further analysis of the data
using broad sense heritability estimates using analysis of variance have not been done,
but the numerous crosses done all suggest quantitative resistance of additive genes.
Thus, we expect that the determination of mode of inheritance for powdery mildew
resistance from this study will facilitate plant breeding to develop a new generation of
powdery mildew resistant cultivars.
Literature Cited
1. Bokmeyer, J. M., Bonos, S. A., and Meyer. W. A. (2009). Inheritence charateristics of
brown patch resistance in tall fescue. Crop Science, 49, 2302-2308.
2. Bovi, M.L. A., Deresende, N. D. V., Saes L. A., and Uzzo, R. P. (2004). Genetic
analysis for sooty mold resistance and heart of palm yield in Archontophoenix.
Science Agriculture (Piracicaba, Braz), 61,178-184
3. Han, Y., Bonos, S. A., Clarke, B. B., and Meyer, W. A. (2006). Inheritence of
resistance to grey leaf spot disease in perenial rye grass. Crop Science, 46, 143-1148
4. Hillier Nurseries, Hiller, A., and Coombes, J.J. 2007. Hillier’s manual of trees
and Shrubs. Davis and Charles, Newton Abbot, United Kingdom.
5. Mmbaga, M. T., & Sauvé, R. J. (2004). Multiple disease resistance in dogwood for
three foliar pathogens. J Arboriculture: 30(2) : 101- 10.
6. Ranney TG, Grand LF, Knighten JL (1995). Susceptibility of cornus kousa cultivars
and hybrids to dogwood anthracnose and powdery mildew. J. of Arboriculture, 21:11-
16.
7. Reed, S.M. 1999. Development of a labor - efficient hand pollination procedure for
flowering dogwood. J. Environ. Hortic. 17: 92 94.
Plant Breeding and Evaluation 190SNA Research Conference Vol. 59 2014
8. Rita Banerjee, N. K. Das, S. G. Doss, A. K. Saha, A. K. Bajpai, and B. B. Bindroo.
(2012). Narrow sense heritability estimates of bacterial leaf spot resistance in pseudo
F2 (F1) population of mulberry (Morus spp.). European Journal of Plant Pathology.
doi:10.1007/s10658-011-9894-z
9. U.S. Department of agriculture.1998. Census of horticultural specialties, USDA,
Natl.Agr. Stat. Serv., Wash., D.C.
10. US Department of Agriculture. 2009. 2007 census of agriculture, Washington
DC
11. Windham, M. T., Trigiano, R. N., & Windham, A. S. (1962). Susceptibility of Cornus
Species to Two Genera of powdery mildew. J. Environ. Hortic. 23: 190 - 192.
Plant Breeding and Evaluation 191SNA Research Conference Vol. 59 2014
Table 1: Powdery mildew disease severity of parents in greenhouse conditions at the
location of the progeny
Parents Year evaluated Location Disease severity
(greenhouse)
Cherokee Princess Tennessee State
4.5
University
Cherokee Brave 2005 Otis Floyd Nursery 2.5
MI9 Research Center,
McMinnville 1.5
Cherokee Princess Tennessee State
4.5
2012 University
R14
Otis Floyd Nursery 1.0
MI9 Research Center,
McMinnville 1.5
Cherokee Princess Tennessee State 3.0
University
R14
2013 Otis Floyd Nursery 0.5
MI9 Research Center,
McMinnville 1.0
Cherokee Brave Tennessee State 3.5
R14 University
2013 Main campus 1.0
MI9 (Nashville) 2.0
Figure 1: Disease severity rated on flowering dogwoods in greenhouse at Tennessee
State University, Otis L. Floyd Nursery research center, McMinnville, TN: (a) 0 (b) 1 (c) 2
(d) 3 (e) 4 (f) 5
Plant Breeding and Evaluation 192SNA Research Conference Vol. 59 2014
20
a 30
No.
of
progeny
b
25
No.
of
Plants
15
20
10
15
5
10
5
0
0.5
1.5
2.5
3.5
4.5
0
0.5
1.5
2.5
3.5
4.5
Disease
severity
Disease
severity
60
c 10
50
d
No.
of
Plants
No.
of
plants
40
8
30
6
20
4
10
2
0
0
0.5
1.5
2.5
3.5
4.5
0.5
1.5
2.5
3.5
4.5
Disease
severity
Disease
severity
Figure 2. (Controlled crosses evaluated in 2005): (a) MI9 X Cherokee Princess. (b) Cherokee
Princess X MI9. (c) MI9 X Cherokee Brave (d) Cherokee Brave X MI9.
50
30
a b
40
25
No.
of
plants
No.of
plants
20
30
15
20
10
10
5
0
0
0.5
1.5
2.5
3.5
4.5
0.5
1.5
2.5
3.5
4.5
Disease
severity
Disease
severity
Figure 3. (Controlled crosses evaluated in 2012): (a) R14 X Cherokee Princess. (b) MI9 X
Cherokee Princess.
Plant Breeding and Evaluation 193SNA Research Conference Vol. 59 2014
200
100
b
No.of
plants
No.of
plants
a 80
150
60
100
40
50
20
0
0
0.5
1.5
2.5
3.5
4.5
0.5
1.5
2.5
3.5
4.5
Disease
severity
Disease
severity
250
100
c d
200
80
No.of
plants
No.of
plants
150
60
100
40
50
20
0
0
0.5
1.5
2.5
3.5
4.5
0.5
1.5
2.5
3.5
4.5
Disease
severity
Disease
severity
250
700
f
e 600
200
No.
of
Plants
No.
of
Plants
500
150
400
100
300
200
50
100
0
0
0.5
1.5
2.5
3.5
4.5
0.5
1.5
2.5
3.5
4.5
Disease
severity
Disease
severity
300
g
No.
of
Plants
200
100
0
0.5
1.5
2.5
3.5
4.5
Disease
Severity
Figure 4 (Controlled crosses evaluated in 2013): (a) R14 X Cherokee Brave (b) Cherokee Brave X
R14 (c) MI9 X Cherokee Brave (d) Cherokee Brave X MI9 (e) R14 X Cherokee Princess (f)
Cherokee Princess X R14 (g) Cherokee Princess X MI9.
Plant Breeding and Evaluation 194SNA Research Conference Vol. 59 2014
y
=
0.74x
+
0.67
4
R²
=
0.69072
Progeny
Mean
(disease
3.5
3
severity)
2.5
2
1.5
1.5
2
2.5
3
3.5
Mid-‐Parent
disease
severity
Figure 5: Mid-parent progeny regression of
pseudo F2 population means on the mid-parent
values from 4 crosses from 3 C. florida evaluated
in 2005.
y
=
0.84x
-‐
0.04
2.5
R²
=
1
Progeny
mean
(disease
2.45
2.4
severity)
2.35
2.3
2.25
2.7
2.8
2.9
3
3.1
Mid-‐parent
Value
(disease
severity)
Figure 6: Mid-parent progeny regression of
pseudo F2 population means on the mid-parent
values of 2 crosses from 3 C. florida parents
evaluated in 2012.
Plant Breeding and Evaluation 195SNA Research Conference Vol. 59 2014
y
=
0.8694x
+
0.6745
3.5
R²
=
0.5423
Progeny
mean
(disease
3
severity)
2.5
2
1.5
1.5
2
2.5
3
Mid-‐Parent
disease
severity
Figure 7: Mid-parent progeny regression of
Pseudo F2 population means on the mid-parent
values of 7 crosses from 4 C. florida parents
evaluated in 2013.
Plant Breeding and Evaluation 196SNA Research Conference Vol. 59 2014
Acer saccharum ssp. skutchii, the Mexican Mountain Sugar Maple
David Creech
Stephen F. Austin State University, SFA Gardens, 1924 Wilson Drive
Nacogdoches, TX 75962-3000
dcreech@sfasu.edu
Index words: Acer saccharum ssp. skutchii, skutch maple, drought and alkalinity
tolerance, landscape evaluation, propagation
Significance to Industry: While sugar maple enjoys a sizeable market in the U.S and
many cultivars are available, the Mexico mountain sugar maple or skutch maple, Acer
saccharum ssp. skutchii, remains relatively unknown. This disjunct wing of sugar maple
has endured over 9000 years of divergent evolution apart from relatives in eastern North
America (4). The tree is similar in many respects to Acer saccharum, sugar maple, and
Acer saccharum var. floridanum (syn. A. barbatum), the Florida maple, but features larger
leaves, and perhaps the biggest samaras found in Aceraceae. The skutch maple offers
opportunities for enhanced growth rate, interesting fall and spring foliage color, alkalinity
tolerance, drought tolerance and good adaptation to well drained sunny locations in
landscapes of the southern USA, east to west. Dirr lists 47 varieties of sugar maple in the
industry (1). None include the diverse genetics of this western relative, the skutch maple
of Mexico.
Nature of Work: SFA Gardens comprises 128 acres (52 ha) of on-campus property at
Stephen F. Austin State University (SFA), Nacogdoches, Texas. Initiated in 1985, SFA
Gardens focuses on diversity, collections, rare and unusual species and cultivar
collections, and promotes plants that perform well in East Texas and Louisiana
landscapes. SFA Gardens has an extensive collection in the Aceraceae, with western
genotypes well represented. The skutch maple is a genetic resource for breeders
interested in improving growth rate, and drought, heat, and alkalinity tolerance.
Background: In 1993, Simpson and Hipps assigned nine, possibly ten, maples to the
southwestern USA (6). They noted that certain provenances of A. grandidentatum,
Bigtooth maple, and the Caddo maple, a unique genotype of A. saccharum from
southwestern Oklahoma, were particularly good performers in higher pH soils. Skutch
maple, or the cloud forest sugar maple, Acer saccharum ssp. skutchii, is the least known
in the USA and is the southern and western most sugar maple. It occurs naturally as six
disjunct populations, with five in Mexico and one in Guatemala (7). First described in
Guatemala in 1936 (5), the skutch maple is a rare relic from the Miocene era, probably
separated from those in North America since the end of the Pleistocene over 9000 years
ago (4). Lara-Gomez characterized variation in isolated skutch maple populations in
Mexico (2). Yalma Luisa Vargas-Rodriguez, who graduated from Louisiana State
University in 1995, hypothesized that the “six forest sites in Jalisco,
Plant Breeding and Evaluation 197SNA Research Conference Vol. 59 2014 Tamaulipas, Veracruz, and Hidalgo (Mexico) contain a unique and ancient flora, were connected and shared species before the Pleistocene, and currently function as tree refuges of that ancient flora” (8). Because of the small number of populations and low numbers in each population, Vargas-Rodriguez proposed to include Skutch maple in the IUCN Red List Catalog and as Endangered in the Guatemalan Species Red List. SFA Gardens Research: The oldest skutch maple at SFA Gardens was planted in 1994 and originated from seed collected in the Tamaulipas location (3) by John Fairey and Carl Schoenfeld of Yucca Do Nursery, Hempstead, Texas. Now twenty years old, the tree is 46 ft (14 m) tall with an 18 in (45.7 cm) diameter at breast height (dbh). It has grown well without irrigation, is oval shaped, exceptionally marcescent, and failed to develop showy fall color until after first flowering, an event that took 9 years to initiate. Fall color varies between butterscotch yellow to reds and oranges, depending on year. Propagation: The samaras are large and showy. In our location, seed are often empty, with viable seed at less than 10%. In 2009 the tree produced a heavy seed crop and we allowed the samaras to fall and then covered the area with an inch of pine bark fines. The end result was over one thousand seedlings emerging early (January) that were not affected by frosts in February. Seedlings were potted, grown and distributed to interested nurseries and university research programs. In our trials, cutting propagation of young seedling trees is feasible because of their juvenile nature. Still, after numerous cutting batches, we have noted a poor
SNA Research Conference Vol. 59 2014

and dry. 1 Sept 2000 was the record high, 112 F (44.4 C), and 23 Dec 1989 was the
record low 0 F (-17.8 C). In 2010 and 2011, Nacogdoches experienced all-time record
drought and heat. Total precipitation in 2010 was 22.3 in (56.6 cm) and 2011 produced
35.4 in (89.9 cm), with one third of that that coming late in the fall. Fortunately, 2012 and
2013 saw a return to normal summer temperatures and rainfall at 59.6 in (151 cm) and
43.4 in (110.2 cm), respectively.

Performance: Growth rate has been excellent. Trees were planted in January 2011.
After three growing seasons, a 24 June 2014 random sample of 32 trees indicates an
average tree height of 17.7 ft (5.4 m) ± 2.3 ft (.7 m). The tallest trees exceed 21 ft (6.4
m) in height and 4.5 in (11.4 cm) in diameter. Diameter at six inches averaged 2.9 in (7.4
cm) ±0.49 in (1.2 cm). This random sampling did not include any replants or damaged
trees. Deer have been a constraint at this site, not through browsing but through bucks
rubbing their racks on young trees. Over the past three years we have replanted 23
trees due to extreme deer damage. In other cases the trees sprouted vigorously below
the damage and a new leader was chosen to restore the tree.

Results: This seedling block includes significant diversity. For instance, we note an 11
day variation from earliest to latest leaf emergence in the spring. There is great variety in
the color of new growth (green, yellow, red, salmon, pink). Fall foliage color has been
brown with leaves held tight into January before falling. However, there is evidence this
species does not characteristically develop good fall color until after flowering. Most trees
are not of good habit with haphazard branches, a tendency to multi-leader, and bad
crotch angles. However, in this seedling block, there’s a variety of forms, including
several fastigiate forms, one dwarf, and others with tighter habit and good shape. We
have cutting propagated twelve selections and will be multiplying others in the next few
years.

Genetic characterization. SFA Gardens is cooperating with Jason Grabosky, Rutgers
University, New Brunswick, New Jersey in a maple characterization study. April Jackson,
PhD candidate, is investigating variation within and among taxa included in the hard
maple group. In particular, she is studying Acer saccharum, Acer nigrum, Acer barbatum,
and Acer leucoderme. Populations of Acer grandidentatum as well as Acer skutchii were
also represented in these studies. April is studying morphological, anatomical, and
physiological traits that may enable species tolerance to water deprivation and increasing
temperatures. She is genotyping germplasm collected over the last three years across
natural ranges of the taxa to determine how genetically similar (or not) these taxa are.
She will use phylogenetic analysis to address taxonomic discrepancies within this group
of taxa and hopes to resolve classification and nomenclature listings. We are also
cooperating with Richard Olsen of the National Arboretum, Beltsville, Maryland, in a
similar project. In 2015, we hope to sample both our research plots and trees known to
have originated from Mexico seed to determine parentage. Finally, our long term goal is
to acquire seed of other provenances in Mexico, and, hopefully, Guatemala, to develop a
documented ex situ collection of this species at SFA Gardens.

                               Plant Breeding and Evaluation                               199
SNA Research Conference Vol. 59 2014
Cooperator observations
Brent Pemberton, Research Scientist, Texas Agrilife Research and Extension Center,
Overton, TX: “We’ve had Acer skutchii in the ground for one full growing season. Looks
good but still a small tree. It did survive all the cold weather this past year including 16oF
on Mar 3 after only being in the ground for one season.”
Paul Cox, San Antonio Botanical Garden, San Antonio, TX (retired): “Acer skutchii at the
SABG has put on the same height growth as Taxodium mucronatum during the first 10
years. It’s fast. Leaves have never scorched but don't have the dramatic fall color
reported from other areas.”
James Spivey, nurseryman, Peerless Nursery, Bigfoot , TX: “Acer skutchii has a great
deal of potential in the tree market for the Central and South Texas. It seems to be very
tolerant of alkaline soil around San Antonio and the Hill Country. It has been very tolerant
of heat and direct sunlight without any burning of the foliage. The growth rate has been 3-
1/2' to 4' per year under irrigation.”
Mike Arnold, Research Scientist, Texas A & M University, College Station, Texas: “Nice
plant in areas without saline soils or irrigation water. We have killed it repeatedly in
multiple locations here due to the salts in the irrigation water. Chlorosis due to alkalinity
does not appear to be nearly as serious as the salts. It develops the classic marginal
necrosis and then dieback and death. It just is intolerant of the salts.” In an earlier
correspondence, Mike reported Acer skutchii had failed to deal with the high salinity
irrigation water in College Station (250 PPM Na and 500 PPM bicarbonates). Whether
irrigated by drip, sprinkler or microsprinklers, plants performed poorly. Leaves were
cupped and took on a bluish cast, and the trees failed to survive in their container trials.
Steve Lowe, Naturalist, Kendall County Park. Boerne, TX: “Acer skutchii is remarkably
well adapted for this area. After visiting these trees in their home range, it is easy to see
their affinity for limestone. They are truly saxicolous. This would explain their tolerance of
our high pH soils, outperforming even our native Bigtooth maples. Skutch maples I’ve
planted in this area have consistently grown 3-4+ feet per year with only moderate
irrigation. As with the Sierran oaks, new growth is extra early here, pink/brown and
sometimes subject to cold damage. Most here attain peak color end of December (citron
to canary yellow to pumpkin). Foliage color and texture (more leathery) seems to change
as tree matures.”
Jim Robbins, University of Arkansas, Little Rock and Hope, Arkansas: “In 2011, twelve
one quart plants were donated by SFA Gardens. One plant died at Little Rock in the first
growing season and a second in year two. Average height at Hope and Little Rock is
11.2 ft (3.4 m) tall with a trunk caliper at 6 in (15.2 cm) of 5 in (12.7 cm). The growth habit
might be a challenge in nursery production since the tree produces extremely vigorous
shoots that require pruning and training. Based on observations at Little Rock (Zone 7),
we’ve observed no dieback during this past harsh winter (9 F) low.”
Plant Breeding and Evaluation 200SNA Research Conference Vol. 59 2014
Eric Hammond, Heritage Seedlings, Inc., Salem, Oregon: “We have one tree in the grow-
out area. It is the only example I know. And though, I know Mark Krautmann is
enthusiastic about this species because of its broadly adapted nature, I will not lie about
our tree. It is hideous in form, growing off at all trajectories like a North Korean rocket
test. Marks in its favor are perfectly clean foliage of great texture, though they are
puckered much more than I prefer, and no twig damage of any sort after a freeze. So in
short I see a tree of little merit for our climate where we have an overabundance of choice
but if it is adapted to the SW market I think it is a plant we can produce successfully.”
Matthew Chappell, University of Georgia Horticulture Department, Athens, GA: “It’s doing
well in GA - no fruit yet but I have it in container and in-ground. Last year was an
establishment year and this year they are jumping out and growing like crazy. We did
have some tip dieback but can’t even tell now (we went to 5.5 F)."
Mike Dirr, Plant Introductions, Inc., Watsonville, Georgia: “I’m not sure I can verify
hardiness but no issues at 6 F; early fall freezes, 22 F two nights running November 13
and 14, 2013; and a late spring freeze April 16, 2014, 29.5 F. I have three in the garden
and all are vigorous (3 ft/year on average) with pretty reddish tinged new shoots. It’s
certainly heat tolerant and a good fall colored selection would be a valuable contribution
to the southern palette of landscape trees. Species needs to be domesticated like sugar
and red maples.”
Tom Cox, Cox Arboretum, Canton, Georgia: “A. skutchii has been a solid performer here
in north Georgia. It takes the heat and humidity without showing any stress and easily
survived 2 F degrees for several days this past January. Leaf retention in the fall is
longer than either A. saccharum, rubrum or nigrum 'Green Column' and it colors up later. I
like this as it extends fall color in the arboretum. During the spring and summer, it is thus
far unremarkable. Its leaf appears pathogen free and is still clean at time of absicission.
The leaf is smaller than anticipated so I’m wondering if my two trees might have some
mixed parentage. I would rate its vigor as moderate, although this might change as it
forms a deep taproot. This suspicion is based on my experience with Acer nigrum which
took several years before it took off and is now a fast grower.”
Mark Weathington, JCR Arboretum, Raleigh, NC: “We have had mixed success. We lost
our oldest plant this winter but it was not a cold issue. That tree had been declining for
years, had some canker issues and just generally never looked very good for as long as
I've known it. We received a plant from you in December 2007 that was 15 in (38 cm)
tall. It was planted spring 2008 and when last accurately measured in 2012 was 20 ft (6.1
m) tall with a 10 ft (3.0 m) spread. It has put on at least 5 ft (1.5 m) since then. It is
growing in a very loose soil that has almost perfect drainage for excess water but still
retains moisture well but leaves lots of air space. It seems to perform best for us in this
type of situation (what doesn't?) but doesn't fare quite as well in very heavy soils where
growth is much slower. We had no winter damage at 7.5 F (-13.6 C) this winter and we
have not had issues in other winters with it leafing out early and getting hit by later frosts.
So far, we haven't had great fall color on any of our trees."
Plant Breeding and Evaluation 201SNA Research Conference Vol. 59 2014
Results and Discussion: Besides conservation of rare maple genetics, there are
horticultural reasons to capitalize on skutch maple traits that might benefit progeny.
Certainly, fast growth rate and drought tolerance is in line with the long term trend facing
the southern USA, a warmer and perhaps drier climate. Alkalinity tolerance may create
opportunities in regions where sugar maples often fail. Certainly, cooperator and our own
observations reveals trees exhibiting negative branching habit, poor form, multi-leaders,
and a training problem for nurserymen. However, there is variety in form and habit; we
have selected a dozen for improved form, new growth color, and height/trunk diameter
characteristics. Those will be planted for further evaluation. Fall color selections are
years away.
Literature Cited
1. Dirr, M. 2009. Manual of Woody Landscape Plants. Stipes Publishing, Champaign, Ill.:
67.
2. Lara-Gomez, G, Gailing, O, Finkeldey, R. 2005. Genetic variation in isolated Mexican
populations of the endemic maple Acer skutchii Rehd. Allgemeine Forst Und
Jagdzeitung 76 (6). Jun-Jul 2005.p.97-103 J D Sauerlanders Verlag, Frankfurt.
3. Efraim Hernandez X, Howard Crum, Wm. B. Fox and A. J. Sharp. 1951. A Unique
Vegetational Area in Tamaulipas. Bulletin of the Torrey Botanical Club Vol. 78, No. 6
(Nov. - Dec., 1951), pp. 458-463.
4. Paul S. Martin and Byron E. Harrell. 1957. The Pleistocene History of Temperate
Biotas in Mexico and Eastern United States. Ecology, Vol. 38, No. 3 (Jul., 1957), pp.
468-480.
5. Rehder, A., 1936. A new species of Acer from Guatemala. Jour. Arnold Arbor 17: 350-
351.
6. Simpson, B. and B. Hipp. 1993. Maples of the southwest. American Nurseryman
177(5): 26-35.
7. Yalma Vargas-Rodriguez and William Platt. 2012. Remnant sugar maple (Acer
saccharum subsp. Skutchii) populations at their range edge: Characteristics,
environmental constraints and conservation implications in tropical America. Biological
Conservation 150: 111-120.
8. Yalma Luisa Vargas-Rodriguez. 2005. Ecology of Disjunct Cloud Forest Sugar Maple
Populations (Acer saccharum ssp. skutchii in North or Central America. PhD
dissertation, Louisiana State University and Agricultural and Mechanical College,
Department of Biological Sciences, Louisiana State University, Baton Rouge, La.
http://etd.lsu.edu/docs/available/etd-07152005-083738/unrestricted/Vargas-
Rodriguez_thesis.pdf.
Plant Breeding and Evaluation 202SNA Research Conference Vol. 59 2014
Figure. 1. Skutch maple plot at the Science Research Center, Stephen F. Austin State
University, Nacogdoches, Texas, June 25, 2014.
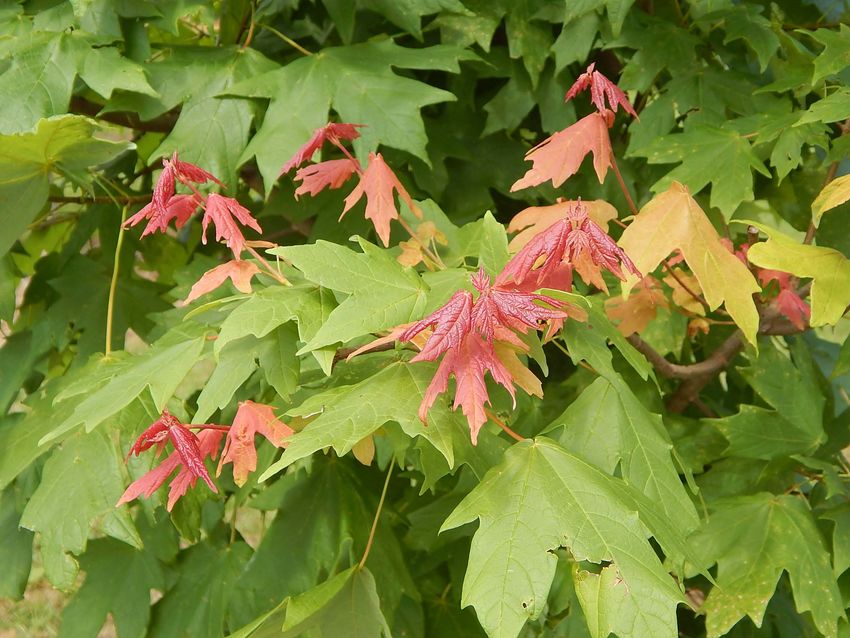
Figure. 2. Skutch maple new growth, 2014
Plant Breeding and Evaluation 203SNA Research Conference Vol. 59 2014
Seedling Variations of Ilex crenata Thunb. ‘Sky Pencil’
Yujie Yang1,2, Donglin Zhang1, Jinying Dong1, and Zhihui Li2
1
Department of Horticulture, University of Georgia, Athens, GA 30602, USA
2
College of Forestry, Central South University of Forestry and Technology
Changsha, Hunan 410004, China
yujie@uga.edu
Index Words breeding, diversity, genetic relationship, holly, open pollination, seedling
population
Significance to Industry: Nursery industry demands new and improved ornamental
plants for the better marketing and gardeners’ interest. Open pollination is one of the best
ways to breed and select new cultivar. Variations from a seedling population are
expected. However, the seedling population from Ilex crenata ‘Sky Pencil’ did not have
any sibling with its mother plant’s narrow upright habit. To investigate the variations of this
small seedling population, both morphological and molecular ISSR data were collected
and analyzed. Seedling variations from an open pollinated mother plant were likely from
different pollen donors (fathers). The conclusion should better help our ornamental plant
breeders for breeding and selecting new cultivars for our nursery industry from open
pollinated populations.
Nature of Work: Ilex crenata Thunb. is a member of holly family (Aquifoliaceae) native to
eastern China, Japan, Korea, Kuril, Sakhalin, Philippines and the Himalayas. It is widely
planted as an ornamental plant in the southeastern US for its dense evergreen foliage
(Dirr, 2009). Many cultivars have been released for commercial production. Generally,
mutation and cross-hybridization are two major ways to get new cultivars. Usually natural
mutation is an accidental event, which could not be controlled. Cross-hybridization
becomes the major source to select new cultivars. In order to explore open pollination, we
studied seedlings variation of Ilex crenata ‘Sky pencil’, which is popular in the landscape
for its strongly fastigiated, thin growth habit and lustrous, dark evergreen leaves (Dirr,
2011).
Inter-simple sequence repeat (ISSR) is a polymerase chain reaction (PCR)-based
technique with primers composed of microsatellite sequences. It is often preferred over
other molecular makers for generating a high number of polymorphism and does not
require prior sequence information (Zietkiewicz et al., 1994). It is thought to be particularly
useful for studying closely related individuals. It has been applied as a useful alternative
to fingerprinting and genetic analysis in ornamental plants, including genetic diversity
(Chezhian et al., 2012; Zhao, 2007), genetical relationships (Hu et al., 2006), origins of
the cultivars (Lombrado et al., 2012), cultivar discrimination (Monte-Corvo et al., 2001)
and fingerprinting of plants (Liu et al., 2012). In particular, ISSR marker was applied to
Plant Breeding and Evaluation 204SNA Research Conference Vol. 59 2014
evaluate the genetic diversity of Ilex integra (Leng et al., 2005) and the relationship of Ilex
plants (Zhou et al., 2009). In this study, ISSR was applied to evaluate genetic diversity of
Ilex crenata ‘Sky Pencil’ seedlings.
A total of 37 plants were collected in this study. Among them, 36 seedlings were from
open pollination from one Ilex crenata ‘Sky Pencil’ mother tree and cultivated at the
Horticulture Farm at the University of Georgia (Athens, GA) by Dr. Michael A. Dirr in
2006.
Total genomic DNA was isolated from young leaves using the DNeasy® Plant Mini Kit
(QIAGEN Inc., Valencia, CA) following manufacturer’s protocols. DNA concentrations
were measured using a Nanodrop Lite Spectrophotometer (Wilmington, DE) and DNA
samples were diluted to a concentration of 10 ng/µL with double distilled water (DDW) for
downstream applications.
ISSR primers were obtained from the University of British Columbia (UBC 801-900). Out
of 100 primers, sixteen ISSR primers were used for screening and exhibiting genetic
variation among all accessions. PCR reaction was performed in a total volume of 20 µl in
a nexus gradient mastercycler (Eppendorf AG, Hamburg, Germany). The reaction mixture
included: 10µl Master Mix (Applied Biosysterms, Foster city, CA), 1.2µl primer (12µM),
1.0µl template DNA (0.5ng/µl), 7.8µl DDW. ISSR-PCR amplification procedure included
initial denaturation at 94⁰C for 5 min followed by 35 successive cycles of denaturation at
94⁰C for 30s, annealing at 54⁰C for 45s, extension at 72⁰C for 90s. Final extension was
performed for 7 min at 72⁰C and then held at 4⁰C. After PCR operation, amplified
products were checked by separating on 1.2% agarose gel electrophoresis (with 0.5mg/L
ethidium bromide) for 1h at a constant temperature of 120V with 0.5×TBE buffer solution
and 100 base pairs (bp) DNA ladder. Gels were visualized via ultra-violet light,
photographed, and documented.
Gel image were analyzed using the DNA marker ladder for fragment length calibration.
Only the clear bands were scored and the faint bands were ignored. The same size band
for a data set was assumed to represent a single locus. For presence or absence of an
ISSR band at a particular locus, the data were recorded as 1 for presence and 0 for
absence to build binary matrices. The matrix of ‘01’ was analyzed using PAUP (Swofford,
2002) and POPGENE (Yeh et al., 1999).
Results and Discussion: Sixteen inter-simple sequence repeat primers were used to
study the genetic variations of Ilex crenata. The primer information, the number of bands,
number of polymorphic bands and percentage of polymorphism were presented in Table
2. The highest number of fragments (22 fragments/bands) was amplified with the
(AG)8YC primer (UBC835), while the lowest number (11) was amplified with (GGGTG)3
primer (UBC881). The average number of fragments per primer was 15.1. A total of 242
fragments were generated and the fragment size amplified with all 16 primers was similar
and ranged from 150-2000 bp. Out of the 242 loci surveyed, 167 were polymorphic
(69%). Percentage of polymorphism for primer UBC856 was highest at 85.7% while
Plant Breeding and Evaluation 205You can also read