Loss of Kat2a enhances transcriptional noise and depletes acute myeloid leukemia stem-like cells - eLife
←
→
Page content transcription
If your browser does not render page correctly, please read the page content below
RESEARCH ARTICLE

                                     Loss of Kat2a enhances transcriptional
                                     noise and depletes acute myeloid
                                     leukemia stem-like cells
                                     Ana Filipa Domingues1†‡§, Rashmi Kulkarni1†#, George Giotopoulos2,3,
                                     Shikha Gupta1,4, Laura Vinnenberg1, Liliana Arede1,4, Elena Foerner1,
                                     Mitra Khalili1,5, Rita Romano Adao1, Ayona Johns6, Shengjiang Tan2, Keti Zeka1,4,
                                     Brian J Huntly2,3, Sudhakaran Prabakaran4,7, Cristina Pina4,6*
                                     1
                                       Department of Haematology, University of Cambridge, NHS-BT Blood Donor
                                     Centre, Cambridge, United Kingdom; 2Department of Haematology, University of
                                     Cambridge, Cambridge Institute for Medical Research, Cambridge, United
                                     Kingdom; 3Wellcome Trust-Medical Research Council Cambridge Stem Cell
                                     Institute, Cambridge, United Kingdom; 4Department of Genetics, University of
*For correspondence:                 Cambridge, Cambridge, United Kingdom; 5Department of Medical Genetics and
cp533@cam.ac.uk;                     Molecular Medicine, School of Medicine, Zanjan University of Medical Sciences
cristina.pina@brunel.ac.uk           (ZUMS), Zanjan, Islamic Republic of Iran; 6Division of Biosciences, College of Health
†
 These authors contributed           and Life Sciences, Brunel University London, Uxbridge, United Kingdom;
                                     7
equally to this work                   Department of Biology, IISER, Pune, India
Present address:
‡
  Haematological Cancer
Genetics, Wellcome Trust Sanger
Institute, Cambridge, United         Abstract Acute Myeloid Leukemia (AML) is an aggressive hematological malignancy with
Kingdom; §Wellcome Trust-            abnormal progenitor self-renewal and defective white blood cell differentiation. Its pathogenesis
Medical Research Council             comprises subversion of transcriptional regulation, through mutation and by hijacking normal
Cambridge Stem Cell Institute,       chromatin regulation. Kat2a is a histone acetyltransferase central to promoter activity, that we
Cambridge, United Kingdom;           recently associated with stability of pluripotency networks, and identified as a genetic vulnerability
#
  Department of Biochemistry,        in AML. Through combined chromatin profiling and single-cell transcriptomics of a conditional
University of Cambridge,             knockout mouse, we demonstrate that Kat2a contributes to leukemia propagation through
Cambridge, United Kingdom            preservation of leukemia stem-like cells. Kat2a loss impacts transcription factor binding and
Competing interests: The             reduces transcriptional burst frequency in a subset of gene promoters, generating enhanced
authors declare that no              variability of transcript levels. Destabilization of target programs shifts leukemia cell fate out of
competing interests exist.           self-renewal into differentiation. We propose that control of transcriptional variability is central to
Funding: See page 24                 leukemia stem-like cell propagation, and establish a paradigm exploitable in different tumors and
                                     distinct stages of cancer evolution.
Received: 09 September 2019
Accepted: 24 January 2020
Published: 27 January 2020

Reviewing editor: Jian Xu,
University of Texas Southwestern
                                     Introduction
Medical Center, United States        Acute Myeloid Leukemia (AML) is the most prevalent leukemia in adults with a dismal prognosis of
                                     less than 30% 5 year survival (Döhner et al., 2017). It is a heterogeneous disease, clinically and path-
   Copyright Domingues et al.
                                     ologically, with common cellular themes of myeloid differentiation block, and recurrent molecular
This article is distributed under
                                     targeting of chromatin and transcriptional regulators. Effects on chromatin and transcription are
the terms of the Creative
Commons Attribution License,         reflected in the AML mutational spectrum (Ley et al., 2013), as well as through the implication of
which permits unrestricted use       general chromatin regulators in AML pathogenesis, in the absence of specific mutation events
and redistribution provided that     (Roe and Vakoc, 2013). Specific examples of AML dependence on unmutated chromatin regulators
the original author and source are   include BRD4 (Dawson et al., 2011; Zuber et al., 2011), LSD1 (Harris et al., 2012) or DOT1L
credited.                            (Bernt et al., 2011; Daigle et al., 2011), their importance highlighted by the fact that chemical

Domingues et al. eLife 2020;9:e51754. DOI: https://doi.org/10.7554/eLife.51754                                                         1 of 29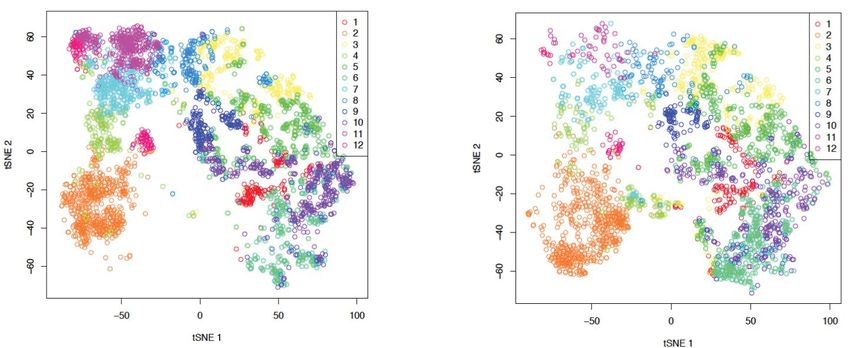
Research article                                                             Cancer Biology Chromosomes and Gene Expression

                                   eLife digest Less than 30% of patients with acute myeloid leukaemia – an aggressive cancer of
                                   the white blood cells – survive five years post-diagnosis. This disease disrupts the maturation of
                                   white blood cells, resulting in the accumulation of immature cells that multiply and survive but are
                                   incapable of completing their maturation process. Amongst these, a group of cancer cells known as
                                   leukemic stem cells is responsible for continually replenishing the leukaemia, thus perpetuating its
                                   growth.
                                       Cancers develop when cells in the body acquire changes or mutations to their genetic makeup.
                                   The mutations that lead to acute myeloid leukaemia often affect the activity of genes known as
                                   epigenetic regulators. These genes regulate which proteins and other molecules cells make by
                                   controlling the way in which cells ‘read’ their genetic instructions.
                                       The epigenetic regulator Kat2a is thought to ‘tune’ the frequency at which cells read their genetic
                                   instructions. This tuning mechanism decreases random fluctuations in the execution of the
                                   instructions cells receive to make proteins and other molecules. In turn, this helps to ensure that
                                   individual cells of the same type behave in a similar way, for example by keeping leukaemia cells in
                                   an immature state. Here, Domingues, Kulkarni et al. investigated whether interfering with Kat2a can
                                   make acute myeloid leukaemia less aggressive by allowing the immature white blood cells to
                                   mature.
                                       Domingues, Kulkarni et al. genetically engineered mice to remove Kat2a from blood cells on
                                   demand and then inserted a mutation that causes acute myeloid leukaemia. The experiments
                                   showed that the loss of Kat2a delayed the development of leukaemia in the mice and progressively
                                   depleted leukaemia stem cells, causing the disease to become less aggressive. The results also
                                   showed that loss of Kat2a caused more fluctuations in how the white blood cells read their genetic
                                   code, which resulted in more variability in the molecules they produced and increased the tendency
                                   of the cells to mature.
                                       These findings establish that loss of Kat2a causes leukaemia stem cells to mature and stop
                                   multiplying by untuning the frequency at which the cells read their genetic instructions. In the future,
                                   it may be possible to develop drugs that target human KAT2A to treat acute myeloid leukaemia.

                                   inhibitors developed to target these regulators have progressed to clinical trials (Gallipoli et al.,
                                   2015). More recently, TAF12, a component of the basal transcription factor complex TFIID, was
                                   shown to be critical for AML cell maintenance through regulation of protein stability and activity of
                                   the transcription factor MYB (Xu et al., 2018).
                                       In a recent CRISPR drop-out screen of genetic dependencies in AML, we have identified several
                                   members of the promoter-bound histone acetyl-transferase SAGA complex, including acetyl-trans-
                                   ferase KAT2A, as being required for AML maintenance (Tzelepis et al., 2016). KAT2A was sug-
                                   gested to impact cell survival and differentiation status, but its precise molecular mechanisms of
                                   action remain to be elucidated, and it is unclear whether it is required in AML initiation, as well as
                                   maintenance. Kat2a is a mammalian orthologue of yeast histone acetyl-transferase Gcn5, and is
                                   required for H3K9 acetylation (H3K9ac) (Jin et al., 2014), a modification that fine-tunes, rather than
                                   initiates, locus-specific transcriptional activity. Kat2a is required for specification of mesodermal
                                   derivatives during early embryonic development (Lin et al., 2007; Wang et al., 2018), and for sur-
                                   vival of neural stem and progenitor cells (Martı́nez-Cerdeño et al., 2012). Loss of Kat2a in the
                                   hematopoietic system from an early developmental stage did not grossly impact blood formation in
                                   vivo, but could promote terminal granulocyte differentiation in vitro, through relief of protein acety-
                                   lation-dependent inactivation of transcription factor Cebpa (Bararia et al., 2016). Nevertheless,
                                   detailed testing of Kat2a contribution to hematopoietic stem and progenitor cell function is still
                                   lacking.
                                       Yeast Gcn5 is a classical regulator of transcriptional noise (Raser and O’Shea, 2004), with dele-
                                   tion mutants enhancing cell-to-cell variability in gene expression measured across a range of locus
                                   fluorescence reporters (Weinberger et al., 2012). Transcriptional noise reflects the variability in the
                                   number of mRNA molecules produced from a given locus through time; snapshot studies of gene
                                   expression capture the same phenomenon as cell-to-cell transcriptional heterogeneity

Domingues et al. eLife 2020;9:e51754. DOI: https://doi.org/10.7554/eLife.51754                                                      2 of 29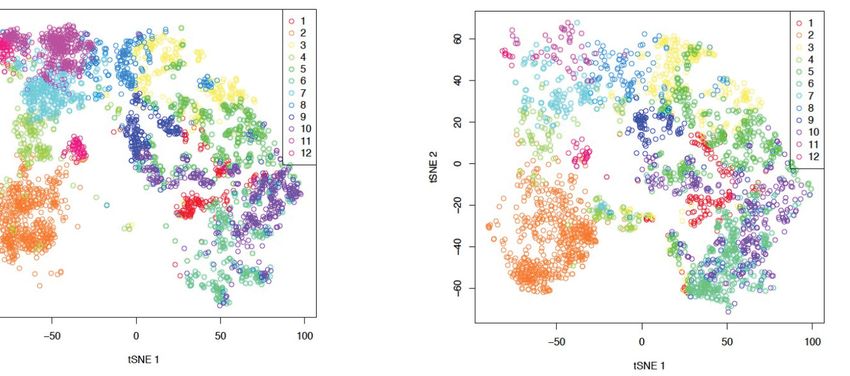
Research article                                                              Cancer Biology Chromosomes and Gene Expression

                                   (Sanchez et al., 2013). Transcriptional noise can result from the bursting nature of gene expression
                                   (Chubb and Liverpool, 2010). Most if not all loci, undergo bursts of transcriptional activity with char-
                                   acteristic frequency and size: burst frequency corresponds to the rate at which promoters become
                                   engaged in active transcription; burst size measures the number of mRNA molecules produced dur-
                                   ing each transcriptional burst (Cai et al., 2006). Both parameters contribute to mean gene expres-
                                   sion, whereas transcriptional noise is more strictly dependent and shown to be anti-correlated with
                                   burst frequency (Hornung et al., 2012). In yeast, size and frequency of bursts are increased through
                                   histone acetylation of gene bodies and promoters, respectively (Weinberger et al., 2012).
                                      In functional terms, transcriptional noise has been directly implicated as a mechanism of cell fate
                                   choice in yeast (Blake et al., 2006) and bacteria (Süel et al., 2006), and recurrently associated, albeit
                                   correlatively, with cell fate transitions in some mammalian systems (Moris et al., 2016). We had pre-
                                   viously shown that normal transitions into hematopoietic lineage specification associate with cell-to-
                                   cell transcriptional heterogeneity (Pina et al., 2012; Teles et al., 2013). More recently, we have
                                   inhibited the activity of Kat2a in mouse embryonic stem cells, and observed an increase in transcrip-
                                   tional heterogeneity that impacted the stability of pluripotency with rewiring of correlation gene reg-
                                   ulatory networks (GRNs) (Moris et al., 2018). Whilst we have not mechanistically linked enhanced
                                   heterogeneity with loss of pluripotency, we did observe propagation of variability of transcriptional
                                   levels through the GRNs, downstream of nodes with differential H3K9ac.
                                      Cancer, and in particular leukemia, can be perceived as a pathogenic imbalance of cell fate
                                   choices, with maintained self-renewal and reduced exit into differentiation. We postulated that
                                   enhancing transcriptional variability in AML cells, as may be achieved through Kat2a depletion,
                                   would enhance the probability of differentiation cell fate transitions. By using a retroviral-delivered
                                   MLL-AF9 model of AML in a conditional Kat2a knockout background, we show that loss of Kat2a
                                   depletes AML stem-like cells, imposing a mild delay to disease initiation and severely impairing AML
                                   propagation. At a molecular level, these changes are accompanied by specific loss of H3K9 acetyla-
                                   tion at a subset of promoters, with reduced transcription factor binding and frequency of bursting,
                                   and associated variability in transcriptional levels. Affected loci encode for general mitochondria and
                                   nucleic acid metabolism, including translation, suggesting that they may contribute to cancer fate
                                   decisions more generally, rather than in a disease-specific manner.

                                   Results
                                   Inducible loss of Kat2a in adult mouse hematopoiesis
                                   In order to investigate the impact of Kat2a loss on self-renewal vs. differentiation of AML stem-like
                                   cells (AML-SC), we generated an inducible conditional Kat2aFl/Fl KO mouse model and transformed
                                   Kat2a excised (KO) and non-excised (WT) bone marrow (BM) cells through retroviral delivery of an
                                   MLL-AF9 fusion transcript. This strategy allows for cellular and molecular investigation of Kat2a
                                   requirements during transformation, whilst minimizing putative confounding effects of acquired
                                   mutations on heterogeneity of transcription, such as might be observed in established human or
                                   mouse AML. The choice of a strong oncogenic event such as MLL-AF9 (Ley et al., 2013;
                                   Krivtsov et al., 2006; Somervaille and Cleary, 2006) minimizes the need for cooperating genetic
                                   alterations. Similarly, the option for an inducible conditional knockout may reduce compensatory
                                   effects against Kat2a loss. Specifically, we crossed Kat2aFl/Fl C57Bl/6 mice (Lin et al., 2008) on the
                                   interferon response-inducible Mx1-Cre+/- background, and generated a stable mouse line homozy-
                                   gous for the Flox allele. Mx1-Cre-positive (KO) and Mx1-Cre-negative (WT) mice were compared
                                   across all experiments (Figure 1—figure supplement 1A), with locus excision obtained through
                                   treatment of experimental and control mice with intra-peritoneal polyinosylic-polycytidylic (pIpC)
                                   acid (Chan et al., 2011). Excision was tested 4–6 weeks after injection and consistently achieved val-
                                   ues greater than 80% in stem and progenitor cell compartments (Figure 1—figure supplement 1B),
                                   reflected in a profound loss of gene expression, including amongst myeloid-biased (LMPP) and com-
                                   mitted (GMP) progenitors critical for AML initiation (Goardon et al., 2011; Figure 1—figure supple-
                                   ment 1C). Locus excision generates an in-frame product joining the first two and the last exons and
                                   is transcribed (Figure 1—figure supplement 1D) but does not code for acetyl-transferase activity or
                                   other functional domains (Figure 1—figure supplement 1A). Kat2a was dispensable for normal
                                   mouse hematopoiesis, with minimal transient effects on the number (Figure 1—figure supplement

Domingues et al. eLife 2020;9:e51754. DOI: https://doi.org/10.7554/eLife.51754                                                        3 of 29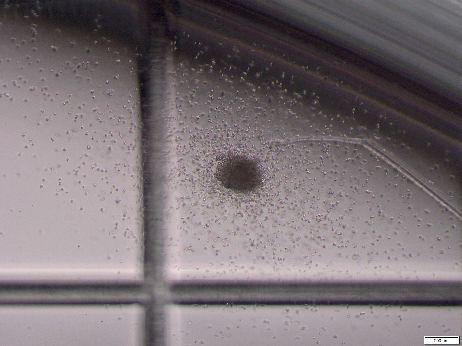
Research article                                                             Cancer Biology Chromosomes and Gene Expression

                                   1E) and in vitro activity (Figure 1—figure supplement 1F) of KO hematopoietic stem cells (HSC).
                                   These effects were not sustained through aging (Figure 1—figure supplement 1G), and, crucially,
                                   did not affect HSC function in vivo, measured by long-term reconstitution of irradiated recipients
                                   through transplantation (Figure 1—figure supplement 1H).

                                   Kat2a loss impairs establishment of MLL-AF9 leukemia
                                   Having verified that Kat2a deletion does not perturb normal hematopoiesis and thus preserves can-
                                   didate progenitor cells-of-origin for leukemia transformation, we used a retroviral delivery system to
                                   express the MLL-AF9 leukemia fusion in progenitor-enriched, lineage-depleted (Lin-) WT and KO BM
                                   cells. Cells were transformed in vitro through serial re-plating in semi-solid medium-based colony-
                                   forming assays, with similar efficiency for both genotypes (Figure 1A). Importantly, the level of locus
                                   excision was mildly increased during transformation (Figure 1B), indicating that loss of Kat2a does
                                   not impede the initial selection of leukemia-transformed clones. Continued re-plating revealed that
                                   Kat2a KO affected the type of colonies produced, with a shift from compact or type I
                                   (Johnson et al., 2003) colonies (Figure 1C–D) with Kit+ progenitor-like cells (Figure 1E and Fig-
                                   ure 1—figure supplement 2A–B), to mixed, or type II (Johnson et al., 2003) colonies (Figure 1F),
                                   with a characteristic halo (Figure 1G and Figure 1—figure supplement 2C) of more differentiated
                                   cells and a corresponding reduction in Kit-positive cells, which have higher levels of the differentia-
                                   tion marker Mac1/CD11b (Figure 1H and Figure 1—figure supplement 2D). Compatible with the
                                   serial re-plating experiments, cell lines established from MLL-AF9-transformed cell lines of both
                                   Kat2a WT and KO genotypes exhibited a relative gain in mixed colonies (Figure 1—figure supple-
                                   ment 2E), with higher levels of Mac1 (Figure 1—figure supplement 2F). Taken together, the data
                                   suggest that Kat2a loss is permissive to MLL-AF9-driven transformation, but alters the balance
                                   between in vitro self-renewal and differentiation, favoring the latter. We tested these observations in
                                   vivo by monitoring leukemia development in mice that received WT and KO Lin- BM cells transduced
                                   for 2 days with retrovirus encoding the MLL-AF9 oncogenic fusion. Kat2a KO recipient animals had a
                                   moderate advantage in survival (Figure 2A), suggesting a protracted development of leukemia. Leu-
                                   kemias were nevertheless depleted of Kat2a expression (Figure 2B), thus excluding selection of
                                   escapee cells. WT and KO leukemic animals had similar disease burdens at the point of culling, as
                                   measured by organ infiltration (Figure 2—figure supplement 1A) and peripheral blood counts (Fig-
                                   ure 2—figure supplement 1B). In contrast with in vitro transformation, we did not observe gross
                                   changes to the balance between progenitor and differentiated cells in the resulting WT vs KO leuke-
                                   mias, which had preservation of phenotypic leukemia stem-like cells (LSC), defined by the Lin-Kit
                                   +Sca1-CD34+CD16/32+ GMP surface phenotype (L-GMP) (Figure 2C). We reckoned that loss of
                                   Kat2a affected the probability of leukemia development through dysregulation of transformed cells,
                                   and sought to probe this hypothesis by investigating the transcriptional programs of WT and KO leu-
                                   kemias at the single-cell level.

                                   Kat2a KO leukemias have increased transcriptional variability
                                   To this end, we pooled samples from 4 to 5 primary leukemias of each genotype, sorted live GFP+
                                   cells reporting the presence of the MLL-AF9 fusion, and successfully sequenced over 4000 cells
                                   Kat2a WT and KO cells each, for a total of 13166 transcripts, using a high-throughput 10X Genomics
                                   platform (Zheng et al., 2017). Basic measures of gene alignment and quality control are summarized
                                   in Supplementary file 1. In order to minimize the confounding effect of rarely or very low expression
                                   genes, we filtered out transcripts detected in less than 10% of all cells, and only included cells where
                                   a minimum of 500 different transcripts were detected. These filtering criteria match those recently
                                   used in analysis of heterogeneity of hematological malignancies using a similar 10X Genomics plat-
                                   form (Pastore et al., 2019) and were deliberately chosen for reproducibility. We thus focused the
                                   analysis on what we designated Robust gene set. These were a total of 2588 genes
                                   (Supplementary file 2), sampled from 7360 cells (3835 WT, 3525 KO), which captured general meta-
                                   bolic, biosynthetic and regulatory ontologies, as well as hematopoietic-specific categories,
                                   for example ‘myeloid cell differentiation’, indicating broad representation of transcriptional pro-
                                   grams within the dataset (Supplementary file 3). We assessed gene expression using the D3E algo-
                                   rithm (Delmans and Hemberg, 2016), which makes implicit use of the single-cell nature of the data
                                   to extract information about differential dynamics of transcription, in addition to determining

Domingues et al. eLife 2020;9:e51754. DOI: https://doi.org/10.7554/eLife.51754                                                      4 of 29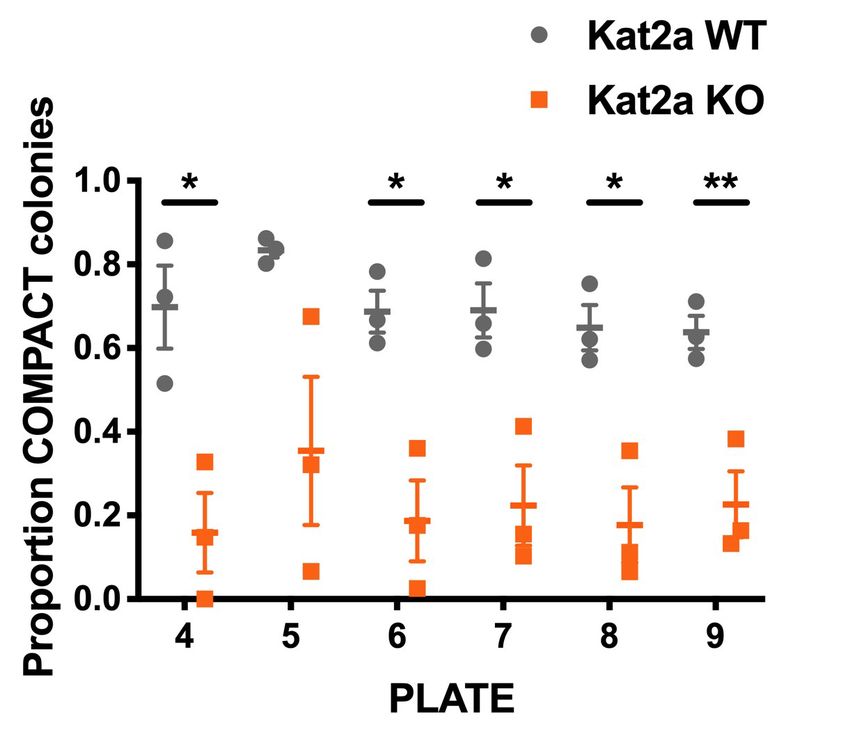
Research article                                                                   Cancer Biology Chromosomes and Gene Expression

    A                                                            B

    C                                                            D                                           E

    F                                                            G                                           H

Figure 1. Conditional knockout of Kat2a promotes differentiation of MLL-AF9-transformed cells in vitro. (A) Serial re-plating of colony-forming cell
(CFC) assays of MLL-AF9 transformed cells, mean ± SEM, n = 3. (B) Excision efficiency was evaluated by qPCR during re-plating of MLL-AF9
transformed cells, mean ± SEM, n = 2–3, *p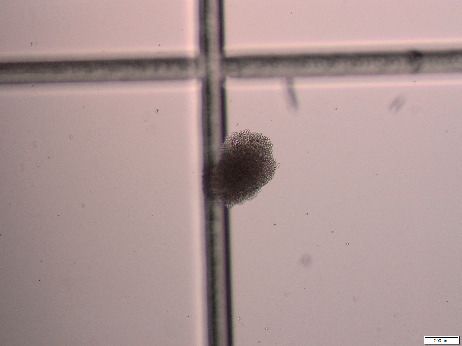
Research article Cancer Biology Chromosomes and Gene Expression
Figure 1 continued
Figure supplement 1. Loss of Kat2a does not affect normal hematopoiesis.
Figure supplement 1—source data 1. Colony-forming assays of Kat2a WT and KO stem and progenitor cells.
Figure supplement 2. Loss of Kat2a promotes differentiation of MLL-AF9 leukemia cells in vitro.
Figure supplement 2—source data 1. Differential colony counts from liquid cultures of MLL-AF9 transformed Kat2a WT and KO cells.
changes in average gene expression. The algorithm views single-cell measurements as multiple
observations of the same or closely-related cells and fits a two-state promoter model that interprets
gene expression measurements in terms of frequency and size of bursts of promoter activity (Fig-
ure 3—figure supplement 1A). We used a multiple linear regression model to verify the contribu-
tion of burst size and frequency to average gene expression and gene expression CV in our single-
cell RNA-seq data (Figure 3—figure supplement 1B). In line with other studies (Hornung et al.,
2012), we observed that both bursting parameters contributed to mean expression to similar
extents, but there was a greater contribution of burst frequency to CV. Differential gene expression
analysis between Kat2a WT and KO primary leukemic cells revealed mild albeit significant changes in
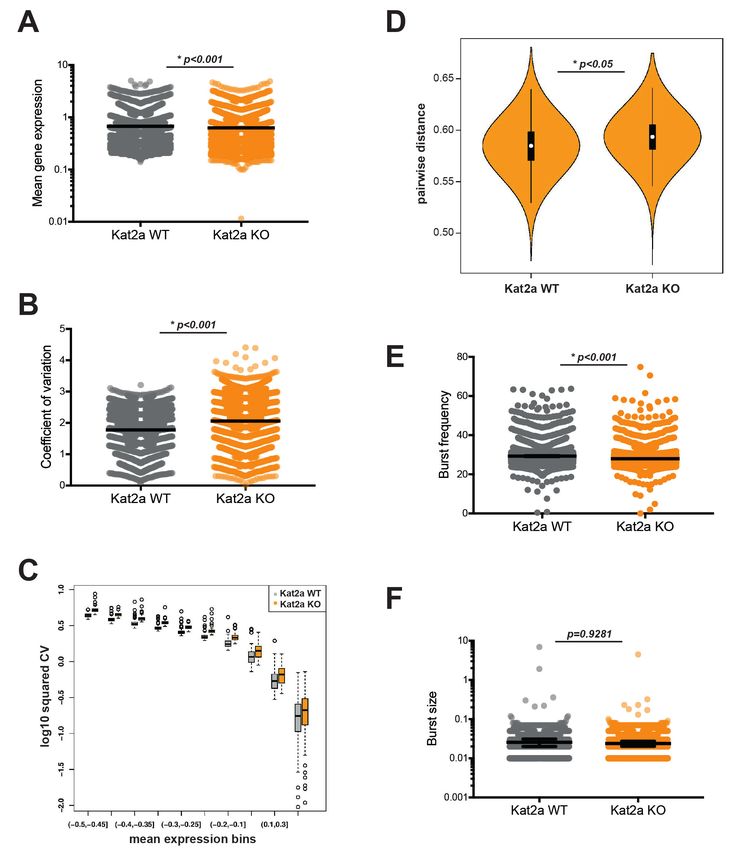
average gene expression (Figure 3A; median difference 0.03), which were of down-regulation
upon Kat2a excision, as might be anticipated from loss of a histone acetyl-transferase. Compatible
with the proposed role of Kat2a in regulating transcriptional noise, we observed a significant
increase in gene expression variability as measured by coefficient of variation (CV = standard devia-
tion/mean) (Figure 3B; median difference 0.24) in Kat2a KO cells which was apparent at all levels of
gene expression (Figure 3C). The increase in gene expression CV associates with greater cell-to-cell
dispersion (Mohammed et al., 2017), in other words reduced cell-to-cell correlation in transcript lev-
els, amongst Kat2a KO leukemia cells (Figure 3D). The increased dispersion of transcriptional vari-
ability can be attributable to a change in burst frequency (Figure 3E; median difference 1.15), but
not burst size (Figure 3F). This has also been observed for the Kat2a yeast orthologue Gcn5 in mod-
ulating transcriptional noise (Weinberger et al., 2012).
Increased transcriptional variability associates with loss of Kat2a KO
leukemia stem-like cells
There have been several reports (Mohammed et al., 2017; Antolović et al., 2017; Blake et al.,
2006; Chambers et al., 2007; Chang et al., 2008; Reynolds et al., 2012), including our own
(Pina et al., 2012), that suggest an association between variability in gene expression and probabil-
ity of cell fate change, although most of the data remains correlative, at least in mammalian systems.
Our recent analysis of Kat2a inhibition in mouse ES cells (Moris et al., 2018) is compatible with this
view, suggesting that the observed enhanced transcriptional variability may promote exit from pluri-
potency through disruption of gene regulatory networks. In this light, we asked if its enhancement in
Kat2a KO leukemias resulted in an imbalance of self-renewal vs differentiation states that could lead
to the observed delay in leukemia progression (Figure 2A). We made use of the RACE-ID algorithm
(Grün et al., 2016) to cluster the combined 7360 WT and KO cells filtered as displaying Robust
gene expression, and optimally separated them into 12 clusters on the basis of the 500 most highly
variable genes in each genotype (Figure 4A). Despite the occupancy of a broadly similar transcrip-
tional space, the genotypes had differential cluster-association patterns, with some clusters, namely
7, 11 and 12, which together comprise 22.9% of WT cells, being relatively underrepresented
amongst Kat2a KO cells (respectively 0.5, 0.2 and 0.5 of Kat2a WT) (Figure 4—figure supplement
1A). Other clusters were over-represented amongst Kat2a KO cells but to a lesser extent, with only
2 over 1.5-fold (cluster 4–1.7-fold, 3.3% of WT cells; cluster 6–1.5-fold, 8.5% of WT cells), causing us
to focus on the Kat2a KO-depleted clusters. Unsupervised alignment of the 12 clusters along a puta-
tive differentiation trajectory, shows that the underrepresented clusters lie at its undifferentiated
end (Figure 4B). This is enriched for gene expression signatures associated with MLL self-renewal
(Figure 4—figure supplement 1B), suggesting a depletion of cells with stem-like characteristics.
Overall, gene expression programs at the start of the trajectory were similar between clusters 2, 4
and 7, with few genes unique to individual clusters thus preventing exploration of gene ontologies.
There were nevertheless subtle differences in the functional categories enriched amongst differen-
tially expressed genes between genotypes in each of the clusters, namely an association of
Domingues et al. eLife 2020;9:e51754. DOI: https://doi.org/10.7554/eLife.51754 6 of 29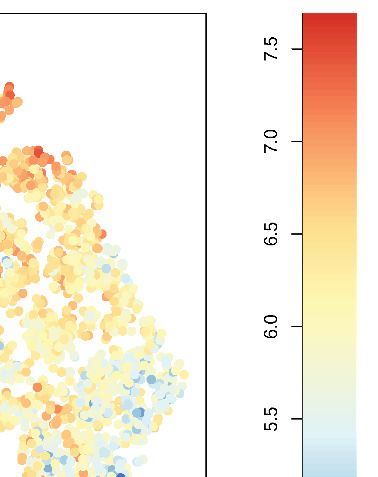
Research article Cancer Biology Chromosomes and Gene Expression
categories associated with apoptosis in clusters 2
and 4, which were absent from cluster 7
A (Supplementary file 4). The STEM-ID algorithm
builds on RACE-ID to define a ‘stemness’ score
that has successfully identified previously elusive
stem cell populations in mouse pancreas
p=0.05 (Grün et al., 2016) and cellular hierarchies in
human liver (Aizarani et al., 2019). It postulates
that stem cells exhibit a multitude of incipient
lineage-affiliated programs (high information
entropy), which are shared (high connectivity)
with more differentiated cells, and attributes a
‘stemness’ score to each cluster as the product of
entropy and number of links (Figure 4—figure
B supplement 1C). Indeed, cluster seven scores as
the most stem-like transcriptional state, suggest-
ing that Kat2a KO leukemias may be depleted of
functional, if not surface phenotype (Figure 2C),
LSC. We tested this by pooling equal numbers of
cells from all primary WT or all primary KO leuke-
mias in Figure 2A, and transplanting them into
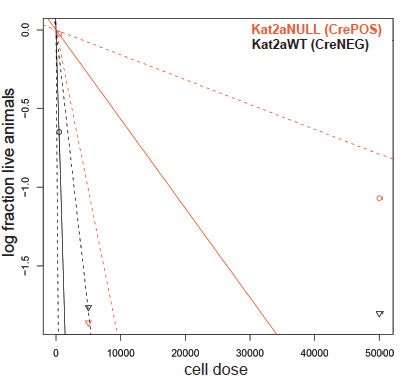
secondary recipients at limiting cell doses.
Despite the equivalent number of phenotypic
LSC in the primary leukemias of both genotypes
(Figure 2C), recipients of Kat2a KO leukemia cells
failed to develop leukemia at the lowest cell
C doses and had a dramatically reduced frequency
of functional LSC (Figure 4C–D), indicating that a
requirement for Kat2a in leukemia self-renewal
and/or propagation. Significantly, the level of
Kat2a gene expression knockout was profound
and retained in secondary leukemias, similar to
the primary leukemias they originated from (Fig-
ure 4—figure supplement 1D). In agreement,
the frequency of Kat2a KO cells escaping the
excision was negligible amongst phenotypically
undifferentiated Lin-Kit+Sca1-CD16/32+ cells
(Figure 4—figure supplement 1E). This confir-
Figure 2. Kat2a loss impairs establishment of MLL-AF9 mation of a maintained and profound gene
leukemia in vivo. (A) Survival curve of animals expression knockout with minimum contribution
transplanted with MLL-AF9 transformed Kat2a WT or from undeleted cells is particularly important, as
KO cells. N = 5 animals/genotype; log rank test, the persistence of a rearranged transcript fusing
p=0.05. (B) Relative expression (quantitative RT-PCR) of exons 1, 2 and 18 (Figure 1—figure supplement
Kat2a in MLL-AF9 primary leukemia BM cells from 1D) prevents knockout quantification in the 3’-
Kat2a WT and KO backgrounds, mean ± SEM, n = 3,
biased 10X Genomics platform. In contrast, the
**p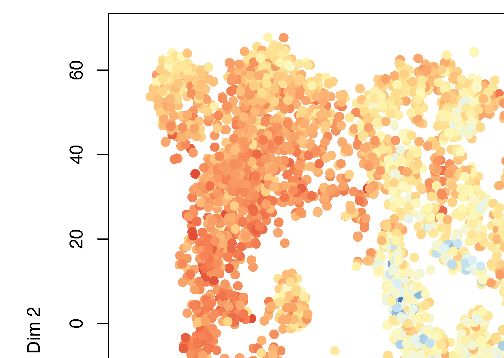
Research article                                                                  Cancer Biology Chromosomes and Gene Expression

Figure 3. Loss of Kat2a increases transcriptional heterogeneity of primary MLL-AF9 leukemias. (A) Mean gene expression levels in Kat2a WT and KO
primary leukemia cells. Median and 95% CI of mean gene expression levels for the 2588 genes in the Robust gene set, across 7360 cells Kolmogorov-
Smirnov (KS) non-parametric test, p-value
Research article                                                                    Cancer Biology Chromosomes and Gene Expression

Figure 3 continued
described (Mohammed et al., 2017). Welch t-test for comparison of means *p-value
Research article Cancer Biology Chromosomes and Gene Expression
A Kat2a WT Kat2a KO B
#links entropy
C D
Kat2a WT
Kat2a KO
*p=0.02
p=0.1
p=0.26
E
Confidence intervals for 1/(stem cell frequency)
Group Lower Estimate Upper
Kat2a WT 2791 714 183
Kat2a KO 63312 17636 4913
Overall test for differences in stem cell frequencies
between any of the group
Chisq DF P value
13.6 1 0.000228
Figure 4. Kat2a loss depletes functional MLL-AF9 leukemia stem-like cells. (A) t-SNE plot of single-cell RNA-seq data for Kat2a WT (left) and KO (right)
primary leukemic cells. RACE-ID K-means clustering was used to classify cells from Kat2a WT and KO primary leukemias in combination, on the basis of
the expression of the most highly variable genes from each genotype as defined in Figure 2D. Clusters are color-coded and cells of each genotype
were displayed separately for easier appreciation of their non-overlapping transcriptional spaces. (B) STEM-ID trajectory plot of analysis in (A)
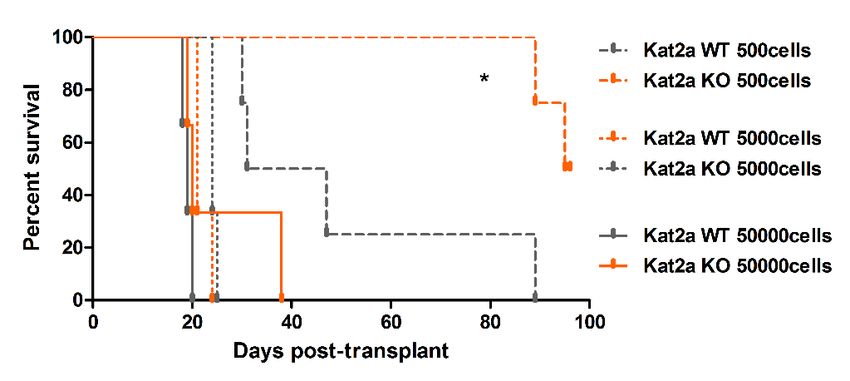
representing combined measures of information entropy and cluster connectivity strength; clusters as in (A). (C) Extreme Limiting Dilution Analysis
(ELDA Hu and Smyth, 2009) of leukemia-initiating cell frequency in Kat2a WT and KO primary leukemias. Primary leukemias of each genotype were
pooled (WT-5; KO-4) and transplanted as 50K, 5K and 500 cell doses into 3–4 animals/dose group. (D) Survival curve of secondary recipients of MLL-
AF9 leukemic cells from Kat2a WT and KO backgrounds; data as in (C). Log rank test for difference in survival, n = 3–4/per dose group. 50 K cells
p=0.26, 5 K cells p=0.1, 500 cells p=0.02. (E) Flow cytometry analysis of BM cells from secondary Kat2a WT and KO leukemia transplant recipients (50K
and 5 K cells). Cell compartments as in Figure 2C; n = 6; mean ± SEM, 2-tailed t-test, **pResearch article Cancer Biology Chromosomes and Gene Expression
A B
Kat2a WT Kat2a KO
C ****pResearch article Cancer Biology Chromosomes and Gene Expression Figure 5 continued calculated by D3E with 2585 genes called differential. Mann-Whitney non-parametric test for comparison of rank medians; p
Research article                                                               Cancer Biology Chromosomes and Gene Expression

                                   (Myc: 95% CI WT-KO enrichment 0.01273 to 1.589; 2-way ANOVA p
Research article Cancer Biology Chromosomes and Gene Expression
A B
2.5
DMSO
80S
MB3
2
absorbance (A254nm)
1.5 60S polysomes
40S
1
0.5
0
sucrose gradient (10-50%)
C D
L-GMP OP-Puro azide A555 MFI
L-GMP: Lin-Kit+Sca1-CD34+FcgR+
Kat2a WT 100000 ***
80000
60000
40000
20000
Kat2a KO 0
Kat2a WT Kat2a KO
E
Figure 6. Kat2a regulates protein synthesis activity in MLL-AF9 leukemia stem-like cells. (A) Expression of translation-associated gene signatures in
individual cells along the global MLL-AF9 STEM-ID pseudotime trajectory. Trajectory representation as in Figure 4A, with both genotypes in the same
plot. Gene signature defined as per the representation of gene sets MORF_EIF4E, MORF_EIF3S2, MORF_EIF4A2, MORF_EIF3S6 (MSigDB) in the
Robust geneset. (B) Polysomal profiling of MOLM-13 cells upon overnight treatment with DMSO or the Kat2a inhibitor MB-3 (Biel et al., 2004) (200
mM); data are representative of 2 independent experiments. (C) Flow cytometry plot of OP-Puro incorporation by phenotypic L-GMP isolated from
spleens of MLL-AF9 secondary leukemias WT or KO for the Kat2a gene. This pattern was observed in 2 out of 3 Kat2a KO leukemias analysed (0/3 WT).
(D) Quantitation of protein synthesis rate in Kat2a WT and KO L-GMP as measured by OP-Puro incorporation. Mean ± SEM; n = 3 individual leukemia
Figure 6 continued on next page
Domingues et al. eLife 2020;9:e51754. DOI: https://doi.org/10.7554/eLife.51754 14 of 29Research article Cancer Biology Chromosomes and Gene Expression Figure 6 continued samples/genotype; *p
Research article                                                               Cancer Biology Chromosomes and Gene Expression

                                   H3K4me1-positive enhancers. Instead, we observed a gain in H3K27ac at both H3K4me3 promoters
                                   and H3K4me1 enhancers as a single acetylation mark, which may help explain the minimal conse-
                                   quences of Kat2a loss in terms of average gene expression, and highlight the specific role of Kat2a-
                                   dependent H3K9ac of promoters in stabilizing transcriptional activity. Gain of H3K27ac may reflect
                                   differentially regulated or compensatory acetylation by other histone acetyl-transferases in the
                                   absence of Kat2a. In light of the promoter vs. enhancer specificity of the changes observed, it will be
                                   interesting to investigate to what extent reprogramming of acetylation marks reflects proximal
                                   reconfiguration of enhancer-promoter interaction via Ctcf binding. Ctcf loss has been shown to
                                   increase gene expression CV with moderate or no differences in mean expression (Ren et al., 2017),
                                   a pattern akin to our observations upon Kat2a loss. Whereas their study specifically investigated
                                   sequence-driven loss of Ctcf binding at proximal, intra-TAD enhancer regions, we observed that
                                   H3K9ac-depleted promoters in Kat2a KO leukemia cells had a significant association with experi-
                                   mental Ctcf binding in ENCODE experiments, and we speculate that Ctcf may be dislodged to
                                   enhancers and promote asymmetric distribution of histone acetylation marks, with dysregulation of
                                   locus control. Of note, too, is the fact that despite the almost complete knockout of Kat2a expres-
                                   sion, the loss of H3K9ac, although specific in terms of chromatin context, is far from dramatic. This is
                                   similar to recent observations in embryoid bodies (Wang et al., 2018) and suggests that Kat2a
                                   requirement for H3K9ac is not absolute, although it may be locus-specific. Other acetyltransferases
                                   may, either normally or compensatorily, contribute to H3K9 acetylation in at least some locations,
                                   and it will be interesting to understand the parameters that determine specific dependency on
                                   Kat2a activity and its unique consequences to transcription.
                                       Variability in gene expression levels reflects regulation of locus activity, and whilst specific contri-
                                   bution from enhancers has been proposed (Fukaya et al., 2016) and remains an area of active inves-
                                   tigation (Larsson et al., 2019) the role of promoter configuration and sequence has been more
                                   extensively characterized in multiple model systems (Antolović et al., 2017; Faure et al., 2017;
                                   Zoller et al., 2015). In most if not all loci, transcriptional activity is discontinuous, with promoters
                                   cycling between active (ON) and inactive (OFF) states. Self-limited bursts of transcriptional activity
                                   are characterized by the burst frequency, reflecting the rate of OFF-to-ON transitions, and the burst
                                   size, which captures the number of mRNA molecules produced during each burst. In yeast, regula-
                                   tion of both burst parameters is dependent on H3K9ac at specific gene locations: gene body acety-
                                   lation regulates burst size; promoter H3K9ac associates primarily with burst frequency
                                   (Weinberger et al., 2012). Furthermore, in yeast, promoter H3K9ac is deposited by the Kat2a ortho-
                                   logue and founder histone acetyl-transferase Gcn5, and removed by the Sin3a orthologue Rpd3(L)
                                   deacetylase complex. Loss of Gcn5 decreases burst frequency across multiple yeast loci and has
                                   been modelled to increase intrinsic transcriptional noise, a finding we capture in mammalian cells in
                                   the present study. Whilst our study specifically links promoter H3K9ac to regulation of burst fre-
                                   quency in mammalian cells, recent work by the Naëf lab has shown that locus-specific manipulation
                                   of promoter, but not distal or enhancer, H3K27ac can also change transcriptional bursting frequency
                                   (Nicolas et al., 2018). Although the Naëf study has not specifically manipulated H3K9ac levels, it did
                                   reveal an association between promoter H3K9ac and frequency of locus activation, which agrees
                                   with our own observations. Whether other residue-specific acetylations of promoters (or indeed
                                   enhancers) can produce the same effect remains to be determined, and this knowledge will
                                   undoubtedly deepen current understanding of transcriptional regulation. Moreover, Kat2a was
                                   recently shown to catalyze other acyl-modifications of lysine residues, namely succinylation
                                   (Wang et al., 2017), which also associates with transcriptional activation (Tong et al., 2020). Charac-
                                   terization of the exact mechanistic consequences of additional acylations and their interaction with
                                   the better characterized lysine acetylations is still lacking, not least due to lack of modification and
                                   residue-specific antibodies for the newly-identified marks. It is possible that their loss also contrib-
                                   utes to the changes in transcriptional regulation seen upon Kat2a KO, and could for example explain
                                   why the reduction in frequency of bursting, although more strongly associated with loss of H3K9ac,
                                   is not exclusive to sites depleted of this modification. Additionally, it remains possible that loss of
                                   Kat2a may impact other residue-specific acylations more dramatically than its specific effect on
                                   H3K9ac and the effects of their combined loss more completely link all the effects observed. Our lab
                                   has recently developed a KAT2A-dCas9 fusion capable of catalyzing targeted acetylation events
                                   (data not shown), which will be instrumental in the mechanistic understanding of individual acetyla-
                                   tion events and specific sequences in regulating bursting activity. It should also allow us to probe

Domingues et al. eLife 2020;9:e51754. DOI: https://doi.org/10.7554/eLife.51754                                                         16 of 29
Research article Cancer Biology Chromosomes and Gene Expression
other candidate acyl modifications to unveil their unique and combined effects on transcriptional
bursting.
Somewhat unexpectedly, we found that the genes regulated by Kat2a at the level of promoter
acetylation, and which responded to Kat2a loss with decreased frequency of bursting, were specifi-
cally associated with ribosomal assembly and translation activity. Similar categories have been shown
to be regulated by non-catalytic components of the Kat2a SAGA complex in controlling ESC pluripo-
tency (Seruggia et al., 2019), reinforcing the notion that Kat2a complexes impact general metabolic
processes in multiple cell types, and that these general processes can specifically influence cell fate
transitions. Importantly, we demonstrated that Kat2a-depleted leukemia stem-like cells (phenotypic
L-GMP) have reduced protein synthesis activity, putatively due to a perturbation of polysomal
assembly consequent to variability in levels of ribosomal proteins. Moreover, perturbation of the
translational machinery could re-capture the enhanced in vitro differentiation of leukemia cells
observed upon Kat2a depletion, suggesting that alterations in protein synthesis activity may indeed
be central to exit from leukemia self-renewal. In agreement, Morrison and collaborators
(Signer et al., 2014) had previously reported that impaired protein synthesis upon genetic depletion
of the ribosomal protein machinery impedes leukemia self-renewal, whilst having non-linear dose-
dependent effects on normal hematopoiesis, mimicking our own observations in the Kat2a KO
setting.
Future studies directing Kat2a catalytic activity to single or multiple loci will illuminate individual
vs. global target gene contributions to the leukemia phenotype. However, it is tempting to speculate
that the generic nature of the programs impacted by Kat2a at the level of transcriptional noise may
configure an underlying propensity towards execution of cell fate transitions, which can be of a dif-
ferent nature in different biological contexts. Analysis of the impact of Kat2a target programs in
other malignant and normal stem cell systems, or at different stages of leukemia progression will
test this hypothesis. It will also be interesting to determine if other candidate regulators of transcrip-
tional noise produce similar effects and can be exploited therapeutically in AML, as well as in other
hematological and non-hematological malignancies.
Materials and methods
Generation and analysis of Kat2a conditional knockout mice
Kat2aFl/Fl conditional knockout mice (Lin et al., 2008) (MGI:3801321) were bred with Mx1-Cre +/-
transgenic mice (Kühn et al., 1995), in a C57Bl/6 background. Littermates were genotyped for
Kat2a LoxP sites (forward: CACAGAGCTTCTTGGAGACC; reverse: GGCTTGATTCCTGTACCTCC)
and for Mx1-Cre: (forward: CGTACTGACGGTGGGAGAAT; reverse: TGCATGATCTCCGGTATTGA):
Ear notch biopsies were digested using KAPA express extract (Sigma Aldrich) and KAPA2G ROBUST
HS RM Master Mix (2x) (Sigma Aldrich). PCR cycling protocol: 95C, 3 min; 40x (95˚C, 15 s; 60˚C, 15
s; 72˚C, 60 s); 72˚C, 60 s. DNA products were run on a 1% Agarose Gel in TAE (1x), at 100V and visu-
alized using an AlphaImager UV transilluminator (Protein Simple). Cre-mediated recombination was
induced in 6–10 week-old mice by administration of 5 alternate-day intraperitoneal injections of poly
(I)- poly(C) (pIpC), 300 mg/dose. After pIpC treatment, animals were identified as Kat2a WT = Kat2
aFl/Fl * Mx1-Cre -/- and Kat2a KO = Kat2 aFl/Fl * Mx1-Cre +/-. Excision efficiency was determined by
qPCR of genomic DNA (gDNA) from Peripheral Blood (PB), Spleen (Sp) or Bone Marrow (BM).
gDNA was extracted using Blood and Tissue DNA easy Kit (Qiagen) and quantified by Nanodrop
(Thermo Scientific). qPCR analysis used Sybr Green Master Mix (Applied Biosystems) and two sets of
primers (Figure 1A): Kat2a-IN11 (forward: CAACTTCCCCAAGGTATGGA; reverse: CGGGGACC
TTAGACTTGTGA), within the excised region; Kat2a-OUT18 (forward: AGTCTGGGCTGTTTCCATGT;
reverse: GCCCGTTGTAGAATGTCTGG), distal to the second LoxP site. Expression levels were
determined by the Pfaffl method following normalization to Kat2a-OUT. PB was collected by saphe-
nous vein and differential blood cells counts were determined using a Vet abc automated counter
(Scil Animal Care, Viernheim, Germany). Mice were kept in an SPF animal facility, and all experimen-
tal work was carried out under UK Home Office regulations. Animal research was regulated under
the Animals (Scientific Procedures) Act 1986 Amendment Regulations 2012 following ethical review
by the University of Cambridge Animal Welfare and Ethical Review Body (AWERB).
Domingues et al. eLife 2020;9:e51754. DOI: https://doi.org/10.7554/eLife.51754 17 of 29Research article Cancer Biology Chromosomes and Gene Expression
Isolation of mouse BM stem and progenitor cells
BM was isolated from mouse long bones as described before (Pina et al., 2015). Following red
blood cell lysis, total BM suspension was depleted of differentiated cells using a cocktail of biotiny-
lated lineage (Lin) antibodies (Table 1) and streptavidin-labeled magnetic nanobeads (Biolegend),
according to manufacturers’ instructions. Cells were directly used in transplants, colony-forming
assays or flow cytometry for analysis of normal hematopoiesis. For leukemia studies, cells were cul-
tured overnight at 37˚C 5% CO2 in RPMI supplemented with 20% Hi-FBS (R20), 2 mg/mL L-Gluta-
mine, 1% PSA, 10 ng/mL of murine Interleukin 3 (mIL3), 10 ng/mL of murine Interleukin 6 (mIL6), and
20 ng/mL of murine Stem Cell Factor (mSCF) (cytokines from Peprotech) (supplemented R20), fol-
lowed by retroviral transduction.
Colony forming cell (CFC) assays
For analysis of normal progenitors, sorted mouse BM cells were plated at a density of 200–400 cells/
plate in duplicates, in MethoCult GF M3434 (STEMCELL Technologies). Colonies were scored at 7–9
days. For analysis of MLL-AF9 leukemia, retroviral-transduced BM cells were plated in M3434 at an
initial density of 10000 cells/condition and scored and re-plated every 6–7 days. Re-plating was per-
formed up to passage 9, with 4000 cells/condition used from plate 3. CFC assays from mouse MLL-
AF9 transformed lines were seeded in M3434 and scored 6–7 days later. RPS6K inhibition studies
were set by adding 3.3 mL DMSO, either as vehicle or with a final concentration of 3.5 mM of
PF4708671 (Tocris), directly to the methylcellulose medium, with mixing prior to cell addition.
Table 1. Antibodies used in flow cytometry analysis and cell sorting.
Antibody Fluorochrome Catalogue # Clone Dilution Supplier
CD45.1 FITC 110705 A20 1:200 BioLegend
CD45.2 AF700 56-0454-81 104 1.:200 Ebioscience
CD45R/B220 (Lin)* Biotin 103204 RA3-6B2 1:300 BioLegend
Ter119 (Lin)* Biotin 116204 Ter119 1:300 BioLegend
Gr1 (Lin)* Biotin 108404 RB6-8C5 1:300 Biolegend
CD3e (Lin)* Biotin 100304 145–2 C11 1:300 BioLegend
CD11b (Lin)* Biotin 101204 M1/70 1:300 BioLegend
CD11b/Mac1 AF700 101222 M1/70 1:200 BioLegend
CD11b/Mac1* PE-Cy7 25-0112-81 M1/70 1:200 Ebioscience
CD16/32/FcgR* PE 101308 93 1:100 BioLegend
CD16/32/FcgR PerCP-Cy5.5 101323 93 1:100 BioLegend
CD34* APC 128612 HM34 1:100 BioLegend
CD34 AF700 560518 RAM34 1:100 BD
CD117/c-Kit* APC-Cy7 105826 2B8 1:50 BioLegend
CD117/c-Kit APC-eF780 47-1171-82 2B8 1:100 Ebioscience
Sca1* PE-Cy7 108114 D7 1:100 BioLegend
Gr1 AF700 108422 RB6-8C5 1:200 BioLegend
Gr1 PB 108430 RB6-8C5 1:100 BioLegend
CD135/Flt3* PE 135305 A2F10 1:100 BioLegend
CD105* PE 562759 MJ7/18 1:100 BD
CD150* Af647 562647 Q38-480 1:100 BD
CD41* Biotin 13-0411-81 eBioMWReg30 1:100 Ebioscience
Streptavidin* BV421 405226 1:200 BioLegend
Streptavidin BV510 405233 1:200 BioLegend
Domingues et al. eLife 2020;9:e51754. DOI: https://doi.org/10.7554/eLife.51754 18 of 29Research article Cancer Biology Chromosomes and Gene Expression
In vivo analysis of leukemia initiation and engraftment
For analysis of normal hematopoiesis, 106 Kat2a WT or Kat2a KO cKit+ cells were intravenously
injected via tail vein into lethally irradiated (2*5.5Gy) CD45.1 recipient mice. At the described time-
points, BM and Sp were collected and processed into a single-cell suspension for surface marker
staining and flow cytometry analysis. For AML induction, we transplanted 1.5 106 cKit+ Kat2a WT
or Kat2a KO cells transduced with MSCV-MLL-AF9-IRES-YFP, intra-venous into lethally irradiated (2*
5.5Gy) CD45.1 recipient mice. The number of recipients used was determined by the numbers of
cells available post-retroviral transduction and the transduction efficiency estimated by flow cytome-
try at the point of injection, aiming at a minimum of 1 x 10⁵ YFP+ cells/recipient and the same num-
ber of YFP+ cells delivered to all recipients. The investigators were blinded as to the group
allocation, with the injections performed by an investigator not involved in sample preparation, or in
subsequent animal follow-up and tissue collection. Upon signs of illness and following human end-
point criteria, animals were culled, tissue samples collected for histology analysis, and BM and Sp
processed into single-cell suspensions. Flow Cytometry analysis and DNA extraction were per-
formed. Data collection was performed using general identification numbers with no reference to
the experimental group. For limiting-dilution analysis, 5*102 - 5 104 cells from primary leukemia
pooled BM of each genotype were transplanted into sub-lethally irradiated (1*5.5Gy) CD45.1 recipi-
ent mice (3–4/dose and genotype). Numbers of animals used were contingent on availability on
CD45.1 recipients aiming at no less than 10 recipients per genotype divided between 3 cell doses to
allow for limiting dilution statistical analysis.
Retroviral transduction
Retroviral construct MSCV-MLL-AF9-IRES-YFP was previously described (Fong et al., 2015). For viral
particle production, Human Embryonic Kidney (HEK) 293 T cells were seeded at 2.5 106 cells/10
cm dish in DMEM supplemented with 10% Hi-FBS, 2 mg/mL L-Glutamine, 1% PSA and cultured
overnight at 37˚C 5% CO2. The following day, a transfection mix [per plate: 47.5 mL of TranSIT
(Miros), 5 mg of packaging plasmid psi Eco vector (5 mg), retroviral vector (5 mg) and 600 mL of Opti-
mem Medium (Gibco)] was prepared according to manufacturer’s instructions and added dropwise
to cells followed by plate swirling and overnight culture at 37˚C 5% CO2. Medium was replaced with
R20 the next day. At 24 and 48 hr after R20 replacement, medium was collected and filtered through
a 0.45 mM syringe filter, and viral particle suspension medium was added to BM cells. BM cells from
6 to 10 week old Kat2a WT and Kat2a KO mice were collected and Lineage-depleted as described
above (Isolation of mouse BM stem and progenitor cells), and cultured overnight at 37˚C 5% CO2 in
supplemented R20. For viral transduction, BM cells were briefly centrifuged at 400G, 5 min, and viral
particle suspension medium supplemented with 10 ng/mL mIL3, 10 ng/mL mIL6, and 20 ng/mL
mSCF added to a final density of 106 cells/mL. Cells were plated in 6-multiwell plates and centri-
fuged for 1 hr at 2000 rpm, 32˚C. After, cells were incubated for 4 hr at 37˚C 5% CO2. A second
round of viral transduction was performed, with post-centrifugation incubation performed overnight.
Next day, cells were collected, pelleted and washed three times with PBS (2x) and R20 (1x). YFP
level was accessed by Flow Cytometry in a Gallios Analyser (Beckman Coulter).
Establishment of MLL-AF9 transformed cell lines
MLL-AF9 clonal liquid cultures were set up using MLL-AF9 retrovirus-transduced primary BM cells
(see Retroviral Transduction section). Transformed cells enriched in vitro by 3 rounds of serial plating
(CFC assays) were maintained in R20 supplemented on alternate days with mSCF, mIL3 and mIL6, all
at 20 ng/mL. Cells were cultured at 2*105 cells/ml and passaged when they reached a density of
1*106/ml.
Flow cytometry
Cell surface analysis of BM and Sp was performed using a panel of antibodies marked with *
described in Table 1, as per the following sorting strategies: HSC - Lin– cKit+ Sca1+ CD34– Flt3-;
MPP: Lin– cKit+ Sca1+ CD34+ Flt3-; LMPP: Lin– cKit+ Sca1+ CD34+ Flt3+; CMP: Lin– cKit+ Sca1-
CD34+/low CD16/32low; GMP: Lin– cKit+ Sca1+ CD34+ CD16/32high; MEP: Lin– cKit+ Sca1+ CD34-
CD16/32-; Lin-: CD3e- B220- Gr1- CD11b- Ter119-. Data were acquired on Gallios (Beckman Coulter)
Domingues et al. eLife 2020;9:e51754. DOI: https://doi.org/10.7554/eLife.51754 19 of 29Research article Cancer Biology Chromosomes and Gene Expression
or LSRFortessa (BD) cytometers; data analysis used Kaluza software (Beckman Coulter). Cell sorting
was performed on Influx or AriaII instruments (both from BD).
Measurement of protein synthesis
Six million cells each from the spleens of 3 individual secondary leukemia samples per genotype
were cultured overnight in supplemented R20 to allow recovery after thaw. O-propargyl-puromycin
(OP-Puro, Thermo Fisher Scientific) was added directly to 80% of each culture at a final concentra-
tion of 50 mM and incubated for 1 hr at the end of the culture period; the remainder was treated
with PBS and processed in parallel as a control. After incubation, cells were washed twice in ice-cold
PBS without Ca2+ or Mg2+ (Sigma), and resuspended in PBS/10%FBS for cell surface staining with
Lineage markers (Gr1/Mac1-AF700), c-Kit-APC-ef780, Sca1-PE-Cy7, CD34-APC, CD16/32-PerCP-
Cy5.5 (see Table 1) for 30 min on ice. After washing, cells were fixed in 1% paraformaldehyde (PFA)
in PBS for 15 min on ice, protected from light, washed, and then permeabilized in PBS/3% FBS/0.1%
saponin (permeabilization buffer) at room temperature, in the dark, for 5 min. Cells were washed
and used immediately in the azide-alkyne cyclo-addition reaction with Click-iT Cell Reaction Buffer
Kit (Thermo Fisher Scientific; C10269) and Alexa Fluor 555-Azide (Thermo Fisher Scientific; A20012)
with a master reaction solution freshly prepared as per manufacturer’s instructions for immediate
use. Alexa Fluor 555-Azide was used at a final concentration of 5 mM. The reaction proceeded in the
dark at room temperature for 30 min; cells were washed twice in permeabilization buffer and then
counterstained with DAPI 3.3 mg/ml in PBS for 5 min prior to flow cytometry analysis. We did not
observe any effect of cell cycle status on differential OP-Puro labeling.
Polysomal profiling
MOLM-13 cells (ID: CVCL_2119) were grown to an approximate density of 1 106 cells/mL, treated
with cycloheximide (100 mg/mL) for 15 min, washed in ice-cold PBS and stored at 80˚C. Cells were
lysed in buffer A (20 mM HEPES pH 7.5, 50 mM KCl, 10 mM (CH3COO)2 Mg, EDTA-free protease
inhibitors (Roche), supplemented with cycloheximide 100 mg/mL, 1 mM PMSF, 100 U/mL RNase
inhibitor (Promega), 1% (vol/vol) sodium deoxycholate, and 0.4% (vol/vol) NP-40) at 108 cells/mL for
10 min on ice. Lysates were cleared by centrifugation (8000 g for 5 min at 4˚C) and 3 A254nm units
loaded onto a 10–50% (wt/vol) sucrose gradient in buffer A in Polyallomer 14 95 mm centrifuge
tubes (Beckman). After centrifugation (Beckman SW40Ti rotor) at 260 900 g for 3 hr at 4˚C, gradients
were fractionated at 4˚C using a Gilson Minipulse three peristaltic pump with continuous monitoring
(A254nm). Samples were analysed using a Brandel gradient fractionator, the polysome profiles were
detected using a UV monitor (UV-1, Pharmacia) at A254, and 0.5 mL fractions were collected. The
electronic outputs of the UV-1 monitor and fraction collector were fed into a Labjack U3-LV data
acquisition device with an LJTick-InAmp preamplifier.
Quantitative real time PCR (Q-RT-PCR)
Total RNA was extracted using Trizol Reagent (Invitrogen). RNA from equal numbers of cells was
reverse-transcribed using Superscript II (Invitrogen), following manufactures’ instructions. Comple-
mentary (c)DNA was analyzed in duplicate or triplicate by qPCR using Taqman gene expression
assays (Ppia; Mm03024003_g1; Hprt: Mm01545399_m1; Kat2a: Mm00517402_m1) and Taqman
Gene Expression Mastermix (Applied Biosystems). Gene expression levels were determined by the
Pfaffl method following normalization to Reference gene, as stated. For exon 2–18 in-frame prod-
ucts, qPCR using Sybr Green Master Mix (Applied Biosystems) was performed in triplicates. Primers
used were: Kat2a Exon 1–2 (forward: GTCTTCTCAGCTTGCAAGGCC, reverse: AAAGGGTGCTCA-
CAGCTACG); Kat2a Exon2-18 (forward: GTAGCTGTGAGCACCCTTTGG, reverse: TTCGCTGTC
TGGGGGATTGT); Kat2a Exon18 (forward: CTCATCGACAAGTAGCCCCC; reverse: GTCCCTGGC
TGGAGTTTCTC).
Single-cell RT-PCR
MLL-AF9 secondary leukemia cells from Kat2a WT and KO backgrounds were freshly thawed,
stained with Lin cocktail, c-Kit-APC-ef780, Sca1-PE-Cy7, CD16/32-PerCP-Cy5.5, CD34-AF700 and
Streptavidin BV510 (see Table 1), plus dead cell exclusion with Hoechst 32558 (Thermo Fisher Scien-
tific), sorted as Lin-c-Kit+Sca1-CD16/32+ and single-cell deposited into 96-well plates containing 3 ml/
Domingues et al. eLife 2020;9:e51754. DOI: https://doi.org/10.7554/eLife.51754 20 of 29Research article Cancer Biology Chromosomes and Gene Expression
well of 0.67% NP-40 and 2U of RNasin Plus (Promega) in RNase-free water. Plates were vortexed
after deposition, centrifuged for lysate collection, and frozen immediately in dry ice. Plates were
stored at 80˚C. Upon thaw, cDNA was synthesized from the single-cell lysates using 5U Superscript
II (Invitrogen) and 1 mM each of gene-specific primers for Hprt and Kat2a (outer reverse, Table 2) in
a 10 ml reaction mix as per the manufacturer’s protocol (42˚C, 1 hr; 70˚C inactivation, 15 min). The
total cDNA reaction was used in a 50 ml first round PCR with duplexed outer forward primers for
Hprt and Kat2a at a final concentration of 200 nM and 1.25U HotStar Taq (Qiagen) in a reaction mix
as per manufacturer’s protocol. Cycling conditions: 95˚C, 15 min; 40*(94˚C, 1 min; 60˚C, 1 min; 72˚C,
2 min); 72˚C, 5 min; 25˚C, 30 s. Two ml of the first-round product were amplified in each of two sepa-
rate second round PCR using nested primers for the two individual genes (Table 2). Reaction mixes
as per the first round PCR, but in a final volume of 25 ml. Cycling conditions: 95˚C, 15 min; 40*(94˚C,
30 s; 60˚C, 1 min; 72˚C, 1 min); 72˚C, 5 min; 25˚C, 30 s. Second-round products were run in a 2% aga-
rose TAE1x gel at 50V, 1 hr, stained for 45–60 min in SYBRSafe solution (Thermo Fisher Scientific) in
double-distilled water, and DNA visualized on a BioRad Imager.
Chromatin immunoprecipitation (ChIP)
Pools of total BM cells from MLL-AF9 Kat2a WT and Kat2a KO primary leukemia samples (ChIP-
sequencing) and of total BM or spleen cells from MLL-AF9 Kat2a WT and Kat2a KO secondary leuke-
mias (ChIP-qPCR) were crosslinked with 1% Formaldehyde Solution (Sigma Aldrich) for 10 min at
room temperature (RT), with gentle rotation (50 rpm). Fixation was stopped with Glycine, and cells
incubated for 5 min, RT, with gentle rotation (50 rpm), followed by two washing steps in ice-cold
PBS. Cell pellets were resuspended in Lysis buffer (20 mM Hepes pH 7.6, 1% SDS and 1/100 Prote-
ase Inhibitors cocktail (PIC, Sigma Aldrich) followed by Nuclei preparation. Chromatin pellets were
sheared in a Bioruptor Pico Plus (Diagenode) in TPX tubes, using 3 runs of 11 cycles (Cycle: 30 s ON
30 s OFF) on high setting. A short spin was performed between runs and samples were transferred
to new TPX tubes. 2–10% of total sheared chromatin was kept for input reference. Immunoprecipita-
tion was set up using Dilution Buffer (0.15% SDS, 1% Triton X-100, 1.2 mM EDTA, 16.7 mM Tris pH8
and 167 mM NaCl), PIC, and the respective antibody (Table 3) and the sheared chromatin incubated
overnight at 4˚C with rotation. On the following day, protein A/G magnetic beads were pre-cleared
with Dilution Buffer supplemented with 0.15% SDS and 0.1%BSA, then mixed with immunoprecipita-
tion mix and incubated for at least 4 hr at 4˚C with rotation. Chromatin-Antibody-Beads mixes were
sequentially washed with ChIP Wash1 (2 mM EDTA, 20 mM Tris pH8, 1% Triton X-100, 0.1% SDS
and 150 mM NaCl), ChIP Wash2 (2 mM EDTA, 20 mM Tris pH8, 1% Triton X-100, 0.1% SDS and 500
mM NaCl), ChIP Wash3 (1 mM EDTA and 10 mM Tris pH8) and captured on a magnetic rack. Cap-
tured beads were incubated for 20 min with rotation in freshly prepared Elution Buffer (1% SDS and
0.1M NaHCO3). Supernatants were collected and decrosslinking performed overnight. DNA was col-
umn-purified using DNA clean and concentrator TM 5 KIT (Zymo Research), according to manufac-
turer’s instructions, using 20 mL Zymo Elution Buffer. DNA quality control was performed using DNA
Qubit 2.0/3.0 (Invitrogen); DNA fragment sizeYou can also read