Trouble in the Air Millions of Americans Breathed Polluted Air in 2018 - Environment North Carolina
←
→
Page content transcription
If your browser does not render page correctly, please read the page content below
Trouble in the Air Millions of Americans Breathed Polluted Air in 2018
Trouble in the Air
    Millions of Americans Breathed
          Polluted Air in 2018

                        Written by:
 Elizabeth Ridlington and Gideon Weissman, Frontier Group
Morgan Folger, Environment America Research & Policy Center

                       Winter 2020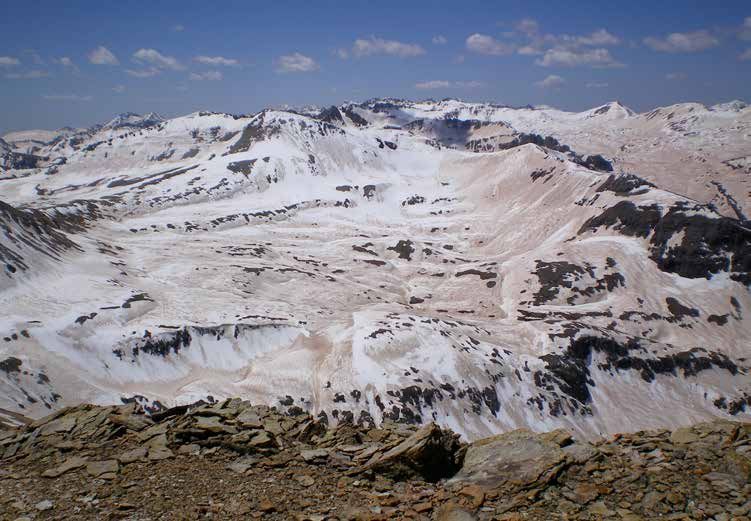
Acknowledgments
Environment North Carolina Research & Policy Center and NCPIRG Education Fund thank the following
individuals for their review of drafts of this document, as well as their insights and suggestions:
• Bruce Bekkar, M.D., Climate Activist/Speaker; Co-chair, Public Health Advisory Committee and Board
  Member, Climate Action Campaign; and Climate for Health Leadership Circle, ecoAmerica;
• Robert Laumbach, M.D., of the Rutgers School of Public Health;
• Sarah Spengeman, Ph.D., Associate Director, Climate and Health Program, Health Care Without Harm, U.S.
  and Canada; and
• Neelima Tummala, M.D., M.S., physician and clinical assistant professor of surgery, George Washington
  University School of Medicine and Health Sciences.
Thank you to reviewers who provided guidance and feedback on previous versions of this report. Thanks also to
Susan Rakov, Tony Dutzik, Abigail Bradford, and Adrian Pforzheimer of Frontier Group for editorial support.
The authors bear responsibility for any factual errors. The recommendations are those of Environment North
Carolina Research & Policy Center and NCPIRG Education Fund. The views expressed in this report are those of
the authors and do not necessarily reflect the views of our funders or those who provided review.
   2020 Environment North Carolina Research & Policy Center. Some Rights Reserved. This work is licensed un-
der a Creative Commons Attribution Non-Commercial No Derivatives 3.0 U.S. License. To view the terms of this
license, visit http://creativecommons.org/licenses/by-nc-nd/3.0/us.

                         Environment North Carolina Research & Policy Center is a 501(c)(3) organization. We are
                         dedicated to protecting North Carolina’s air, water and open spaces. We investigate prob-
                         lems, craft solutions, educate the public and decision-makers, and help the public make
                         their voices heard in local, state and national debates over the quality of our environment
and our lives. For more information about Environment North Carolina Research & Policy Center or for addition-
al copies of this report, please visit www.environmentnorthcarolinacenter.org.
                   With public debate around important issues often dominated by special interests pursuing their
                   own narrow agendas, NCPIRG Education Fund offers an independent voice that works on be-
                   half of the public interest. NCPIRG Education Fund, a 501(c)(3) organization, works to protect
consumers and promote good government. We investigate problems, craft solutions, educate the public, and offer
North Carolinians meaningful opportunities for civic participation. For more information about NCPIRG Educa-
tion Fund or for additional copies of this report, please visit ncpirgedfund.org.

                                        Frontier Group provides information and ideas to help citizens build a cleaner,
healthier and more democratic America. We address issues that will define our nation’s course in the 21st century –
from fracking to solar energy, global warming to transportation, clean water to clean elections. Our experts and
writers deliver timely research and analysis that is accessible to the public, applying insights gleaned from a variety of
disciplines to arrive at new ideas for solving pressing problems. For more information about Frontier Group, please
visit www.frontiergroup.org.
Layout: To The Point Collaborative, tothepointcollaborative.com
Cover photo: xavigm via iStockphoto.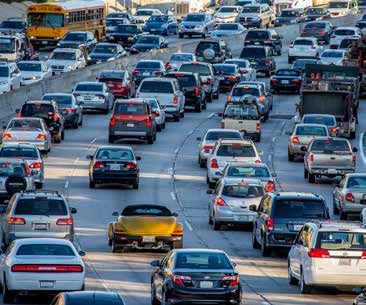
Table of contents

Executive summary  .  .  .  .  .  .  .  .  .  .  .  .  .  .  .  .  .  .  .  .  .  .  .  .  .  .  .  .  .  .  .  .  .  .  .  .  .  .  .  .  .  .  .  .  .  .  .  .  .  .  .  .  .  .  .  .  .  .  .  .  .  .  . 4

Introduction . . . . . . . . . . . . . . . . . . . . . . . . . . . . . . . . . . . . . . . . . . . . . . . . . . . . . . . . . . . . . . . . . . . . .8

Air pollution threatens public health  .  .  .  .  .  .  .  .  .  .  .  .  .  .  .  .  .  .  .  .  .  .  .  .  .  .  .  .  .  .  .  .  .  .  .  .  .  .  .  .  .  .  .  .  .  .  .  .  .  . 9
        Air pollution is harmful at some levels the EPA considers safe . . . . . . . . . . . . . . . . . . . . . . . . . . . . . . . . . . . . . . . . . . . . . .11

Fossil fuel combustion is a major source of air pollution .  .  .  .  .  .  .  .  .  .  .  .  .  .  .  .  .  .  .  .  .  .  .  .  .  .  .  .  .  .  .  . 13

Global warming will make air pollution worse  .  .  .  .  .  .  .  .  .  .  .  .  .  .  .  .  .  .  .  .  .  .  .  .  .  .  .  .  .  .  .  .  .  .  .  .  .  .  . 16

Air pollution was widespread in the United States in 2018 .  .  .  .  .  .  .  .  .  .  .  .  .  .  .  .  .  .  .  .  .  .  .  .  .  .  .  .  .  .  . 19

        Number of days with elevated ozone and/or particulate pollution . . . . . . . . . . . . . . . . . . . . . . . . . . . . . . . . . . . . . . . . . . 19
        Number of days with elevated ozone pollution . . . . . . . . . . . . . . . . . . . . . . . . . . . . . . . . . . . . . . . . . . . . . . . . . . . . . . . . .21
        Number of days with elevated particulate pollution  . . . . . . . . . . . . . . . . . . . . . . . . . . . . . . . . . . . . . . . . . . . . . . . . . . . . . 23
        Progress on air pollution has stalled . . . . . . . . . . . . . . . . . . . . . . . . . . . . . . . . . . . . . . . . . . . . . . . . . . . . . . . . . . . . . . . . . .24

Conclusion and recommendations  .  .  .  .  .  .  .  .  .  .  .  .  .  .  .  .  .  .  .  .  .  .  .  .  .  .  .  .  .  .  .  .  .  .  .  .  .  .  .  .  .  .  .  .  .  .  .  .  .  .  . 26

Methodology .  .  .  .  .  .  .  .  .  .  .  .  .  .  .  .  .  .  .  .  .  .  .  .  .  .  .  .  .  .  .  .  .  .  .  .  .  .  .  .  .  .  .  .  .  .  .  .  .  .  .  .  .  .  .  .  .  .  .  .  .  .  .  .  .  .  . 29

Appendix A. Days with elevated ozone, particulates and total pollution, by geographic area, 2018 . . . 32

Appendix B. Sources of pollutants that contribute to ozone and particulate pollution,
by state, 2014 . . . . . . . . . . . . . . . . . . . . . . . . . . . . . . . . . . . . . . . . . . . . . . . . . . . . . . . . . . . . . . . . . . . 60
Notes .  .  .  .  .  .  .  .  .  .  .  .  .  .  .  .  .  .  .  .  .  .  .  .  .  .  .  .  .  .  .  .  .  .  .  .  .  .  .  .  .  .  .  .  .  .  .  .  .  .  .  .  .  .  .  .  .  .  .  .  .  .  .  .  .  .  .  .  .  .  .  .  . 64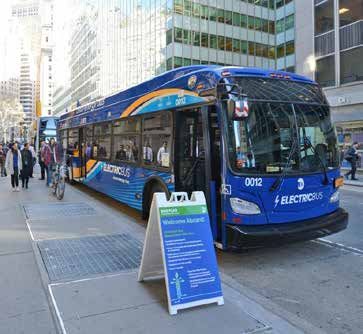
Executive summary

P
        eople across America regularly breathe                           • Air pollution is linked to health problems includ-
        polluted air that increases their risk of pre-                     ing respiratory illness, heart attack, stroke, cancer
        mature death, and can also trigger asthma                          and mental health problems. Research continues to
attacks and other adverse health impacts.                                  reveal new health impacts. For example, maternal
                                                                           exposure to air pollution such as fine particulates
In 2018, 108 million Americans lived in areas that                         (PM2.5 ) and ozone is associated with a higher risk
experienced more than 100 days of degraded air qual-                       of low birth weight, pre-term birth and stillbirth.2
ity. That is equal to more than three months of the                        For older adults, long-term exposure to particulate
year in which ground-level ozone (the main ingredient                      pollution has been associated with an increased
in smog) and/or particulate pollution was above the                        risk of Alzheimer’s disease and other forms of
level that the EPA has determined presents “little to no                   dementia.3
risk.” These Americans live in 89 large and small urban
areas,* and in 12 rural counties. Millions more Ameri-                   • Air pollution’s effects are pronounced among
cans are exposed to damaging levels of air pollution,                      vulnerable populations, including children,
but less frequently.                                                       pregnant women and the elderly. Research has
                                                                           found that children exposed to particulate pollu-
Policymakers can protect public health by strengthen-                      tion can suffer from lung development problems
ing air quality protections, reducing reliance on fossil                   and long-term harm to lung function.4
fuels that contribute to air pollution, and cutting global
warming pollution that will exacerbate future air qual-                  • Levels of air pollution that meet current federal
ity problems.                                                              air quality standards can be harmful to health,
                                                                           especially with prolonged exposure. Research-
Each year, millions of Americans suffer from                               ers can detect negative health impacts, such as
adverse health impacts linked to air pollution, and                        increased premature deaths, for people exposed
tens of thousands have their lives cut short.                              to pollution at levels the EPA considers “good”
• Fine particulate matter from sources such as                             or “moderate.”5 Current federal standards are
  vehicles and power plants was responsible for an                         less stringent than those recommended by the
  estimated 107,000 premature deaths in the U.S. in                        World Health Organization.6 Moreover, the EPA
  2011.1                                                                   cautions that unusually sensitive people may
                                                                           experience health effects at “moderate” levels. For
                                                                           these reasons, the analysis in this report includes
* Throughout this report, our mention of “large and small urban areas”     air pollution at or above the level the EPA labels
includes metropolitan areas (population above 50,000) and micropolitan     “moderate,” corresponding with a rating yellow or
areas (which have a population of 10,000 to 50,000 people).                higher in its Air Quality Index.

4    Trouble in the Air
Global warming will make air pollution worse.                                            Millions of Americans live in urban and rural areas
                                                                                         that experience frequent ozone and/or particulate
• The U.S. Global Change Research Program’s Fourth
                                                                                         pollution.
  National Climate Assessment warns that unless the
  nation acts to improve air quality, “climate change                                    • 108 million Americans lived in the 89 large and
  will worsen existing air pollution levels. This                                          small urban areas and 12 rural counties that experi-
  worsened air pollution would increase the incidence                                      enced more than 100 days of degraded air quality in
  of adverse respiratory and cardiovascular health                                         2018. (See Table ES-1.)
  effects, including premature death.”7
                                                                                         • Another 157 million Americans resided in the 264
• Climate change will worsen air pollution in several                                      large and small urban areas and 61 rural counties
  ways, including:                                                                         that faced 31 to 100 days – a month or more – of
                                                                                           elevated ozone and/or particulate pollution. The
   º Rising temperatures will speed up the formation
                                                                                           communities included major urban areas such as
     of ozone. According to one study, people in the
                                                                                           the District of Columbia and Miami and smaller
     Northeast, Midwest and Southwest will experience
                                                                                           communities such as Racine, Wisconsin, and
     three to nine more days of ozone pollution at or
                                                                                           Columbia, Missouri.
     above the level the U.S. EPA considers “unhealthy
     for sensitive groups” annually by 2050 compared to                                  People in every state face health risks from ground-
     2000 because of higher temperatures.8                                               level ozone pollution.
   º Hotter, drier weather will increase the frequency                                   • Thirty-eight urban areas and rural counties, which are
     and severity of wildfires, which create particulate                                   home to more than 21 million people, experienced
     pollution, contribute to smog, and can spread air                                     more than 100 days of ozone pollution in 2018. Such
     pollution for hundreds of miles.                                                      frequent ozone pollution affected people living in

Table ES-1. Ten most populated metropolitan areas with more than 100 days of elevated air pollution in 2018

                                                              Number of days in 2018 when half or more monitoring                                     2018
   Metropolitan area                                            locations reported elevated ozone and/or PM2.5                                      population

   Los Angeles-Long Beach-Anaheim, CA                                                              156                                               13,291,486
   Chicago-Naperville-Elgin, IL-IN-WI                                                              113                                                9,498,716
   Dallas-Fort Worth-Arlington, TX                                                                 106                                                7,539,711
   Houston-The Woodlands-Sugar Land, TX                                                            110                                                6,997,384
   Atlanta-Sandy Springs-Roswell, GA                                                               114                                                5,949,951
   Phoenix-Mesa-Scottsdale, AZ                                                                     153                                                4,857,962
   Riverside-San Bernardino-Ontario, CA                                                            227                                                4,622,361
   Detroit-Warren-Dearborn, MI                                                                     118                                               4,326,442
   San Diego-Carlsbad, CA                                                                          160                                               3,343,364
   Denver-Aurora-Lakewood, CO                                                                      131                                                2,932,415

Note: This count includes air pollution at or above the level the EPA labels “moderate,” indicated in yellow or worse in its Air Quality Index.

                                                                                                                                              Executive summary   5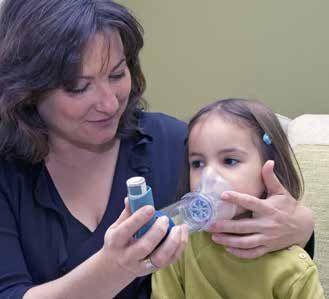
Number of days in 2018
                                                                                      when half or more monitoring
                                                                                      locations reported elevated
                                                                                      ozone and/or PM2.5
                                                                                            0 - 30
                                                                                            31 - 70
                                                                                            71 - 100
                                                                                            101 - 150
                                                                                            151 - 259

                                                                                            Areas without air pollution monitors

Figure ES-1. Both urban and rural areas experienced frequent ozone and/or particulate pollution in 2018

     communities in California, New Mexico, Arizona,    • Residents of another 228 large and small urban areas
     Utah, Colorado and Wyoming. Table ES-2 shows the     and rural counties encountered air with elevated levels
     most populated metropolitan areas that experienced   of ozone pollution on 31 to 100 days in 2018. That
     more than 100 days of elevated ozone levels.         means that for one to three months in 2018, up to 170

Table ES-2. Ten most populated metropolitan areas with more than 100 days of ozone pollution in 2018

                                            Number of days in 2018 when half or more monitoring                             2018
    Metropolitan area                                locations reported elevated ozone                                    population

    Phoenix-Mesa-Scottsdale, AZ                                        110                                                  4,857,962
    Riverside-San Bernardino-Ontario, CA                               166                                                  4,622,361
    Las Vegas-Henderson-Paradise, NV                                   132                                                  2,231,647
    Salt Lake City, UT                                                 111                                                 1,222,540
    Fresno, CA                                                         137                                                    994,400
    Albuquerque, NM                                                    123                                                     915,927
    Bakersfield, CA                                                    178                                                    896,764
    Colorado Springs, CO                                               119                                                    738,939
    Ogden-Clearfield, UT                                               108                                                    675,067
    Provo-Orem, UT                                                     104                                                    633,768

6     Trouble in the Air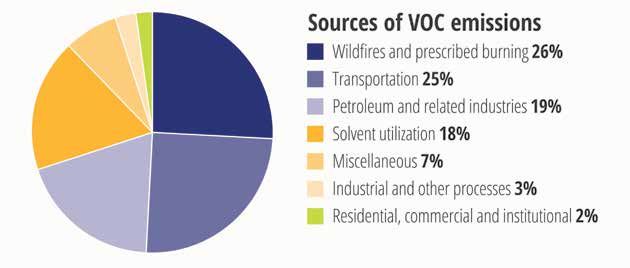
Table ES-3. Ten most populated metropolitan areas with more than 100 days of particulate pollution in 2018

                                            Number of days in 2018 when half or more monitoring                2018
  Metropolitan area                                  locations reported elevated PM2.5                       population

  Los Angeles-Long Beach-Anaheim, CA                                   135                                   13,291,486
  Riverside-San Bernardino-Ontario, CA                                 154                                    4,622,361
  San Diego-Carlsbad, CA                                               138                                    3,343,364
  Cincinnati, OH-KY-IN                                                 111                                    2,190,209
  Austin-Round Rock, TX                                                108                                    2,168,316
  Fresno, CA                                                           157                                     994,400
  Tulsa, OK                                                            146                                      993,797
  Bakersfield, CA                                                      110                                      896,764
  McAllen-Edinburg-Mission, TX                                         115                                      865,939
  Stockton-Lodi, CA                                                    183                                      752,660

  million Americans were exposed to elevated ozone                 vehicles, regional programs to cap pollution from
  pollution. Those rural counties and urban areas                  transportation, and support for active transporta-
  were located in 45 different states, plus the District           tion such as walking and biking.
  of Columbia.
                                                                • Move the country away from fossil fuels – which
Particulate pollution is widespread, exposing mil-                are a major source of climate pollution in transpor-
lions of Americans to potential health damage. 34                 tation, electricity generation and buildings – and
million people lived in areas with more than 100 days             toward the use of clean, renewable energy like
of elevated fine particulate pollution in 2018. (Table            wind turbines and solar panels.
ES-3 shows the most populated metropolitan areas                • Strengthen, and strongly enforce, emission and air
that experienced frequent fine particulate pollution.)            quality standards to fully protect human health.
Air pollution already harms the health of millions
of Americans around the country and cuts short
tens of thousands of lives each year. Climate change
will make it worse. Many solutions that address the
climate challenge will also improve air quality. Poli-
cymakers at the federal, state and local levels should
look to implement policies that:

• Reduce emissions from transportation, the largest
  source of global warming pollution in the U.S. and
  a major source of air pollution in many commu-
  nities.9 Policies to reduce global warming and air
  pollution include expanded use of zero-emission

                                                                                                     Executive summary    7
Introduction

A
         ir pollution and climate change are “two sides      ated with an increase in the number of people who die
         of the same coin,” according to the United          prematurely.15 And scientists are increasingly discovering
         Nations Environment Program.10 Climate              that air pollution has impacts on the human body far
change will make air pollution worse, while some air pol-    beyond the lung and cardiovascular problems that have
lutants can exacerbate global climate change.                long been the focus of scientific attention. For example,
                                                             research is increasingly finding links between air pol-
Higher atmospheric temperatures worsen air qual-             lution and decreased cognitive functioning, including
ity in multiple ways. Hotter temperatures speed up           possible links to diseases such as Alzheimer’s.16
the formation of ground-level ozone (often known as
“smog”) and increase evaporation of volatile organic         At the same time, scientific concerns about rising global
compounds (VOCs) that are among the precursors of            temperatures are also becoming more urgent. Numer-
ozone.11 Higher temperatures, combined with drought,         ous studies – including a headline-grabbing analysis by
will increase the frequency and severity of wildfires        the Intergovernmental Panel on Climate Change – have
that produce huge amounts of particulate pollution           estimated how steeply global temperatures are likely
that threaten public health.12                               to rise in the coming decades unless we take action to
                                                             reduce emissions dramatically.17 Many of these analyses
At the same time, air pollution such as black carbon, a      have also calculated the severe potential consequences
form of particulate pollution, exacerbates global warm-      of higher temperatures on human health and planetary
ing. Black carbon in the air readily absorbs sunlight,       wellbeing.
increasing the temperature of the atmosphere.13 When
black carbon lands on snow or ice, it absorbs heat and       Fortunately, action to reduce air pollution can help slow
hastens melting. This can lead to greater warming, as        global warming, while many of the solutions to prevent
open water and bare ground retain more heat from the         the worst impacts of climate change over the long run
sun than do snow or ice. Production of natural gas is        can also protect our health and make the air safer to
a major source of VOCs, which contribute to ozone,           breathe right away.
and also releases methane, a powerful global warming
                                                             This report shows that air pollution remains a wide-
pollutant that traps more than 80 times as much heat as
                                                             spread problem for the nation. Though the skies over
carbon dioxide over 20 years.14
                                                             most cities are less visibly smoggy than they were in the
Just as air pollution and global warming share some com-     1990s and 2000s, millions of Americans breathe levels
mon causes, and are linked together in a self-reinforcing    of pollution that can put their health at risk. By cutting
cycle, so too do they share another characteristic: scien-   the emissions that cause air pollution and contribute
tific alarm about their threats to the environment and       to global warming, we can protect public health today,
public health is growing.                                    while minimizing the warming that threatens our
                                                             future. The benefits of taking such action now are
New research has documented that an increase in even         clear. And as the following analysis shows, the costs of
low levels of air pollutants like particulates is associ-    waiting are steep.

8   Trouble in the Air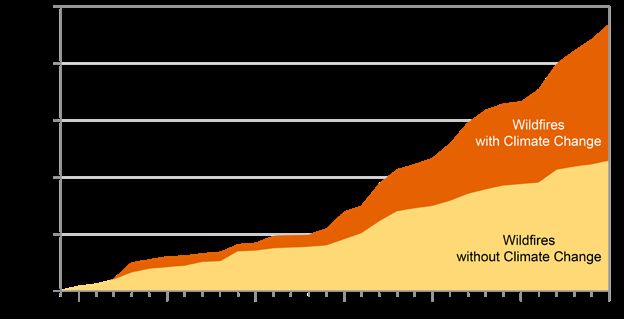
Air pollution threatens
public health
                                                                                Photo: T. H. Painter, Snow Optics Laboratory, JPLCaltech via Flickr CC BY 2.0.

Particulate pollution can harm human health and also add to global warming. Here, dust and black carbon have coated snow
and ice, causing them to absorb more heat from the sun.

A
          mericans breathe air polluted with a variety         significant risks to public health. Each year, millions
          of contaminants, including particulate matter        of Americans suffer from adverse health impacts
          (PM), ozone, carbon monoxide, sulfur diox-           linked to air pollution, and tens of thousands have
ide, nitrogen dioxide, volatile organic compounds,             their lives cut short.
and many other toxic or hazardous substances. This
pollution, which comes from burning fossil fuels, agri-        Two pollutants of special concern are particulate mat-
cultural activity, wildfires, and other sources, creates       ter and ozone. Fine particulate pollution smaller than

                                                                                        Air pollution threatens public health                               9
2.5 micrometers (PM2.5) poses especially high health risks related air pollution, not only worsens asthma but may
because it can be deposited deep in the lungs.18 Ozone also cause more people to develop asthma.26 Research
that forms near the ground is the main ingredient in also shows strong associations between air pollution and
smog and is associated with adverse health impacts (as cardiovascular diseases including stroke.27 Particulate
opposed to ozone in the high atmosphere, which blocks pollution is associated with increased risk of hospitaliza-
harmful solar ultraviolet rays from reaching the earth). tion for heart disease.28
Air pollution – including but not limited to PM2.5 and Worsened mental health and functioning. A 2019
ozone – damages many aspects of health and wellbeing. study published in PLOS Biology found that poor air
quality, including higher levels of particulate matter and
Premature death. Globally, ozone and fine particulate
ozone, was associated with increases in bipolar disor-
matter are estimated to cause 470,000 and 2.1 million
der.29 Long-term exposure to particulate pollution has
deaths each year, respectively, by damaging the lungs and
also been associated with increased risk of Alzheimer’s
respiratory system.19 A study published in the Proceedings
disease and other forms of dementia.30
of the National Academy of Sciences estimated that in the
U.S. fine particulate matter generated by human activi- Decreased fertility and harm to pregnancies. Exposure
ties was responsible for more than 107,000 premature to air pollution has been associated with difficulty in
deaths in 2011.20 having children, and increased risk of low birth weight
and premature deliveries.31 A 2019 study of women in
Small changes in pollution levels affect death rates.
Italy found that higher levels of particulate matter (both
A 2019 study published in the New England Journal of
PM2.5 and PM10) and nitrogen dioxide are associated
Medicine found that when the concentration of fine par-
with lower levels of ovarian reserve, a marker of female
ticulate matter (PM2.5) increased by 10 micrograms (μg)
fertility.32 A 2013 study found “short-term decreases in a
per cubic meter, daily mortality in the U.S. increased by
couple’s ability to conceive” associated with higher levels
1.58 percent. A 1.58 percent increase in daily mortality
of PM2.5 and nitrogen dioxide.33 Maternal exposure to
equals an additional 122 deaths in the U.S. on a day
PM2.5 or ozone is associated with a higher risk of low
when fine particulate pollution increased by 10 μg per
birth weight, pre-term birth and stillbirth.34 One study
cubic meter.21 When coarse particulate matter (PM10)
estimated that in 2010, up to 42,800 preterm births in
increased by 10 micrograms (μg) per cubic meter, daily
the U.S. and Canada were related to women’s exposure
mortality rose 0.79 percent.22
to PM2.5, accounting for up to 10 percent of preterm
A 2009 study compared U.S. metropolitan areas births.35
across decades and found that a 10 μg per cubic meter
Increased cancer risk. Exposure to air pollution can
decrease in fine particulate matter concentrations was
cause lung cancer and other cancers.36 The International
associated with an increase in average life expectancy of
Agency for Research on Cancer (IARC), part of the
approximately 0.6 years.23
World Health Organization, has found that outdoor air
Damage to respiratory and cardiovascular systems. In pollution generally, and particulate matter specifically,
weeks with elevated ozone or particulate matter pollu- are carcinogenic to humans.37 The IARC determined
tion, hospital emergency rooms see more patients for that “exposures to outdoor air pollution or particu-
breathing problems.24 A 2019 study published in JAMA late matter in polluted outdoor air are associated with
(the Journal of the American Medical Association) found increases in genetic damage that have been shown to be
that higher levels of pollutants including ozone and par- predictive of cancer in humans.” In 2010, 223,000 lung
ticulate matter in the air are associated with increased cancer deaths globally were attributed to exposure to
risk of emphysema.25 Air pollution, especially traffic- PM2.5.38
10 Trouble in the AirPhoto: xavigm via iStockphoto
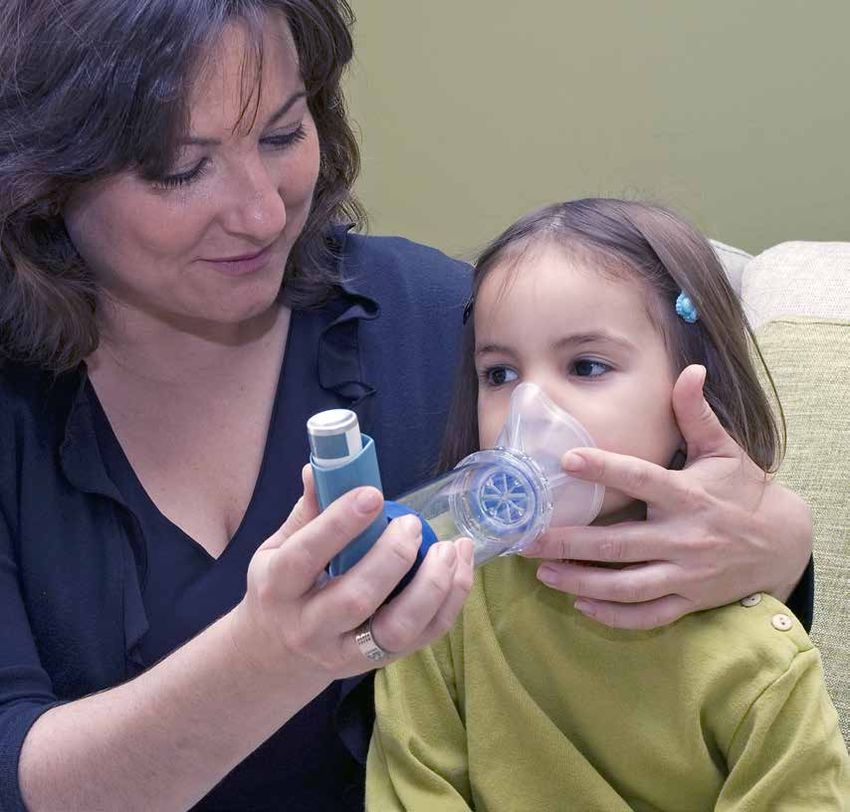
Harm to children. Children are particularly vulnerable
to air pollution because their bodies are developing, and
also because they tend to spend more time outside.39
Children are also exposed to higher levels of air pollu-
tion because they walk or are pushed in strollers closer
to the height of vehicle exhaust pipes.40 Particulate pollu-
tion can harm lung development in children and impair
lung function in the long-run.41 Prenatal exposure to air
pollution is also associated with impaired lung function
and impaired lung development in childhood.42
Air pollution is harmful at some levels the EPA
considers safe
Air pollution likely poses health threats even at levels the
EPA considers safe. Children are particularly vulnerable to air pollution.
The EPA communicates potential health risks to the
public using its Air Quality Index (AQI), which classifies Air quality classified as “Good,” for example, poses
levels of different pollutants into the color-coded risk cat- “little or no risk,” according to the EPA.44 “Moderate”
egories of “Good,” “Moderate,” “Unhealthy for Sensitive pollution is described by the EPA as only presenting “a
Groups,” “Unhealthy,” “Very Unhealthy,” and “Hazard- moderate health concern for a very small number of
ous.” (See Table 1 for details and colors.) people who are unusually sensitive to air pollution.”45
Table 1. U.S. EPA air quality index values and colors43
Air Quality Air Quality Index
Color Ozone Readings (ppb) PM2.5 Readings (µg/m3)
Category Values
Good 0-50 Green 0-54 0-12
Moderate 51-100 Yellow 55-70 12.1-35.4
Unhealthy for
101-150 Orange 71-85 35.5-55.4
Sensitive Groups
Unhealthy 151-200 Red 86-105 55.5-150.4
Very Unhealthy 201-300 Purple 106-200 150.5-250.4
Hazardous 301-500 Maroon 201+ 250.5+
Air pollution threatens public health 11Higher levels of pollution create a health threat more Beyond what the WHO and other health organizations
quickly and for a larger share of the population. have recommended, a growing body of evidence sup-
ports the conclusion that even very low levels of pollu-
The AQI is linked to the National Ambient Air Quality tion can affect health.
Standards (NAAQS), which are periodically reviewed
and adjusted based on the latest research on the links • In response to new data about deaths linked to
between pollution and public health. For example, cur- particulate pollution, a 2019 editorial in the New
rently the EPA has concluded that ozone levels above 70 England Journal of Medicine noted that “Even high-
parts per billion for eight hours or more are unhealthy income countries, such as the United States, with
for sensitive people, and when ozone exceeds that level, relatively good air quality could still see public
the EPA warns that children, older adults and people health benefits from further reduction of ambient
with lung disease should consider limiting their expo- PM concentrations (i.e., below the current [pollution
sure.46 The EPA has concluded that sensitive people are standards]).”51
at risk when levels of fine particulates (particulate matter
• A 2019 analysis of the impact of PM2.5 on dementia
of 2.5 microns or less, PM2.5 ) average 35 micrograms per
rates concluded that particulate pollution continues
cubic meter of air (µg/m3) over 24 hours.47
to have an impact at levels “below the current regula-
However, research suggests that “moderate” air quality tory thresholds.”52
can, in fact, pose broad threats to public health, and a
In fact, there may not be a minimum threshold at which
variety of medical and public health organizations have
air pollution should be considered safe. For example:
recommended tighter air quality standards that are more
protective of public health. • In a 2017 study, researchers examined more than
22 million deaths in the Medicare population from
The World Health Organization (WHO), for example,
2000 to 2012 and found that a 10-parts-per-billion
recommends lower ozone and particulate pollution stan-
rise in warm-season ozone pollution increased the
dards than are currently in place in the United States.
daily mortality rate by 0.5 percent, regardless of how
The WHO published air quality guidelines in 2006 that
low pollution levels had been initially.53 The authors
recommended an ozone pollution standard equal to 51
concluded that there is “no evidence of a threshold”
parts per billion over eight hours.48 In comparison, the
below which ozone or particulate pollution is safe.
current U.S. ozone standard is 70 parts per billion.49 The
WHO recommended that fine particulates be limited to • Even when concentrations of ozone are at levels
25 µg/m3 over 24 hours, which is more protective than considered by the EPA to be “good” or “moderate,”
the current U.S. standard of 35 µg/m3. The American a 2006 study found that an increase in ozone pollu-
Thoracic Society, the American Lung Association and tion results in more premature deaths.54
other health associations support the same standard for
fine particulates as the WHO.50 • In 2006, the WHO concluded that there is no
documented safe level of exposure to particulate
pollution.55
12 Trouble in the AirFossil fuel combustion is a
major source of air pollution
A
ir pollution comes from a variety of sources, sunlight.56 Fossil fuels – both their combustion and
both human and natural. Gasoline, diesel, production – are major sources of NOx and VOC
natural gas, coal and other fossil fuels burned emissions.
for transportation, electricity generation, industrial
processes, heating and other purposes are major sources The majority of NOx emissions come from the com-
of NOx and VOC emissions. These create ground-level bustion of fossil fuels for transportation and electric-
ozone and also can turn into particulate pollution. Fossil ity generation. (See Figure 1.)
fuel combustion, fires and dust are major contributors to • In 2014, transportation and other mobile sources
particulate pollution. These sources create particulates produced more than 60 percent of NOx emissions.
directly and, in addition, some produce precursor chemi- Highway vehicles – including passenger cars and
cals that combine into particulates. SUVs, freight trucks and delivery vans – accounted
for more than one third of total NOx emissions
Ozone from human activities. Commercial marine vessels
Ozone, the main component of smog, is formed by and railroads accounted for 9 percent and 5
chemical reactions between nitrogen oxides (NOx ) and percent of emissions, respectively.58
volatile organic compounds (VOCs) in the presence of
Figure 1. Sources of nitrogen oxide (NOx) pollution in 2014 (excluding NOx from vegetation)57
Fossil fuel combustion is a major source of air pollution 13• In 2014, coal combustion for electricity genera- is prevalent.62 Oil and gas production in northeast-
tion by utilities accounted for 11 percent of NOx ern Colorado, for example, has been found to be a
emissions from human activities, with oil and gas major contributor to ozone in the area. According
adding more pollution. to a researcher who headed one study, as quoted by
Phys.org, “If conditions are right, emissions from oil
• Industrial activities accounted for 12 percent of NOx and gas can contribute up to 20-30 parts per billion
emissions. (ppb) on bad ozone days and could lead to exceed-
• Oil and gas production, refining and related activi- ances of the Environmental Protection Agency
ties produced 5 percent of the nation’s total NOx standards.”63
emissions from human activities in 2014. • Solvents such as those used in consumer products,
Wildfires, transportation, and oil and gas production are pesticides, graphic arts, architectural applications
the biggest sources of VOC emissions in the United States and other activities created 19 percent of VOCs
(excluding VOCs released by plants). (See Figure 2.) (excluding VOCs from plants).
• Wildfires and planned burning created 26 percent • Trees and other plants are also a major source of
of VOCs from human activities and fires in 2014.60 VOCs. VOC emissions from plants can contribute
to ground-level ozone when they react with pollution
• Transportation accounted for one-quarter of all from human sources.64
VOC pollution from human activities and fires in
2014. Passenger cars and SUVs accounted for nearly Particulate matter
half of VOC emissions from transportation.61
Particulate matter consists of solid or liquid particles that
• In 2014, oil and gas production was responsible can be emitted directly from a source or that can form
for nearly one fifth (19 percent) of VOC emissions in the air from chemicals such as VOCs, sulfur dioxide,
(excluding emissions from vegetation), with signifi- ammonia and NOx.65 Fine particulates smaller than 2.5
cant impacts in areas where oil and gas production micrometers (PM2.5) pose elevated health risks as they can
Figure 2. Sources of volatile organic compound (VOCs) pollution in 2014 (excluding VOCs from vegetation)59
14 Trouble in the AirPhoto: Eric Demarcq via Flickr CC BY-NC-ND 2.0.
be absorbed deep into the lungs.66 The impact of PM2.5 is
further increased by the fact that it is so lightweight that it
remains in the air for a long time and can travel hundreds
of miles from its source.67
Primary particulate matter is created by a variety of
sources, including fossil fuel combustion; dust from
roads, agriculture and construction; wildfires; and wood
burned for heating.68 On average across the U.S., the
majority of the particulate pollution in the atmosphere
is secondary particulate pollution, which forms through
a chemical reaction.69 Secondary PM2.5 can be created
from sources including sulfur dioxide emitted by burn-
ing coal and other fossil fuels for electricity generation
and industrial power; nitrogen oxides from fossil fuel
combustion; and ammonia from fertilizer and manure.70
Cars, light-trucks and other vehicles contribute to both
Mobile sources (including cars, trucks and other on-road particulate pollution and ozone pollution.
vehicles and also off-road vehicles) accounted for 20
percent of both primary and secondary PM2.5, according
to one 2004 study.71 Mobile sources may have dispro- for 18 percent of primary PM2.5.77 Agriculture is also
portionately larger impacts on health compared to other responsible for 80 percent of national ammonia emis-
sources, because mobile sources are generally in closer sions, which can react in the atmosphere to form
proximity to people. A 2019 study estimated that trans- secondary particulate matter.78 Agricultural ammonia
portation emissions were associated with more than a emissions, which are emitted from sources including ani-
quarter of U.S. deaths caused by fine particulate matter mal waste and fertilizer, are responsible for a significant
created by human activity.72 percentage of human mortality attributed to PM2.5.79
In addition to combustion emissions, cars, trucks and
other on- and off-road vehicles play a role in producing
other particulate pollution. In 2014, dust from paved and
unpaved roads accounted for 16 percent of primary fine Air toxics
particulate emissions.73 Vehicle braking also produces par- Fossil fuel combustion also releases toxic air
ticulate pollution, which can contain heavy metals such as contaminants such as benzene, formaldehyde
zinc and copper that may elevate health risks.74 and 1,3-butadiene that contribute to ozone
Electricity generation is also a major source of PM2.5 and particulate pollution, and that are also
pollution, especially in eastern states.75 Power plants hazardous on their own.80 These pollutants can
produce large amounts of sulfur dioxide, which can turn cause cancer, and some, such as formaldehyde,
into PM2.5. According to a 2019 study, sulfur dioxide increase the risk of asthma.81 Exposure to air
from coal-fired power plants accounts for 11 percent of toxics creates additional health threats above
the total health damage from PM2.5.76 and beyond the threats highlighted in this
report related to particulate matter and ozone.
Agriculture is also a major source of particulate pollu-
tion. Dust from crop and livestock operations accounted
Fossil fuel combustion is a major source of air pollution 15Global warming will make
air pollution worse
C
limate change has begun to affect air qual- Global warming is already harming air quality.
ity, and air pollution will become a greater
• Higher temperatures have already resulted in
problem as climate change further warms
the planet, alters weather patterns, and triggers increased ozone, despite lower emissions of the
chemicals that create ozone. In the central U.S. in
other shifts. According to the U.S. Global Change
the summer of 2012, for example, higher tempera-
Research Program’s Fourth National Climate Assess-
tures caused higher levels of ozone than in the
ment, “climate change will worsen existing air pollu-
years before and after.83
tion levels” without additional efforts to improve air
quality. “This worsened air pollution would increase • The American Lung Association found that
the incidence of adverse respiratory and cardiovas- ozone was higher in the 2014 to 2016 period than
cular health effects, including premature death,” in previous recent three-year study periods, and
according to the report.82 attributed the increase to higher temperatures.84
Figure 3. Climate change has increased the area burned in wildfires87
16 Trouble in the Air• Hotter, drier conditions have increased wildfires, at that level are in the range the EPA considers
which create particulate pollution as well as VOCs “unhealthy for sensitive groups.”90
and nitrogen oxides that contribute to ozone
formation. By one estimate, global warming nearly • With higher temperatures throughout the year,
doubled the total acreage that burned in western unhealthy levels of ozone may become more
states from 1984 to 2015, compared to a scenario common in the spring and fall, in addition to the
in which the climate had not changed.85 (See Figure summer ozone problems that are common today.92
3.) Wildfires also burn for longer, causing more
prolonged and widespread exposure to pollutants. • Higher temperatures may also exacerbate the health
The typical large wildfire now burns for more than effects of exposure to any given amount of ozone, as
seven weeks, compared to less than a week in the higher temperatures are associated with an increased
1970s.86 risk of ozone-related premature death.93
• Changed wind patterns may increase the number of
In the years to come, climate change will make air pollu- days with stagnant air, keeping pollution from being
tion even worse: diluted. Decreased air circulation may already be
worsening air quality by trapping pollution precur-
• Rising temperatures will result in more ozone forma-
sors and pollution near the ground.94 Multiple days
tion.88 According to an analysis by researchers at
of stagnant air can lead to especially high levels of
Harvard and the National Center for Atmospheric
pollution.
Research, people in the Northeast, Midwest and
Southwest will have experienced an additional • Climate change will increase the frequency and
three to nine days of ozone pollution of above 75 severity of wildfires, as a result of hotter tempera-
ppb annually by 2050 compared to 2000 because of tures and more droughts.95 According to the Fourth
higher temperatures predicted as a result of global National Climate Assessment, resulting wildfires will
warming.89 (See Figure 4.) Ozone concentrations “diminish air quality, increase incidences of respi-
Black triangles indicate locations where higher temperatures will not have an impact on ozone formation.
Figure 4. Estimated change in days with elevated ozone levels in 205091
Global warming will make air pollution worse 17ratory illness from exposure to wildfire smoke, ing’s impact on air quality. The analysis, published in
impair visibility, and disrupt outdoor recreational 2017, estimates that an additional 1,130 Americans
activities.”96 may die prematurely in the year 2030 from smog pollu-
tion under a scenario where global warming emissions
• Global warming is projected to cause severe are high and unchecked.100 The study also estimates
droughts in the southwestern U.S., increasing dust that particulate pollution worsened by global warming
pollution. A 2019 study found that droughts could could cause an extra 6,900 premature deaths in 2030.
increase dust levels in the region, increasing deaths
and hospitalizations attributable to fine dust by 230 The U.S. Global Change Research Program has
percent and 360 percent, respectively.97 Reduced concluded that global warming will make it more dif-
rainfall caused by global warming may also increase ficult to control ozone pollution, and that maintaining
air pollution levels because rainfall removes particu- current pollution levels in a warmer world will require
late matter from the atmosphere.98 reduced emissions of the chemicals that form ozone.101
• Higher temperatures could increase evaporative In many cases, the activities that cause air pollution
emissions of volatile organic compounds, precursors also contribute to global warming. Efforts to reduce
to ozone.99 our reliance on fossil fuels, which contribute to global
warming, have the potential to help reduce ozone and
One study estimates global warming will increase the particulate pollution as well.
number of air pollution-related premature deaths if no
measures are implemented to counteract global warm-
18 Trouble in the AirAir pollution was widespread
in the United States in 2018
D
egraded air quality affects residents of every Number of days with elevated ozone and/or
state in the country. In the summer, ozone particulate pollution
pollution is a widespread problem. Through- In 2018, air pollution affected people across the nation.
out the year, many areas suffer from particulate pol- 108 million Americans lived in 89 large and small
lution. Even a single day of elevated air pollution urban areas and in 12 rural counties that experienced
represents a threat to public health. more than 100 days of degraded air quality in 2018.
About This Analysis In areas that contain more than one monitor-
Hundreds of air quality monitors in both urban ing location, days in which half or more of the
and rural areas across the nation sample air pol- monitoring locations in the area reported an air
lution levels multiple times each hour. Based on quality problem were included in the tally of days
this information and computer modeling, the U.S. with degraded air quality. People who live close to
Environmental Protection Agency (EPA) communi- individual air pollution monitors may experience
cates present and forecasted air quality conditions worse air pollution than indicated by this measure.
using its Air Quality Index (AQI). However, counting every elevated reading from
individual air pollution monitors runs the risk that
This report estimates the number of days of a high reading from one or a handful of monitors
degraded air quality experienced in 2018 by people may overstate the extent of the air pollution prob-
in various locations based on the number of days lem in a geographically dispersed metropolitan area.
when air quality monitors reported an AQI of
51 or higher. This includes days that the EPA This report presents the number of days with
coded as moderate, unhealthy for sensitive groups, elevated ground-level ozone pollution and with
unhealthy, very unhealthy and hazardous. Air pol- elevated particulate pollution, which present dif-
lution data were grouped regionally, primarily by ferent types of threats to health. It also presents
metropolitan and micropolitan areas. A relatively the number of days when ozone and/or particulate
small number of rural counties also have air pollu- pollution were elevated, a measure of how often
tion monitors and were included. residents have to breathe polluted air.
Air pollution was widespread in the United States in 2018 19That is equal to more than three months of the year in Another 157 million Americans resided in 264 large and
which ozone and/or fine particulate pollution was above small urban areas and in 61 rural counties that faced
the level that the EPA has determined presents “little to 31 to 100 days – a month or more – of elevated ozone
no risk.” (See Table 2.) These communities experienced and/or particulate pollution. Those places include the
more than 100 days with elevated ozone pollution, New York City region, with nearly 20 million residents,
elevated fine particulate pollution, or some combination and other major urban areas such as the Washington,
of both. D.C., Miami, and San Francisco regions. (See Table 3.)
Table 2. Ten most populated metropolitan areas with more than 100 days of elevated air pollution in 2018
Number of days in 2018 when half or more monitoring 2018
Metropolitan area locations reported elevated ozone and/or PM 2.5 population
Los Angeles-Long Beach-Anaheim, CA 156 13,291,486
Chicago-Naperville-Elgin, IL-IN-WI 113 9,498,716
Dallas-Fort Worth-Arlington, TX 106 7,539,711
Houston-The Woodlands-Sugar Land, TX 110 6,997,384
Atlanta-Sandy Springs-Roswell, GA 114 5,949,951
Phoenix-Mesa-Scottsdale, AZ 153 4,857,962
Riverside-San Bernardino-Ontario, CA 227 4,622,361
Detroit-Warren-Dearborn, MI 118 4,326,442
San Diego-Carlsbad, CA 160 3,343,364
Denver-Aurora-Lakewood, CO 131 2,932,415
Note: This count includes air pollution at or above the level the EPA labels “moderate,” indicated in yellow or worse in its Air Quality Index.
Table 3. Ten most populated metropolitan areas with 31 to 100 days of elevated air pollution in 2018
Number of days in 2018 when half or more monitoring 2018
Metropolitan area locations reported elevated ozone and/or PM 2.5 population
New York-Newark-Jersey City, NY-NJ-PA 71 19,979,477
Washington-Arlington-Alexandria, DC-VA-MD-WV 86 6,249,950
Miami-Fort Lauderdale-West Palm Beach, FL 42 6,198,782
Philadelphia-Camden-Wilmington, PA-NJ-DE-MD 85 6,096,372
Boston-Cambridge-Newton, MA-NH 33 4,875,390
San Francisco-Oakland-Hayward, CA 88 4,729,484
Seattle-Tacoma-Bellevue, WA 62 3,939,363
Minneapolis-St. Paul-Bloomington, MN-WI 74 3,629,190
Tampa-St. Petersburg-Clearwater, FL 58 3,142,663
Orlando-Kissimmee-Sanford, FL 43 2,572,962
20 Trouble in the AirNumber of days in 2018
when half or more monitoring
locations reported elevated
ozone and/or PM2.5
0 - 30
31 - 70
71 - 100
101 - 150
151 - 259
Areas without air pollution monitors
Figure 5. Both urban and rural areas experienced frequent ozone and/or particulate pollution in 2018
Smaller communities that experienced a month transportation has the biggest impact on ozone for-
or more of elevated air pollution include Racine, mation in the Boulder and Denver areas.103 (Denver
Wisconsin; Columbia, Missouri; and Billings, had 99 days of elevated ozone pollution.)
Montana.
70,000,000
Number of days with elevated ozone
pollution 60,000,000
Thirty-two large and small urban areas and six
rural counties – home to more than 21 million 50,000,000
Number of people
people – experienced more than 100 days of
40,000,000
ozone pollution in 2018. Frequent ozone pollu-
tion affected major urban areas such as Phoe- 30,000,000
nix, Arizona; Riverside, California; Las Vegas,
Nevada; and Salt Lake City, Utah. Smaller 20,000,000
communities plagued by frequent ozone pollu-
tion include Fort Collins and Boulder, Colo- 10,000,000
rado, and Laramie, Wyoming.
0
Pollution from transportation is a major 0-25 26-50 51-75 76-100 101-125 126-150 151-175 176+
Number of days of elevated smog and/or particulate pollution
contributor to ozone. In Phoenix, for example,
vehicles, including cars and light trucks, are
Figure 6. Number of people living in communities that experienced
the largest source of the pollution that turns elevated air pollution at various frequencies in 2018
into ozone.102 In Colorado, pollution from
Air pollution was widespread in the United States in 2018 21Table 4. Ten most populated metropolitan areas with more than 100 days of elevated ozone pollution in 2018
Number of days in 2018 when half or more monitoring 2018
Metropolitan area locations reported elevated ozone population
Phoenix-Mesa-Scottsdale, AZ 110 4,857,962
Riverside-San Bernardino-Ontario, CA 166 4,622,361
Las Vegas-Henderson-Paradise, NV 132 2,231,647
Salt Lake City, UT 111 1,222,540
Fresno, CA 137 994,400
Albuquerque, NM 123 915,927
Bakersfield, CA 178 896,764
Colorado Springs, CO 119 738,939
Ogden-Clearfield, UT 108 675,067
Provo-Orem, UT 104 633,768
Note: This count includes ozone pollution at or above the level the EPA labels “moderate,” indicated in yellow or worse in its Air Quality Index.
Oil and gas operations also have a major impact on Another 228 large and small urban areas and rural
air quality in some areas. For example, in the area counties experienced 31 to 100 days with elevated levels
from Boulder to Fort Collins, oil and gas opera- of ozone pollution in 2018. That means that for one to
tions produce more ozone-forming pollution than three months in 2018, up to 170 million Americans were
other any other source.104 exposed to elevated ozone pollution. Those rural coun-
ties, small communities and urban areas were located in
45 different states, plus the District of Columbia.
Number of days in 2018
when half or more monitoring
locations reported
elevated ozone
0 - 10
10 - 30
31 - 60
61 - 100
101 - 178
Areas without air pollution monitors
Figure 7. Frequency of ozone pollution in 2018
22 Trouble in the AirTable 5. Ten most populated metropolitan areas with more than 100 days of elevated particulate pollution in 2018
Number of days in 2018 when half or more monitoring 2018
Metropolitan area locations reported elevated PM2.5 population
Los Angeles-Long Beach-Anaheim, CA 135 13,291,486
Riverside-San Bernardino-Ontario, CA 154 4,622,361
San Diego-Carlsbad, CA 138 3,343,364
Cincinnati, OH-KY-IN 111 2,190,209
Austin-Round Rock, TX 108 2,168,316
Fresno, CA 157 994,400
Tulsa, OK 146 993,797
Bakersfield, CA 110 896,764
McAllen-Edinburg-Mission, TX 115 865,939
Stockton-Lodi, CA 183 752,660
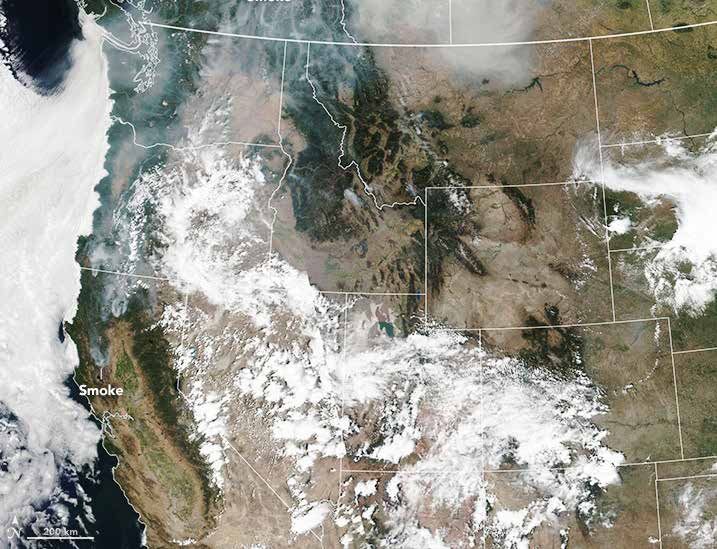
Number of days with elevated particulate Wildfires spread smoke across many western states in
pollution 2018, contributing to the high number of days with
Particulate pollution was a problem for more than 100 elevated fine particulate pollution in California, Wash-
days in 26 large and small urban areas that were home ington, Idaho and Montana.105 Oklahoma and Texas
to 34 million people during 2018. (See Table 5.) also experienced very active wildfire seasons in 2018.106
Number of days in 2018
when half or more monitoring
locations reported
elevated PM2.5
0 - 10
11 - 30
31 - 60
61 - 100
101 - 195
Areas without air pollution monitors
Figure 8. Frequency of fine particulate pollution in 2018
Air pollution was widespread in the United States in 2018 23Photo: NOAA
Plumes of smoke from wildfires spread across the western U.S. in this image from August 2018.
Communities in Illinois, Indiana, Ohio and Pennsyl- other combustion sources produce particulate pollution
vania also experienced more than 100 days of high and its precursors. Particulate pollution was frequently
particulate pollution in 2018. elevated in a number of smaller communities, where
wildfire smoke and wintertime wood-burning for heat
An additional 188 large and small urban areas and 20 result in particulate pollution.
rural counties, home to a total of 180 million Ameri-
cans, experienced 31 to 100 days of elevated particulate
pollution in 2018. The urban areas affected include Progress on air pollution has stalled
many of the nation’s largest metropolitan areas, such as Though air quality in the U.S. has improved over the
the New York, Chicago, Dallas-Fort Worth, and Hous- decades, in recent years that progress has slowed. The
ton regions, where diesel trucks, industrial activity, and U.S. Environmental Protection Agency calculates that
24 Trouble in the Airthe average level of ozone pollution dropped by 31
percent from 1980 to 2018 and that fine particu-
late pollution dropped by 34 percent from 2000 to
2018.107 However, the agency’s analysis of elevated
ozone and particulate pollution in 35 major cities
shows that the number of days of pollution was higher
in each of the years from 2015 through 2018 than it
was in 2013 or 2014.108 Furthermore, the agency’s data
show that 2018 had more days of pollution than each
of the previous five years.
The data analysis for this report reveals that the
increase in days of elevated air pollution means that
millions more Americans lived in areas with polluted
air in 2018 than in 2016.109
• More Americans lived in areas experiencing more
than 100 days of elevated pollution: In 2016,
56 large and small urban areas and four rural
counties, home to 73 million Americans, experi-
enced more than 100 days of degraded air quali-
ty.110 In 2018, 89 large and small urban areas and
12 rural counties, home to 108 million Americans,
had elevated pollution for this many days.
• More Americans dealt with frequent ozone pollu-
tion: In 2018, more than 21 million people lived
in areas where smog pollution was elevated for
more than 100 days. That is up from more than 8
million people living in such areas in 2016.
• Frequent particulate pollution also affected more
communities: while 21 communities, home to 21
million Americans, experienced more than 100
days of elevated particulate pollution in 2016,
the number rose to 26 communities, home to 34
million people, in 2018.
The snapshot comparison of data we analyzed for
2016 versus 2018 is not robust enough to indicate a
long-term trend in air quality in the U.S. Combined
with analysis by the EPA, however, it suggests progress
on air quality has stalled.
Air pollution was widespread in the United States in 2018 25Conclusion and
recommendations
A
ir pollution plagues metropolitan areas and • Support zero-emission vehicles. Eleven states
rural counties across the country. Millions of – California, Colorado, Connecticut, Maine,
Americans regularly breathe air that contains Maryland, Massachusetts, New Jersey, New York,
ozone or particulate pollution, which creates a risk to Oregon, Rhode Island and Vermont – already have
their health, including by damaging the lungs, rais- electric vehicle sales requirements.112 Elected officials
ing the risk of heart attack, and increasing the risk of in other states should establish a goal of having all
premature death. It also endangers the health of new new passenger vehicles sold be electric vehicles by
generations of children from birth onward. 2035 or sooner. States should also support the devel-
opment of infrastructure needed to recharge those
Evidence suggests that many aspects of air pollution vehicles. Transit agencies and school districts should
will be exacerbated by climate change. The problems replace buses powered by fossil fuels with electric
are intimately connected: The combustion of fossil buses and consider adopting goals to repower
fuels is a leading cause of both climate change and entire fleets with electricity over one replacement
air pollution. For example, transportation is the larg- cycle. Policies to encourage electrification of heavy-
est source of greenhouse gas emissions in the United duty trucks and nonroad equipment would help
States and also the largest source of nitrogen oxide to further reduce air pollution and limit global
pollution that causes ozone.111 A variety of solutions warming pollution. Both New York City and the
that improve air quality will also help prevent the worst state of California have committed to replacing all
impacts of global warming. transit buses with electric buses by 2040.113
To protect air quality and the health of all Americans, • Create a strong regional program to reduce trans-
and to reduce climate emissions and prevent the worst portation emissions under the Transportation
impacts of global warming, policymakers should reduce and Climate Initiative (TCI) in northeastern and
emissions from transportation, support a broad transi- mid-Atlantic states. The Transportation Climate
tion to clean energy, and raise standards for air quality. Initiative (TCI) is a proposed regional, cap-and-
Opportunities for doing so include: invest program intended to reduce carbon pollution
Reducing emissions from transportation. Highway from transportation. Policymakers in affected states
vehicles are a major source of air pollution. Pollution should support a strong program that includes:
from vehicles is also especially harmful, as vehicle emis- º Setting a cap to reduce transportation-sector
sions often occur in densely populated urban areas. emissions by at least 25 percent by 2032, incorpo-
Specifically, policymakers should: rating all transportation fuels.
26 Trouble in the Airº Requirements to auction 100% of allowances and global warming pollution over the lifetime of cars
reinvest auction revenue in programs to reduce sold from 2012 to 2025.117 These standards should
carbon pollution from the transportation sector. be implemented as planned and strengthened for
subsequent model years.
º Measures to ensure the integrity of the program
and prevent loopholes. • Support policies that can reduce driving and
increase walking, biking and the use of transit.
• Ensure that states can adopt and strengthen These forms of transportation can help lower
pollution standards for passenger vehicles. The both air pollution and global warming pollution,
federal Clean Air Act allows California to establish while providing additional proven health benefits
tighter pollution standards for passenger vehicles, associated with increased physical activity. Efforts
an acknowledgment of the state’s severe air pollu- to improve facilities for walking and biking can
tion problems and long history of air quality regula- make it safer and more appealing, helping to
tion. These clean car standards help to reduce encourage people to drive less. Frequent, reliable
global warming emissions and health-threatening transit service can attract more riders. For example,
air pollution from cars and trucks and have helped expanded light rail options and revamped bus
drive technological advances that have then led service in Seattle have helped boost transit rider-
to strengthening of federal air quality standards. ship, even as ridership has declined in many other
Federal law allows other states with air pollution cities.118 To expand active transportation and
problems to adopt California’s clean car standards transit use, states and cities should increase funding
instead of federal standards. Thirteen other states, for walking, biking and transit, shift funding away
plus the District of Columbia, have done so.114 These from new road construction, and support develop-
standards have been highly effective in reducing ment patterns that allow people to travel easily
pollution and are one reason cars, light trucks and without a car.
other passenger vehicles today are 98 to 99 percent
cleaner than vehicles sold in the 1960s.115 • Reduce pollution from all forms of transporta-
tion, including medium- and heavy-duty vehicles,
º The federal government should not jeopardize airplanes, railroads and marine vessels. Provide
the ability of states to protect public health. The incentives and mandates for zero- and reduced-
Trump administration is attempting to revoke emissions technologies.
California’s ability to establish strong pollution
standards for cars and light trucks.116 The admin- Supporting clean, renewable energy. Policymakers at
istration should not take away the ability of states all levels of government should work to support the
to develop policies that have been so important in rollout of renewable energy sources such as wind and
addressing pollution from passenger vehicles. solar power that can reduce air pollution emissions
from the production, transportation and burning of
º Additional states that suffer from poor air quality fossil fuels. Efforts should include enforceable com-
should adopt the clean car standards to better mitments to achieving high levels of renewable energy,
protect the health of their citizens. commitments to improve energy efficiency and reduce
• Maintain strong federal fuel economy and global energy use, and support for emerging technologies
warming pollution standards for transportation. including energy storage and offshore wind power.
The Trump administration has announced its inten- Already, eight states and many cities and counties have
tion to reconsider standards that, when fully phased adopted commitments to obtain all of their energy
in, would avoid emissions of 6 billion metric tons of from clean sources in the coming decades.119
Conclusion and recommendations 27You can also read