Studying the impact of biomass burning aerosol radiative and climate effects on the Amazon rainforest productivity with an Earth system model
←
→
Page content transcription
If your browser does not render page correctly, please read the page content below
Atmos. Chem. Phys., 19, 1301–1326, 2019
https://doi.org/10.5194/acp-19-1301-2019
© Author(s) 2019. This work is distributed under
the Creative Commons Attribution 4.0 License.

Studying the impact of biomass burning aerosol radiative and
climate effects on the Amazon rainforest productivity with an
Earth system model
Florent F. Malavelle1 , Jim M. Haywood1,2 , Lina M. Mercado3,4 , Gerd A. Folberth2 , Nicolas Bellouin5 , Stephen Sitch3 ,
and Paulo Artaxo6
1 CEMPS,   University of Exeter, Exeter, EX4 4QE, UK
2 UK Met Office Hadley Centre, Exeter, EX1 3PB, UK
3 CLES, University of Exeter, Exeter, EX4 4RJ, UK
4 Centre for Ecology and Hydrology, Wallingford, OX10 8BB, UK
5 Department of Meteorology, University of Reading, Reading, RG6 6BB, UK
6 Department of Applied Physics, Institute of Physics, University of São Paulo, São Paulo, Brazil

Correspondence: Florent F. Malavelle (f.malavelle@exeter.ac.uk)

Received: 3 September 2018 – Discussion started: 18 September 2018
Revised: 19 December 2018 – Accepted: 7 January 2019 – Published: 31 January 2019

Abstract. Diffuse light conditions can increase the effi-         +110 TgC yr−1 ), a reduction in the total amount of radia-
ciency of photosynthesis and carbon uptake by vegetation          tion (−52 to −105 TgC yr−1 ) which reduces photosynthesis
canopies. The diffuse fraction of photosynthetically active       and feedback from climate adjustments in response to the
radiation (PAR) can be affected by either a change in the         aerosol forcing which increases the efficiency of biochemi-
atmospheric aerosol burden and/or a change in cloudiness.         cal processes (+67 to +100 TgC yr−1 ). These results illus-
During the dry season, a hotspot of biomass burning on the        trate that despite a modest direct aerosol effect (the sum of
edges of the Amazon rainforest emits a complex mixture of         the first two counteracting mechanisms), the overall net im-
aerosols and their precursors and climate-active trace gases      pact of biomass burning aerosols on vegetation is sizeable
(e.g. CO2 , CH4 , NOx ). This creates potential for significant   when indirect climate feedbacks are considered. We demon-
interactions between chemistry, aerosol, cloud, radiation and     strate that capturing the net impact of aerosols on vegetation
the biosphere across the Amazon region. The combined ef-          should be assessed considering the system-wide behaviour.
fects of biomass burning on the terrestrial carbon cycle for
the present day are potentially large, yet poorly quantified.
Here, we quantify such effects using the Met Office Hadley
Centre Earth system model HadGEM2-ES, which provides              1   Introduction
a fully coupled framework with interactive aerosol, radia-
tive transfer, dynamic vegetation, atmospheric chemistry and      The Amazon rainforest is the largest expanse of tropical for-
biogenic volatile organic compound emission components.           est on Earth. It provides invaluable ecological services and
Results show that for present day, defined as year 2000 cli-      plays a major role in the Earth system and climate (Malhi
mate, the overall net impact of biomass burning aerosols          et al., 2008). The Amazon rainforest is a net sink of at-
is to increase net primary productivity (NPP) by +80 to           mospheric CO2 , although drought frequency and intensity,
+105 TgC yr−1 , or 1.9 % to 2.7 %, over the central Ama-          which are expected to increase in the future, could have se-
zon Basin on annual mean. For the first time we show that         vere consequences for future forest resilience and potentially
this enhancement is the net result of multiple competing ef-      shift the Amazon rainforest from a sink to a net source of at-
fects: an increase in diffuse light which stimulates photo-       mospheric CO2 (Cox et al., 2000, 2004; Phillips et al., 2009;
synthetic activity in the shaded part of the canopy (+65 to       Doughty et al., 2015; Duffy et al., 2015; Sakschewski et al.,

Published by Copernicus Publications on behalf of the European Geosciences Union.
1302                                  F. F. Malavelle et al.: Aerosol radiative and climatic effects on the Amazon rainforest

2016; Zemp et al., 2017). This possibility motivated intense        tosynthetically active radiation (PAR), traditionally defined
research to develop a better understanding of the rainfor-          as the radiation between wavelengths of 300 and 700 nm,
est response to environmental stresses via integrated explicit      reaching the surface and used by plants to photosynthesise
representations of the carbon cycle in Earth system mod-            (i.e. to assimilate carbon from the atmosphere). Contrary to
els (ESMs) (Cox et al., 2000). Response to many of these            intuition, an increase in the diffuse light fraction can be bene-
environmental stresses is now well documented and repre-            ficial to plants as the shaded, non-light-saturated leaves, typ-
sented in ESMs, including the effects of surface temperature,       ically found in the understory or lower canopy layers, re-
atmospheric composition, water availability, or the amount          ceive more radiation under diffuse light conditions than they
and quality of accessible light (direct versus diffuse) for plant   would normally experience under direct light conditions ow-
photosynthesis (e.g. Nemani et al., 2003; Sitch et al., 2007;       ing to the shading by leaves fully exposed to sunlight. As
Cox et al., 2008; Mercado et al., 2009a; Beer et al., 2010;         a result, this trade-off between experiencing less PAR over-
Ciais et al., 2013; Pacifico et al., 2015; Unger et al., 2017).     all and receiving more evenly distributed light across the
   In parallel to the above-mentioned environmental stresses,       canopy favours higher rates of canopy photosynthesis. The
forest fires are also an intrinsic component of some forest         first comprehensive estimation of this diffuse PAR fertilisa-
lifecycles, providing an additional mechanism for deplet-           tion effect (DFE) at the global scale was documented by Mer-
ing land carbon reservoirs. Intense biomass burning events          cado et al. (2009a), who used a combination of offline aerosol
present a notorious pressure on tropical regions and typically      distributions, radiative transfer and a land surface model to
occur during the dry season – i.e. between around August and        estimate that DFE may have increased the global land car-
September in the Amazon region (Artaxo et al., 2013; Brito          bon uptake by up to 25 % during the global dimming period
et al., 2014). Fires in general occur naturally; however, a sig-    (1950–1980; Stanhill and Cohen, 2001). More recently, Rap
nificant fraction results from the anthropogenic pressure that      et al. (2015) used a similar framework of offline models to as-
continually erodes the fragmented forest edges (Cochrane,           sess the role of BBA over the Amazon region. They showed
2003). Despite a decreasing trend in the rate of deforestation      that BBA increases the annual mean diffuse light and net pri-
over the last decade as a result of stricter environmental poli-    mary productivity (NPP) by 3.4 %–6.8 % and 1.4 %–2.8 %,
cies (Kalamandeen et al., 2018), it is estimated that 293 Tg        respectively. Strada and Unger (2016) took a step further
of carbon per year (TgC yr−1 ) is directly released back into       using a coupled modelling framework to estimate biomass
the atmosphere from fires in the Amazon (van der Werf et            burning aerosol impacts on Amazon forest GPP, obtaining
al., 2006). Fires can also have an indirect impact on the rain-     an increase of 2 %–5 % on annual means. Recently, Mor-
forest carbon budget that is harder to quantify; for instance,      eira et al. (2017) also applied a coupled framework using a
fires alter surface properties (e.g. albedo) in the burnt area,     regional model (BRAMS) to conclude that BBA could in-
which can modify surface fluxes and the water cycle (e.g.           crease the GPP of the Amazon forest by up to 27 % during
Zemp et al., 2017). Additionally, fires emit a complex mix-         the peak of the biomass burning season. The study of Mor-
ture of gases (CO2 , CO, CH4 , NOx and volatile organic com-        eira et al. (2017) assumed high BBA emissions and did not
pounds – VOCs), aerosols and aerosol precursors which can           account for the effect of cloudiness on the diffuse fraction
affect remote regions of the rainforest after being dispersed       of radiation, so it provides an upper estimate of the potential
by the wind. Pacifico et al. (2015) illustrated such a mech-        impact of the effects of the attenuation of total solar radiation
anism by analysing the potentially harmful effect of near-          and the enhancement of the diffuse solar radiation flux inside
surface ozone (O3 ) associated with biomass burning and es-         the vegetation canopy.
timated that the rainforest gross primary productivity (GPP)           Despite a growing body of evidence supporting the DFE
was reduced by up to approximately −230 TgC yr−1 , a num-           mechanism, both from observational and modelling perspec-
ber of similar magnitude to the direct carbon loss from fires.      tives (e.g. Cohan et al., 2002; Gu et al., 2003; Robock et
   Assessing the overall impact of Amazonian forest fires           al., 2005; Yamasoe et al., 2006; Mercado et al., 2009a; Kan-
on ecosystems is challenging as it encompasses a com-               niah et al., 2012; Cirino et al., 2014; Cheng et al., 2015), a
bination of direct losses and indirect impacts from the             full quantification of the BBA impact on ecosystems remains
fire by-products which can depend on intricate interactions         poor because aerosol–radiation interactions (ARI), and to
among several Earth system components, including the bio-           some extent aerosol–cloud interactions (ACI), not only cre-
sphere, atmospheric composition, radiation and energy bud-          ate the conditions for a DFE but also modify the climate
get, clouds, and the water cycle (Bonan, 2008). Here, we            locally. For example, a regional haze of aerosols can per-
aim to specifically elucidate the impact of biomass burn-           turb regional hydroclimates (Nigam and Bollasina, 2010),
ing aerosols (BBAs) that are associated with forest fires and       force clouds to adjust to aerosol semi-direct and indirect ef-
quantify their potential effect on the Amazon forest produc-        fects which modify the way clouds interact with radiation
tivity.                                                             (Hansen et al., 1997; Haywood and Boucher, 2000; Koren
   Significant amounts of BBAs are emitted in South Amer-           et al., 2004), or create a positive cooling effect on produc-
ica, which strongly modify the radiative budget by scattering       tivity by reducing surface heat stress in hot environments,
and absorbing solar radiation. This reduces the level of pho-       allowing for a more efficient uptake of atmospheric CO2

Atmos. Chem. Phys., 19, 1301–1326, 2019                                              www.atmos-chem-phys.net/19/1301/2019/
F. F. Malavelle et al.: Aerosol radiative and climatic effects on the Amazon rainforest                                     1303

through leaf stomata (Robock et al., 2005; Xia et al., 2016;      fully coupled framework. The model is briefly described in
Strada and Unger, 2016). Neglecting such essential coupling       Sect. 2.1.
pathways may overemphasise the relative contribution of the          We present the results of a sensitivity experiment (Sect. 3)
DFE due to loss of internal consistency that does not allow       which consists of varying the biomass burning aerosol emis-
variability within non-linear relationships. Only a limited       sions only over South America. “Real world” fires also emit
number of studies have considered the DFE within a fully          greenhouse gases (e.g. CO2 , CO, CH4 ) and ozone precur-
coupled Earth system framework (e.g. Strada and Unger,            sors (NOx , VOCs) which can potentially affect the biosphere.
2016; Unger et al., 2017; Yue et al., 2017, using the NASA        Ozone is particularly critical as it is a pollutant which harms
GISS ModelE2–YIBs) to investigate the role of aerosols and        plants and reduces their productivity, and thus their ability to
haze on vegetation. Although these studies have investigated      draw CO2 from the atmosphere (Sitch et al., 2007). Whereas
the role of diffuse radiation on GPP and isoprene emissions       the damaging effect of ozone is not accounted for in this
(Strada and Unger, 2016; Unger et al., 2017), understand-         study, we will briefly discuss the potential fertilisation ef-
ing of the indirect impact of climate effects from aerosols on    fect from the increased CO2 background that can result from
vegetation productivity remains very uncertain. This was ad-      biomass burning in Sect. 4. The ozone damage effect was
dressed over China by Yue et al. (2017), who demonstrated         documented by Pacifico et al. (2015) using a similar mod-
that aerosol-induced hydroclimatic feedbacks can promote          elling framework as in the present study, and we refer readers
ecosystem NPP. In the present study, we apply an ESM mod-         to that study for further details.
elling framework to quantify the impact of present-day BBA           Atmospheric particles such as aerosols and cloud droplets
via the quantification of individual and net effects of changes   scatter radiation, which increases the fraction of radiation
in diffuse radiation, direct radiation and climate upon the       that is diffuse. Diffuse conditions result in higher light use
vegetation productivity in the Amazon rainforest specifically.    efficiency of plant canopies, which can enhance carbon up-
For this endeavour, we have implemented an updated rep-           take (Roderick et al., 2001; Gu et al., 2002). An increase in
resentation of plant photosynthesis and carbon uptake that        diffuse radiation is concomitant with a decrease in the overall
is sensitive to diffuse light radiation in the UK Met Office      amount of radiation (Fig. S1 in the Supplement). These two
Hadley Centre HadGEM2-ES Earth system model (Mercado              opposing effects will be referred to in the rest of the paper
et al., 2007, 2009a). In addition, a framework that disentan-     as “change in diffuse fraction” and “reduction in total PAR”,
gles the vegetation response has been developed to provide a      respectively, and will be quantified separately in Sect. 3.3.
deeper understanding of the contributions of different plant      Finally, BBA effects impact the coupled system, which con-
environmental variables affected by aerosols. The role of O3      trols the rate of biochemical processes of vegetated land sur-
precursor emissions and in situ formation of O3 associated        faces itself. We will simply refer to these adjustments to the
with biomass burning (Pacifico et al., 2015) is not considered    BBA effects as “climate feedback” in the remainder of the
here.                                                             paper. The sum of climate feedback, change in diffuse frac-
   The methodology and the experimental set-up are de-            tion and reduction in total PAR is referred as the “net impact”
scribed in Sect. 2. Results are discussed in Sect. 3, includ-     of BBA on plant productivity. The framework we developed
ing first a model evaluation in Sect. 3.1, then the net ef-       to disentangle these three terms is described in Sect. 2.4.
fect of BBA in Sect. 3.2, and individual contributions from
the diffuse light fraction, the reduction in total PAR and the    2.1   Model description
climate feedbacks associated with the BBA perturbation in
Sect. 3.3. These findings are contextualised in Sect. 3.4 by      HadGEM2-ES is an Earth system model built around the
analysing the results from four additional sensitivity experi-    HadGEM2 atmosphere–ocean general circulation model and
ments designed to elucidate the role of aerosol optical prop-     includes a number of Earth system components such as
erties, aerosol–cloud interactions, the atmospheric CO2 con-
centration and vertical distribution of nitrogen through the        – the ocean biosphere Diat-HadOCC (Diatom-Hadley
canopy. Concluding remarks and a summary of this study’s              Centre Ocean Carbon Cycle) model, developed from the
main results are provided in Sects. 4 and 5, respectively.            HadOCC model of Palmer and Totterdell (2001);

                                                                    – the sea ice component (The HadGEM2 Development
                                                                      Team, 2011);
2   Method
                                                                    – the Top-down Representation of Interactive Foliage and
We evaluate the effects of biomass burning aerosol–radiation          Flora Including Dynamics (TRIFFID) dynamic global
interactions upon the Amazon rainforest primary productiv-            vegetation model (Cox, 2001), and the land surface and
ity for present-day conditions using the Met Office Hadley            carbon cycle model MOSES2 (Met Office Surface Ex-
Centre Global Environment Model HadGEM2-ES (The                       change Scheme), collectively known as JULES (Cox et
HadGEM2 Development Team, 2011), which provides a                     al., 1998, 1999; Essery et al., 2003);

www.atmos-chem-phys.net/19/1301/2019/                                              Atmos. Chem. Phys., 19, 1301–1326, 2019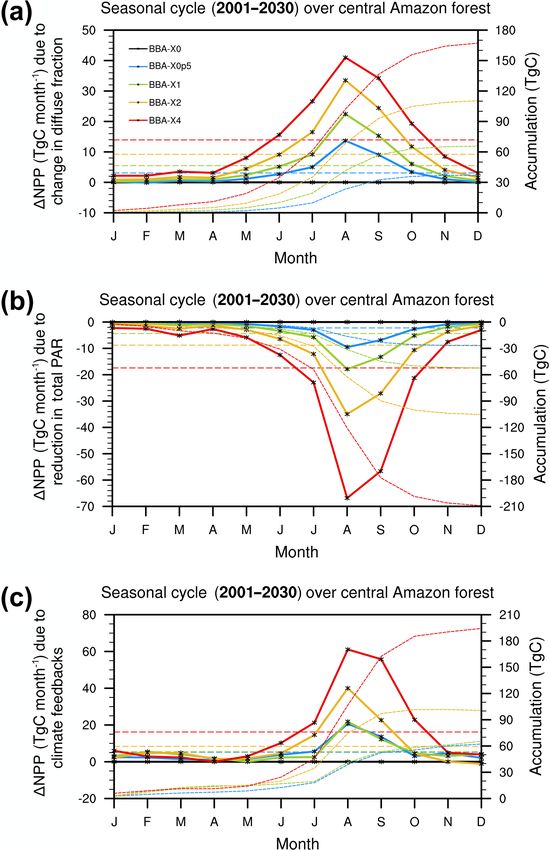
1304                                  F. F. Malavelle et al.: Aerosol radiative and climatic effects on the Amazon rainforest

  – the interactive Biogenic Volatile Organic Compounds             available during the HadGEM2-ES contribution to CMIP5.
    (iBVOC) emission model (Pacifico et al., 2012);                 HadGEM2-ES with the previous canopy radiation scheme
                                                                    had a tendency to overestimate GPP (Shao et al., 2013),
  – the UKCA tropospheric chemistry scheme (O’Connor
                                                                    which has to be balanced by high plant respiration (RESP)
    et al., 2014).
                                                                    to get satisfactory estimates of global NPP (i.e. NPP = GPP-
   The atmospheric model resolution is N96 (1.875◦ by               RESP). The new representation of light interception that we
1.25◦ ) with 38 vertical levels with the model top at ∼ 39 km.      have implemented is able to reproduce higher light use ef-
Our modelling framework is similar to the configuration used        ficiency (LUE) under diffuse light conditions (Sect. 3.1 and
by Pacifico et al. (2015), who provided a detailed analysis of      Fig. S2 in the Supplement). However, the ratio of GPP to
the successful model performance against observations.              plant respiration in HadGEM2-ES with the new canopy radi-
   For clarity, we provide some additional details on the treat-    ation model remains too high when compared to observation-
ment of aerosols and their coupling with radiation and clouds       ally based estimates (e.g. Luyssaert et al., 2007). To correct
as well as on the updated representation of the canopy in-          this deficiency, we decreased the ratio of nitrogen allocated
teraction with radiation. The radiative transfer code in the        in the roots relative to the nitrogen in the leaves from 100 %
atmospheric part of HadGEM2-ES is SOCRATES (Edwards                 to 50 % (Clark et al., 2011, Table 2 therein). Additionally,
and Slingo, 1996), which parameterises radiative fluxes using       we reduced the leaf dark respiration coefficient that relates
a “two-stream” approximation (Meador and Weaver, 1980).             leaf dark respiration and Vcmax from 15 % to 10 % (Clark
The radiative transfer is solved for six wavebands in the           et al., 2011, Eq. 13 therein). These changes are based on a
shortwave and nine in the longwave. This scheme accounts            sensitivity analysis that we performed with the stand-alone
for the interaction of radiation with aerosol particles by defin-   version of JULES. We used the meteorological observations
ing three single scattering properties on a layer: optical depth,   from the tropical French Guiana site (assumed to be fully
single scattering albedo (the ratio of scattering efficiency        covered by broadleaf trees) to drive JULES and investigate
to total extinction) and an asymmetry parameter. Together,          the sensitivity to parameters such as the leaf nitrogen content
these properties determine the overall transmission and re-         at canopy top (NL0 ), the dark respiration coefficient and the
flection coefficients of each atmospheric layer. At the inter-      nitrogen allocation throughout the canopy via the value of
face between the lowest atmospheric level and the land sur-         the nitrogen profile extinction coefficient (Clark et al., 2011,
face, the total and the direct radiances for the shortwave band     Eq. 33 therein and Sect. 2.3.4 of the present study). Fast car-
320–690 nm, which approximates the PAR, calculated by the           bon fluxes (GPP, RESP and NPP) were calculated at a 3 h
SOCRATES radiation scheme are transferred to the land sur-          temporal resolution by varying one of these three parame-
face routines to calculate plant photosynthesis.                    ters individually (Fig. S3a–c) and then averaged to annual
   In the JULES land surface model, the total and direct ir-        mean values (Fig. S3d–f). The annual means were then used
radiance components of PAR calculated by the atmospheric            to construct contour surfaces for the fast carbon fluxes by
model provide the boundary conditions at the top of the             varying combinations of the selected parameters (Fig. S4).
canopy. The diffuse PAR fraction is calculated as the differ-       This method enables us to ultimately pre-calibrate the fast
ence between total and direct radiation, divided by the total       carbon fluxes in the HadGEM2-ES model offline.
radiation. The canopy is discretized into 10 vertical layers,          Aerosols are represented by the CLASSIC aerosol scheme
and the radiative transfer in the canopy is also parameterised      (Bellouin et al., 2011) which is a one-moment mass prog-
with a two-stream approximation but uses more detailed as-          nostic scheme. This aerosol module contains numerical rep-
sumptions to represent light interception by foliage (Sellers,      resentation of up to eight tropospheric aerosol species. Here,
1985). The photosynthesis model is based upon the observed          ammonium sulfate, mineral dust, sea salt, fossil fuel black
processes of gas and energy exchange at the leaf scale, which       carbon (FFBC), fossil fuel organic carbon (FFOC), biomass
are then scaled up to represent the canopy. It takes into ac-       burning aerosols and secondary organic (also called bio-
count variations in direct and diffuse radiation on sunlit and      genic) aerosols are considered. Dust and sea salt are from
shaded canopy photosynthesis at each canopy layer. In this          diagnostic schemes based on the near-surface wind speed,
way, photosynthesis of sunlit and shaded leaves is calculated       while other emissions including biogenic aerosols are rep-
separately under the assumption that shaded leaves receive          resented by a relatively simple climatology (Bellouin et al.,
only diffuse light and sunlit leaves receive both diffuse and       2011). Transported species experience boundary layer and
direct radiation (Dai et al., 2004; Clark et al., 2011). Leaf-      convective mixing and are removed by dry and wet deposi-
level photosynthesis is calculated using the biochemistry of        tion. Wet deposition by large-scale precipitation is corrected
C3 and C4 photosynthesis from Collatz et al. (1991, 1992).          for re-evaporation of precipitation: tracer mass is transferred
   This canopy radiation scheme was first developed to quan-        from a dissolved mode to an accumulation mode in propor-
tify the impact of anthropogenic aerosol emissions on the           tion to re-evaporated precipitation. For convective precipita-
global carbon cycle (Mercado et al., 2007, 2009a) and               tion, accumulation mode aerosols are removed in proportion
was consequently implemented in JULES (Clark et al.,                to the simulated convective mass flux. Emissions of biomass
2011). It is a novel addition to HadGEM2-ES as it was not           burning aerosols are the sum of the biomass burning emis-

Atmos. Chem. Phys., 19, 1301–1326, 2019                                              www.atmos-chem-phys.net/19/1301/2019/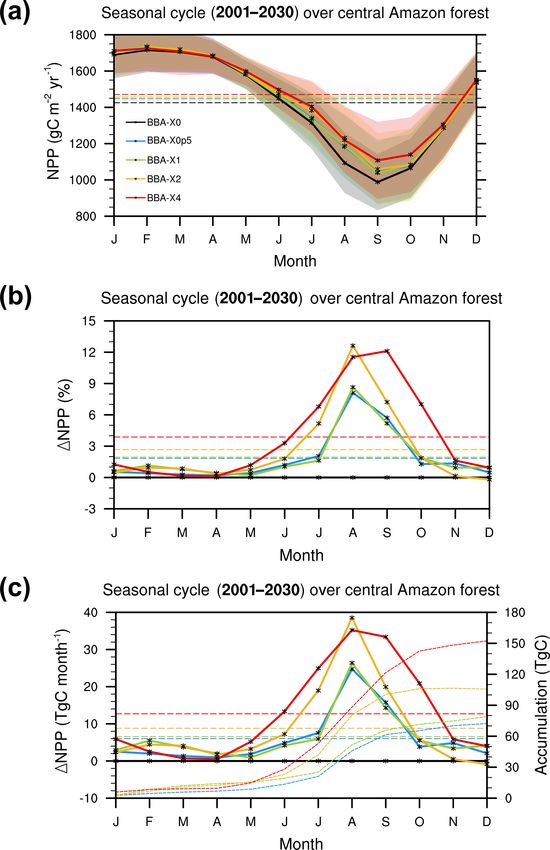
F. F. Malavelle et al.: Aerosol radiative and climatic effects on the Amazon rainforest 1305
sions of black and organic carbon. Grass fire emissions are 30 years in order to maintain the vegetation in a steady state.
assumed to be located at the surface, while forest fire emis- A similar approach is discussed in Strada and Unger (2016).
sions are injected homogeneously across the boundary layer Overall, this enables us to focus our analysis on the fast car-
(0.8–2.9 km). bon flux responses (i.e. NPP, GPP) and their sensitivity to the
The direct radiative effect due to scattering and absorption perturbation induced by the biomass burning aerosols.
of radiation by all eight aerosol species represented in the Aerosols and their precursor emissions are the dataset used
model is included. The semi-direct effect, whereby aerosol during CMIP5 (Lamarque et al., 2010). We use the decadal
absorption tends to change cloud formation by warming the mean emissions centred around the year 2000 to represent
aerosol layer, is thereby included implicitly. Wavelength- present-day emission rates. Biogenic volatile organic com-
dependent specific scattering and absorption coefficients are pound (BVOC) emissions from vegetation (Pacifico et al.,
obtained using Mie calculations from prescribed size dis- 2012) are sensitive to changes in plant productivity and hence
tributions and refractive indices. All aerosol species except sensitive to DFE. These emissions are calculated online but
mineral dust and fossil fuel black carbon are considered are not taken into account in the CLASSIC aerosol scheme.
to be hydrophilic, act as cloud condensation nuclei, and Instead, the climatology of BVOCs (also called secondary
contribute to both the first and second indirect effects on organics) from CMIP5 is used. The biomass burning emis-
clouds, treating the aerosols as an external mixture. Jones sions are based on the GFEDv2 inventory (van der Werf
et al. (2001) detailed the parameterization of the indirect ef- et al., 2006; Lamarque et al., 2010). Given the substantial
fects used in HadGEM2-ES. The cloud droplet number con- inter-annual variability of biomass burning on a global and
centration (CDNC) is calculated from the number concentra- regional scale, a present-day climatology (i.e. average year)
tion of the accumulation and dissolved modes of hygroscopic is calculated as the GFEDv2 1997–2006 average (Lamarque
aerosols. For the first indirect effect, the radiation scheme et al., 2010). These are the standard emission scenarios for
uses the CDNC to obtain the cloud droplet effective radius. the simulation labelled as BBAx1 for the main experiment.
For the second indirect effects, the large-scale precipitation A total of five simulations are conducted in the main experi-
scheme uses the CDNC to compute the auto-conversion rate ment where the standard biomass burning aerosols emissions
of cloud water to rainwater (Jones et al., 2001). are varied by −100 %, −50 %, 0 %, +100 % and +300 %,
respectively (simulation BBAx0, BBAx0.5, BBAx1, BBAx2
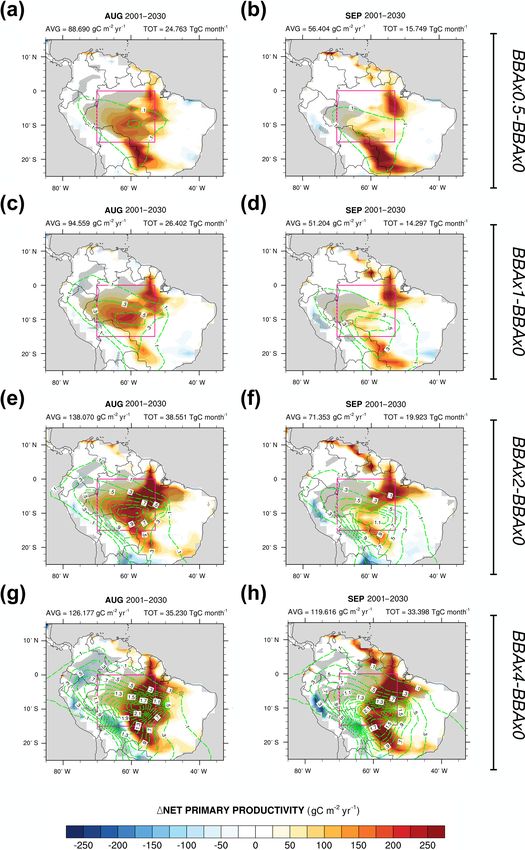
2.2 Experimental design: main experiment and BBAx4, respectively). A multiplication factor is applied
to the emission only for the BB sources over South America
The HadGEM2-ES model was initiated on 1 December 2000 (40◦ S, 85◦ W; 15◦ N, 30◦ W). We define the control simula-
from a previous historical simulation. We consider the year tion as the simulation without BBA being emitted over South
2000 to be a good surrogate for present-day climate, which America (i.e. BBAx0). The changes in fast carbon fluxes
will enable us to assess the impact of present-day BBA are calculated as the departure from this reference simula-
emissions on vegetation. As historical simulations are tran- tion (e.g. 1 NPPBBAx1
net impact = NPP
BBAx1 − NPPBBAx0 and rep-
sient climate simulations, we constrain the carbon cycle to resents the net change in NPP due to standard emissions of
present-day values as well (to be described in the next para- BBA).
graph). The model is then integrated for a period of 40 years
using periodic forcing for the year 2000 to construct an 2.3 Sensitivity experiments
ensemble that captures the model internal variability. Re-
sults reported here are the multi-annual means over the final In parallel to the five simulations for the main experiment,
30 years of the model integration. The domain of analysis we have conducted the following four additional sensitivity
is defined by the coordinates 0–15◦ S, 70–53◦ W and is pri- experiments to further appreciate the role of (i) aerosol opti-
marily covered by broadleaf trees for this configuration of cal properties, (ii) aerosol–cloud interactions, (iii) the canopy
HadGEM2-ES (Fig. S5). nitrogen profile and (iv) atmospheric carbon dioxide concen-
The HadGEM2-ES model is set-up in an Atmospheric tration. A listing of the simulations done for the main exper-
Model Intercomparison Project (AMIP; Jones et al., iment and the sensitivity experiments is provided in Table 1.
2011) type configuration using prescribed climatologies of
monthly mean sea surface temperatures (SSTs) and sea ice 2.3.1 Aerosol optical properties
cover (SIC), which enables us to analyse the rapid adjust-
ments of land surface climate to aerosol radiation perturba- The representation of BBA in HadGEM2-ES is based on
tions. The introduction of a new canopy radiation interac- the measurements collected during the SAFARI 2000 cam-
tion model introduces a significant departure in the carbon paign near South Africa (Abel et al., 2003; Bellouin et al.,
cycle balance. To prevent the need of a complex spin-up ex- 2011). It describes the size distribution of BBA as an exter-
ercise, we prescribe the vegetation cover and carbon reser- nal mixture of two mono-modal smoke species. For the fresh
voirs to present-day level. This is achieved by reducing the smoke, a log-normal distribution with a median geometrical
call frequency of the TRIFFID dynamic vegetation model to radius (r), r = 0.1 µm, and a geometric standard deviation
www.atmos-chem-phys.net/19/1301/2019/ Atmos. Chem. Phys., 19, 1301–1326, 2019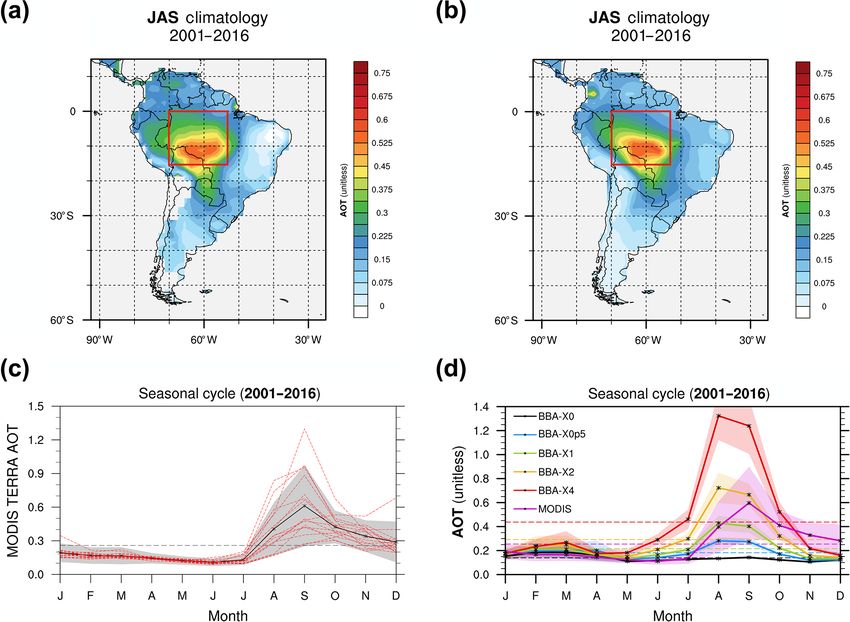
1306 F. F. Malavelle et al.: Aerosol radiative and climatic effects on the Amazon rainforest
(σ ), σ = 1.30, are assumed. For aged smoke, r = 0.12 µm
Table 1. List of model simulations done for the five experiments.
Present-day BBA emissions
and σ = 1.30. Fresh biomass smoke is converted to aged
over South America smoke at an exponential rate assuming an e-folding time of
6 h, which typically accounts for the ageing of the smoke
BBA emissions
Quadruple the
BBA emissions
Double the
emissions
Standard BBA
BBA emissions
Half the
emission
no BBA
Control runs, i.e.
plume due to condensation of chemical species (e.g. sulfate
or organic compounds; Abel et al., 2003). Optical proper-
ties for the two modes are calculated a priori (i.e. offline)
using Mie theory for various levels of relative humidity (RH)
to account for hygroscopic growth. These optical properties
BBAx4
BBAx2
BBAx1
BBAx0.5
BBAx0
vegetation
emissions on
Impact of BBA
experiment
Main
– specific extinction, absorption coefficients and asymmetry
parameter – are then prescribed in the HadGEM2-ES radia-
tive transfer look-up table of optical properties.
BBA optical properties may vary significantly depending
on the type of vegetation burnt, combustion regime and the
–
BBAx2DIFF_OP
BBAx1DIFF_OP
–
BBAx0DIFF_OP
BBA
scattering
More
meteorological conditions (Reid et al., 2005). Many obser-
vational campaigns since SAFARI 2000 have reported more
aerosol optical properties
Sensitivity experiment:
absorbing BBA in other regions of the world (e.g. Johnson et
al., 2008, 2016). Even at the regional scale, variation in BBA
optical properties may occur. For example, aircraft obser-
vations in Brazil during SAMBBA show that flaming com-
–
BBAx2ABS_OP
BBAx1ABS_OP
–
BBAx0ABS_OP
BBA
absorbing
More
bustion associated with Cerrado burning in the eastern re-
gions produces more BC and less organic aerosol, and there-
fore a more absorbing BBA, while smouldering forest burn-
ing in the west produces a less absorbing BBA (Johnson et
al., 2016). The degree of aerosol absorption is characterised
–
BBAx21stAIE
BBAx11stAIE
–
BBAx01stAIE
radius (1stAIE)
affect cloud effective
Aerosols only
by the single scattering albedo (SSA), which is the ratio of
aerosol–cloud interactions
aerosol scattering over aerosol extinction. BBAs with low
Sensitivity experiment:
SSA (e.g. ∼ 0.80) absorb more solar radiation than BBAs
with higher SSA (e.g. ∼ 0.90). This can have implications
from the vegetation perspective as a layer made of absorb-
ing BBA would transmit less radiation to the surface than a
–
BBAx2noAIE
BBAx1noAIE
–
BBAx0noAIE
No AIE
layer made of a more scattering BBA, limiting the amount
of energy available for photosynthesis. In this experiment,
we investigate this aspect by varying BBA SSA by ±10 %
by scaling the specific scattering (Ksca in m2 kg−1 ) and ab-
sorption (Kabs in m2 kg−1 ) coefficients (Ksca in m2 kg−1 ) di-
–
BBAx2Steep_N
BBAx1Steep_N
–
BBAx0Steep_N
the canopy
profile in
Steeper nitrogen
canopy nitrogen profile
Sensitivity experiment:
rectly in the look-up tables, ensuring that specific extinction
remains constant. The asymmetry parameter is assumed to
be unaffected. Dry BBA optical properties at 550 nm for the
aged smoke are reported in Table 2.
For this sensitivity experiment, the BBAx0, BBAx1 and
BBAx2 simulations are rerun twice, once assuming a more
absorbing BBA and once assuming a more scattering BBA
–
BBAx2+25 ppm
BBAx1+25 ppm
–
BBAx0+25 ppm
CO2
atmospheric
+25 ppm of
atmospheric CO2 concentration
(simulations labelled BBAx0DIFF_OP , BBAx1DIFF_OP and
Sensitivity experiment:
BBAx2DIFF_OP for the diffuse case and BBAx0ABS_OP ,
BBAx1ABS_OP and BBAx2ABS_OP for the absorbing case,
respectively). Figure S6 in the Supplement shows how
HadGEM2-ES simulates the ambient SSA of BBA (Fig. S6a)
–
BBAx2+50 ppm
BBAx1+50 ppm
–
BBAx0+50 ppm
CO2
atmospheric
+50 ppm of
and of all aerosols (Fig. S6b) after modifying the BBA op-
tical properties. Figure S6c shows that the amount of direct
PAR is unaffected as expected because of the constraint im-
posed on Kext . In the higher SSA case (i.e. more diffusing
BBA), the amount of diffuse PAR reaching the surface is
increased, resulting in a higher amount of total PAR which
contrasts with the lower SSA case.
Atmos. Chem. Phys., 19, 1301–1326, 2019 www.atmos-chem-phys.net/19/1301/2019/
F. F. Malavelle et al.: Aerosol radiative and climatic effects on the Amazon rainforest                                           1307

Table 2. Dry (relative humidity is 0 %) optical properties at 550 nm for the aged smoke biomass burning aerosols.

                                                Kext (m2 kg−1 )    Kabs (m2 kg−1 )    Ksca (m2 kg−1 )    SSA
                            Scattering BBA         5.073 × 10³         9.191 × 10²        4.154 × 10³    0.99
                            Standard BBA           5.073 × 10³         4.575 × 10²        4.615 × 10³    0.91
                            Absorbing BBA          5.073 × 10³       5.074 × 10⁻¹         5.072 × 10³    0.82

2.3.2   Aerosol–cloud interactions                                      canopy; Mercado et al., 2009b; Lloyd et al., 2010; Dewar et
                                                                        al., 2012).
Clouds critically affect the amount of radiation reaching                  Nitrogen limitation and the nitrogen cycle are not yet rep-
the surface (e.g. Roderick et al., 2001; Cohan et al., 2002;            resented explicitly in HadGEM2-ES but will be in future ver-
Pedruzo-Bagazgoitia et al., 2017). Aerosols have the poten-             sions of this Earth system model (i.e. UKESM1). Presently,
tial to alter cloud properties (i.e. how they interact with ra-         nitrogen allocation at the leaf level (NLeaf ) within the canopy
diation; Haywood and Boucher, 2000) and hence alter sur-                is represented via an exponential profile in the land surface
face radiation. This experiment aims to address whether                 code of HadGEM2-ES, that is
aerosols can affect vegetation productivity indirectly by in-
                                                                        NLeaf (L) = NL0 e−KN L ,                                    (1)
teracting with clouds. Although aerosol–cloud interactions
remain very challenging to represent in ESMs (Ghan et al.,              where L is the leaf-level leaf area index, NL0 is the nitro-
2016; Malavelle et al., 2017), we will investigate whether the          gen concentration at canopy top (in kgN kgC−1 ) and KN is
representation of these processes in the ESM used here can              a dimensionless constant representing the steepness of the
have a detectable impact over the region considered in this             nitrogen profile. A shallow nitrogen profile (KN = 0.128) is
study. The BBAx0, BBAx1 and BBAx2 simulations are done                  the JULES default (Mercado et al., 2007) and is assumed
twice. In the first set of simulations (labelled BBAx01stAIE ,          in HadGEM2-ES for the main experiment. For this sensi-
BBAx11stAIE and BBAx21stAIE ), aerosols impact on pre-                  tivity experiment, we investigate the consequence of assum-
cipitation efficiency is switched off (i.e. no second aerosol           ing a steeper nitrogen profile (KN = 0.5). Under these condi-
indirect effect, 2ndAIE, through alteration of liquid water             tions, one might expect lesser light use efficiency under dif-
path via auto-conversion) but can still modify cloud albedo             fuse light conditions as shaded leaves become nitrogen lim-
by altering the cloud droplet effective radius (i.e. the first          ited (Hikosaka, 2014). We rerun the BBAx0, BBAx1 and
aerosol indirect effect, 1stAIE). In the second set of simula-          BBAx2 simulations using the steeper nitrogen profile (la-
tions (labelled BBAx0noAIE , BBAx1noAIE and BBAx2noAIE ),               belled BBAx0STEEP_N , BBAx1STEEP_N and BBAx2STEEP_N ,
all aerosol indirect effects are switched off. As turning off           respectively).
AIE reverts back CDNC to prescribed values, the BBA ef-                    To derive a new parameter value of KN which still pro-
fect on vegetation will be calculated as a difference between           vides consistent global NPP fluxes, we repeated the offline
simulations with the same indirect effect configuration (e.g.           analysis described in Sect. 2.1. We used JULES to perform
BBAx11stAIE –BBAx01stAIE ).                                             1-D simulations of a tropical site with varying combinations
                                                                        of the KN and NL0 parameters to derive biochemical fluxes
2.3.3   Canopy nitrogen profile                                         (Fig. S4b–c). The parameter combinations were chosen such
                                                                        that the mean canopy carboxylation rate (Vcmax,25,C ) is con-
                                                                        servative and remained at the same level as in the main exper-
Photosynthesis not only requires light, CO2 and water but               iment (i.e. about 27 µmol CO2 m−2 s−1 for broadleaf trees).
also nutrients that are essential in the chemistry cycles of            With nitrogen allocation being represented by an exponen-
photosynthesis. Nitrogen can be considered the most criti-              tial decay, the mean canopy Vcmax,25,C can be calculated as
cal of those nutrients and could act as a bottleneck for plant          follows:
photosynthesis (e.g. Bonan, et al., 2011; Ciais et al., 2014;
                                                                                              1 − e−KN LAI

Fernández-Martínez et al., 2014; Wieder et al., 2015; Houl-
ton et al., 2015; Zaehle et al., 2015). Optimisation arguments          Vcmax,25,C = ne NL0                  ,                     (2)
                                                                                                KN LAI
suggest that, in order to maximise the rates of carboxylation
and the rate of transport of photosynthetic products, nitrogen          where LAI is the leaf area index at canopy level, ne
resources should be allocated at the top of the canopy (i.e. a          is a constant that has values of 0.0008 and 0.0004 mol
steep decrease in the nitrogen profile) where light absorption          CO2 m−2 s−1 kgC (kgN)−1 for C3 and C4 plants, respectively
is maximum (Alton and North, 2007). However, observa-                   (Mercado et al., 2007).
tions support a more even allocation of the nitrogen resources
(i.e. a shallow decrease in the nitrogen profile throughout the

www.atmos-chem-phys.net/19/1301/2019/                                                     Atmos. Chem. Phys., 19, 1301–1326, 2019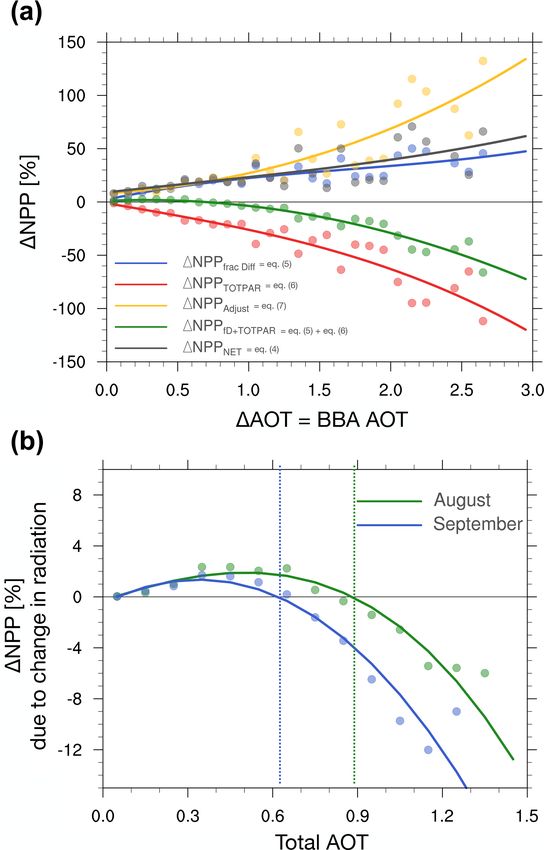
1308                                  F. F. Malavelle et al.: Aerosol radiative and climatic effects on the Amazon rainforest

2.3.4    Atmospheric CO2 concentration                              each model time step, we diagnose four surface fluxes of
                                                                    PAR which are the total and direct PAR, considering or ex-
It is hypothesised that in a richer CO2 world, rates of photo-      cluding the aerosol radiative effects. This is achieved by call-
synthesis would increase and in addition plants could afford        ing the radiative transfer routines twice (i.e. a double call)
a reduced stomatal opening to fix the same amount of CO2 ,          within the same model time step, i.e. first call with the aerosol
resulting in a higher water use efficiency which should fur-        radiative effects considered and second call assuming “clean-
ther enhance plant productivity – the so-called CO2 fertilisa-      sky” conditions where the radiative effects of aerosols are
tion effect (e.g. Keenan et al., 2013). As stated earlier, fires    not considered (Ghan, 2013). Note that the effect of clouds
do not only release aerosol particles but also CO2 , amongst        on the radiative fluxes are always considered during the two
other gases, which locally increases background CO2 levels          calls. The next model iteration (i.e. the prognostic call) al-
(e.g. Wittenberg et al., 1998). Additionally, it is expected that   ways includes the aerosol radiative effects in order to ac-
the rise in atmospheric CO2 will continue given current pro-        count for their impact on the atmospheric state. That means
jections of anthropogenic emissions (O’Neill et al., 2016).         that the calculation of vegetation processes which occurs af-
The details of the CO2 fertilisation effect are complex be-         ter the radiative transfer will always “see” the climate that
cause environmental changes occur simultaneously (e.g. van          has been modified by the aerosols. After the radiative trans-
der Sleen et al., 2015; Zhu et al., 2016). It would be far be-      fer calculations, the four fluxes of PAR that were calculated
yond the scope of this study to fully characterise the CO2          are passed to the physiology routines of JULES to calcu-
fertilisation effect strength in HadGEM2-ES, but it is cer-         late plant productivity. Prior to calculating the biochemical
tainly of interest to evaluate if the effect of aerosols on veg-    fluxes, we define two values of fd and TotPAR using the four
etation through alteration of the surface PAR differs when          PAR fluxes previously introduced; one that considers the ef-
the atmospheric background CO2 is varied. For this experi-          fect of aerosols (fd .aer and TotPAR.aer) and one that consid-
ment, the BBAx0, BBAx1 and BBAx2 simulations are done               ers clean-sky conditions (fd .clean and TotPAR.clean).
twice: once with the level of background CO2 increased by              The physiology routines are then called three times (i.e.
+25 ppm globally and once with an increase of +50 ppm               a triple call, see Table 3) within the same model time step.
globally. Increments of +25 and +50 ppm should be rep-              On the first call, both the reduction in total PAR and the
resentative of the CO2 level expected in 12.5 and 25 years,         change in diffuse fraction are ignored (i.e. the vegetation only
respectively, if one assumes a 2 ppm yr−1 increase (as sup-         sees the climate feedback). The biochemical fluxes calcu-
ported by the mean rate of CO2 increase measured at Mauna           lated during this first call are saved in a specific model di-
Loa for the period 2000–2010).                                      agnostic (NPPBBAxx
                                                                                    clim.aer,TotPAR.clean,fd .clean ). On the second call,
                                                                    the reduction in total PAR due to aerosols is then considered,
2.4     A framework to analyse the changes in fast carbon           but the change in diffuse fraction of PAR is not accounted
        fluxes                                                      for, and a new set of biochemical fluxes are saved in a spe-
                                                                    cific model diagnostic (NPPBBAxx clim.aer,TotPAR.aer,fd .clean ). For the
As stated previously, aerosols can affect photosynthetic rates
                                                                    last prognostic call, both aerosol effects on reduction in total
through different pathways (e.g. Bonan, 2008 and Fig. S7).
                                                                    PAR and the change in diffuse fraction are taken into account
Firstly, by altering the amount of light (the reduction in to-
                                                                    in the calculation of the biochemical fluxes and saved in a
tal PAR) and light quality (the change in diffuse fraction of
                                                                    specific model diagnostic (NPPBBAxx  clim.aer,TotPAR.aer,fd .aer ).
PAR). Secondly, aerosols interact with radiation and clouds
                                                                       With these new diagnostics available, we are able to isolate
impacting the climate directly and indirectly which affects
                                                                    the impacts of change in diffuse fraction, reduction in total
the radiative balance therefore the energy budget, forcing the
                                                                    PAR and climate feedback by comparing model simulations
coupled system to adjust to the aerosol perturbations. These
                                                                    which include or exclude the BBA emissions. For instance,
adjustments (the climate feedback) can feedback into the cal-
                                                                    the effect of BBA in the BBAx1 simulation (i.e. the standard
culations of the rate of vegetation biochemical processes –
                                                                    emissions scenario) can be expressed as follows:
e.g. by altering the surface temperature. A simple theoretical
framework can be used to discriminate a fast carbon flux, e.g.             BBAx1              BBAx1            BBAx0
                                                                    1NPPnet impact = NPP               − NPP                             (4)
NPP, as a function of the diffuse fraction, fd , the total PAR,                             BBAx1       BBAx1        BBAx1
TotPAR, and the climate feedback, clim, such as NPP(fd ,                              ∼
                                                                                      = 1NPPfd    + 1NPPTotPAR + 1NPPclim
TotPAR, clim). Neglecting the interdependency between the           with
three terms enables the following decomposition:                            BBAx1

                                                                                         BBAx1
                                                                    1NPPfd          = NPPclim.aer,TotPAR.aer,fd .aer
           ∂NPP        ∂NPP            ∂NPP
δNPP ∼
     =          δfd +         δTotPAR+       δClim. (3)

                                                                                               BBAx1
            ∂fd       ∂TotPAR          ∂Clim                                          − NPPclim.aer,TotPAR.aer,fd .clean

                                                                                             BBAx0
To evaluate how these three terms contribute individually                             − NPPclim.aer,TotPAR.aer,fd .aer
to the total change in NPP (the net impact), we have de-                                   BBAx0

veloped three new model diagnostics in HadGEM2-ES. For                                − NPPclim.aer,TotPAR.aer,fd .clean ,               (5)

Atmos. Chem. Phys., 19, 1301–1326, 2019                                                 www.atmos-chem-phys.net/19/1301/2019/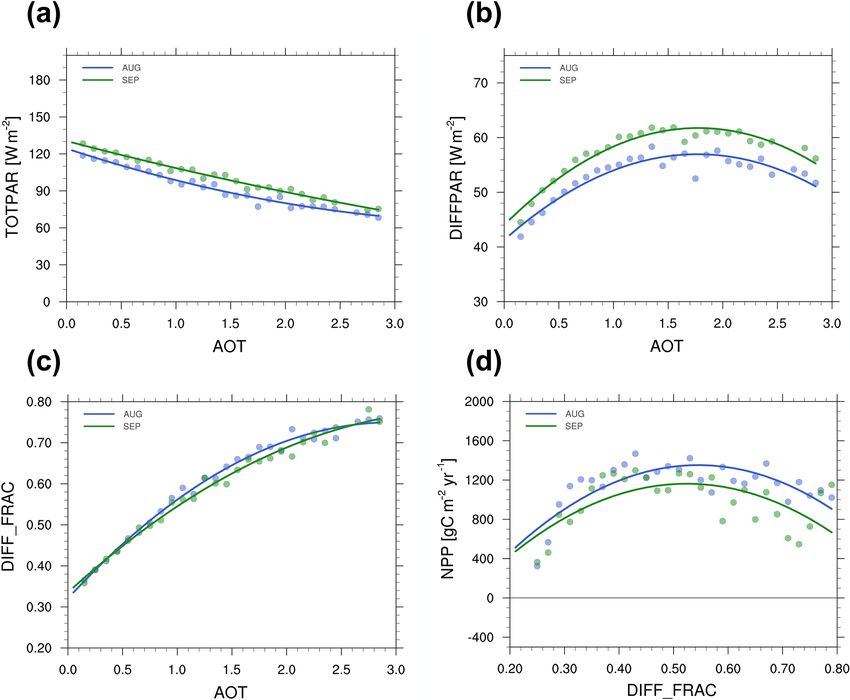
F. F. Malavelle et al.: Aerosol radiative and climatic effects on the Amazon rainforest 1309
Table 3. Model quantities calculated during the triple call of the physiology routines (see text).
Aerosol effect on model variables during the triple call:
with (.aer) and without (.clean) aerosol effect
fd TotPAR clim Biochemical flux diagnostic (e.g. NPP) Comments
No. 1 fd .clean TotPAR.clean clim.aer NPPclim.aer,TotPAR.clean,f d .clean NPP of vegetation
only experiencing the
physiology routines
Call order of the
change in climate
No. 2 fd .clean TotPAR.aer clim.aer NPPclim.aer,TotPAR.aer,f d .clean No. 2 minus no. 1
is the impact of change in
total amount of PAR
No. 3 fd .aer TotPAR.aer clim.aer NPPclim.aer,TotPAR.clean,f d .aer No. 3 minus no. 2
is the impact of change in
diffuse fraction of PAR
BBAx1 BBAx1
1NPPTotPAR = NPPclim.aer,TotPAR.aer,fd .clean degree resolution) that was derived from the MYD06_L2
BBAx1
products for the period extending between 2001 and 2016.
− NPPclim.aer,TotPAR.clean,fd .clean Additional evaluation of the model skill against obser-
BBAx0 vations is provided in the Supplement (Fig. S8). This in-
− NPPclim.aer,TotPAR.aer,fd .clean cludes comparisons of the modelled solar fluxes at the sur-
face against the SSF1deg Terra Edition 2.8 product based on
BBAx0
− NPPclim.aer,TotPAR.clean,fd .clean , (6)
the CERES radiation data, and comparisons of the modelled
BBAx1 BBAx1 surface precipitation against the GPCP version 2.3 product.
1NPPclim = NPPClim.aer,TotPAR.clean,fd .clean
BBAx0
− NPPClim.aer,TotPAR.clean,fd .clean , (7)
3 Results
where overbars denote quantities averaged over a time pe- 3.1 Evaluation
riod long enough for vegetation fast responses to adjust to
the aerosol effects. 3.1.1 Carbon exchange
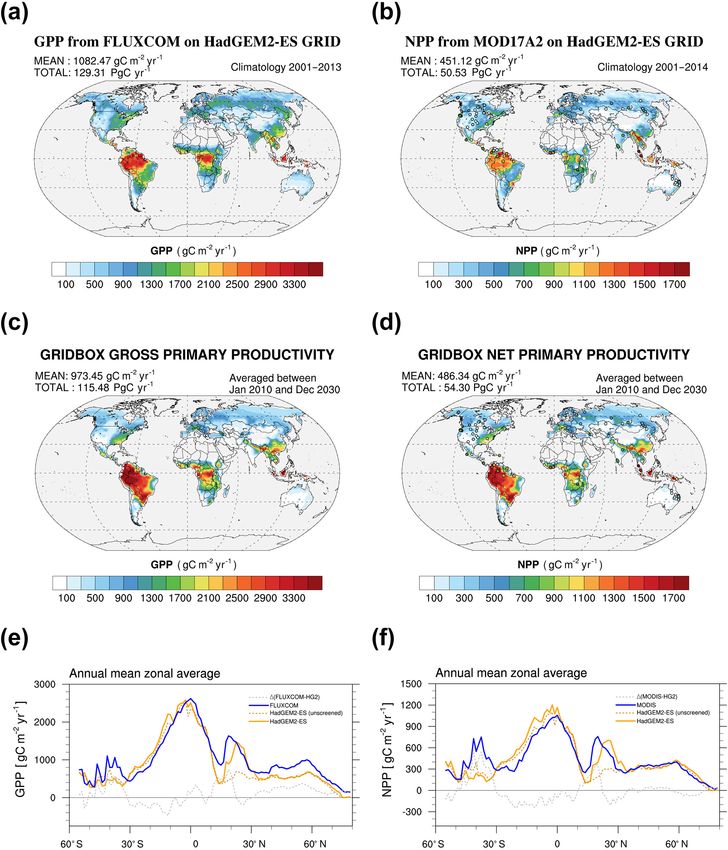
2.5 Observations used in model evaluation Global annual mean GPP and NPP as simulated by
HadGEM2-ES with the new representation of canopy light
We evaluate global fields of simulated GPP and NPP us- interception are shown in Fig. 1c, d. The global GPP mod-
ing GPP fields derived by the FLUXCOM project (Tramon- elled by HadGEM2-ES is +115 PgC yr−1 in the updated
tana et al., 2016; Jung et al., 2017a) and the global an- version of HadGEM2-ES and smaller than the estimate of
nual mean NPP retrievals based on the MODIS MOD17A2 +129 PgC yr−1 from the FLUXCOM dataset (Fig. 1a) but
product (Running et al., 1994) (Fig. 1a, b). The GPP from closer to the reference of +118 PgC yr−1 cited by Shao
FLUXCOM is derived from a model that has been trained et al. (2013). The standard configuration of HadGEM2-ES
on observational data, so we will refer to this estimate that participated in CMIP5 had a global GPP of the or-
as a “reconstructed” GPP. In addition, in situ estimates of der of +140 PgC yr−1 for present-day conditions (Shao et
NPP from the EMDI project (http://gaim.unh.edu/Structure/ al., 2013). The underestimation of the GPP in the updated
Intercomparison/EMDI/, last access: 25 January 2019) are HadGEM2-ES configuration is comparable in magnitude to
also presented in the form of overlaid circles depicted in the overestimation of the GPP in the HadGEM2-ES config-
Fig. 1b. Note, simulated values of HadGEM2-ES GPP and uration. However, the ratio of NPP over GPP (not shown)
NPP used in the comparison with observational data are sam- in the updated version of HadGEM2 is more consistent
pled where the corresponding observationally based dataset with observationally based ratio estimates (e.g. Luyssaert
contains non-missing data. et al., 2007). Despite the inherent uncertainties in the two
The simulated aerosol loading is evaluated against the reference estimates of the global GPP (i.e. between +118
record of aerosol optical thicknesses (AOTs) retrieved from and 129 TgC yr−1 ), it suggests that the updated version of
the MODIS instrument measurements on board of the Terra HadGEM2-ES is able to provide a more consistent global
satellite. The dataset used corresponds to the Level-3 MODIS GPP estimate. Over the central Amazon domain, which is
Atmosphere Monthly Global Product collection 6.1 (at 1- represented by the region encapsulated in the red box in
www.atmos-chem-phys.net/19/1301/2019/ Atmos. Chem. Phys., 19, 1301–1326, 20191310 F. F. Malavelle et al.: Aerosol radiative and climatic effects on the Amazon rainforest Figure 1. Global annual estimates of gross primary productivity (GPP, a, c, e) and net primary productivity (NPP, b, d, f). Observation- ally based estimates from FLUXCOM MTE analysis (a), MODIS MOD17A2 (b) and HadGEM2-ES (c, d). Zonal means are shown in panels (e) and (f). The circles on the NPP maps (b, d) represent in situ estimates from the EMDI project. Fig. 2a., the HadGEM2-ES average GPP in August (respec- The global NPP modelled by HadGEM2-ES is tively September) is 2750 ± 250 gC m−2 yr−1 (respectively +54 PgC yr−1 (Fig. 1d) and in good agreement with 2600±200 gC m−2 yr−1 for September) compared to 2250± the satellite-based estimate of +50 PgC yr−1 (Fig. 1b) and 125 gC m−2 yr−1 (respectively 2500 ± 180 gC m−2 s−1 for the “best guess” value of +56 PgC yr−1 reported by Shao September) for FLUXCOM. et al. (2013). The updated configuration of HadGEM2- Atmos. Chem. Phys., 19, 1301–1326, 2019 www.atmos-chem-phys.net/19/1301/2019/
F. F. Malavelle et al.: Aerosol radiative and climatic effects on the Amazon rainforest                                              1311

Figure 2. Multi-annual mean for the June–July–August season (JAS) of the aerosol optical thickness (AOT) at 550 nm (a, b) and the seasonal
cycle (c, d) of the AOT calculated over the domain highlighted in red for the MODIS Terra retrieval (a, c) and the HadGEM2-ES model (b, d).
The MODIS seasonal cycle (c) shows the multi-year (2001–2016) mean with the black line, and the individual years are overlaid with red
dashed lines. The seasonal cycle for HadGEM2-ES (d) shows the 30-year mean for the five experiments with varying biomass burning
emissions (see text, Sect. 2.2).

ES performs well in mid and high latitudes, particularly                2016 by the MODIS instrument on board of the Terra satel-
against EMDI data (Fig. 1d), but biases still remain in                 lite. Although most of man-made fires occur in the so-called
the tropics (Fig. 1f), particularly over South America in               arc of deforestation on the edge of the rainforest (Cochrane,
areas dominated by C3 grass (Fig. S5). Despite obvious                  2003), the hot spot of high AOT (> 0.6) is actually observed
overestimation by HadGEM2-ES of the NPP on annual                       over the Rondônia state (Brazil) near the Bolivian border.
mean over South America when compared to MODIS                          This hotspot can be explained by (i) the action of the large-
MOD17A2 (Fig. 1b, d), the fluxes are well captured dur-                 scale atmospheric circulation that recirculates aerosols over
ing the peak of the fire season over the central Amazon.                South America and (ii) the contribution of natural fires that
The average GPP from HadGEM2-ES in August (respec-                      occur concomitantly with fires of anthropogenic origin. Fig-
tively September) is 1080 ± 140 gC m−2 yr−1 (respectively               ure 2c provides more detail on the AOT variability by show-
975 ± 100 gC m−2 yr−1 for September) compared to                        ing the seasonal cycle calculated over the central Amazon
990±550 gC m−2 yr−1 (respectively 1025±590 gC m−2 s−1                   (i.e. the region encapsulated in the red box shown in Fig. 2a
for September) for MODIS MOD17A2.                                       using the multi-year data record from MODIS). Despite year-
                                                                        to-year variability, AOT is found to peak in September over
3.1.2   Biomass burning aerosols                                        this region that is, at the expected peak of the fire season, sup-
                                                                        porting that BBAs are the dominant component of the total
                                                                        aerosol loading during that period.
Biomass burning is highly variable from year to year. This
                                                                           The AOT modelled by HadGEM2-ES in the simulation
can be readily observed by monitoring the AOT, a proxy for
                                                                        that assumes standard BBA emission (i.e. the BBAx1 sim-
the amount of aerosol particles present in the atmosphere.
                                                                        ulation) is in overall good agreement with the MODIS ob-
Figure 2a shows the average AOT retrieved at 550 nm for the
                                                                        servations for the JAS period (Fig. 2a, b; Johnson et al.,
months July–August–September (JAS) between 2001 and

www.atmos-chem-phys.net/19/1301/2019/                                                     Atmos. Chem. Phys., 19, 1301–1326, 2019
1312 F. F. Malavelle et al.: Aerosol radiative and climatic effects on the Amazon rainforest
2016). However, the AOT at the peak of the fire season (i.e. higher AOTs. This illustrates that increasing AOT could only
in September) is underestimated (Fig. 2d). In contrast, the increase the amount of diffuse light reaching the surface up
modelled AOT for September in the BBAx2 simulation is in to a point; above this point, the effect of the attenuation of
better agreement with the satellite retrievals. We will there- TotPAR dominates. This AOT threshold around 1.75 max-
fore consider in the remainder of this paper that the combi- imises the amount of diffuse radiation reaching the canopy
nation of BBAx1 and BBAx2 scenarios are representative of top. However, as it will be detailed in following sections,
present-day levels of BBA and will use them to discuss the this threshold does not correspond to the maximum effect
effects of BBA on the rainforest productivity. There is huge of aerosols on vegetation productivity.
variation in the inter-annual variation in the magnitude of the
AOT (Fig. 2c), which justifies the upper bound for our sim- 3.2 The net impact of BBA on forest productivity
ulation scenarios; the simulations BBAx0.5 and BBAx4 will
be considered representative of emissions for years with low Figure 4d represents NPP as a function of fd for the months
and high fire activity, respectively (Fig. 2c). These simula- of August and September in the same way as the surface
tions will provide a lower and upper estimate, respectively, radiative fluxes against AOT are depicted (Fig. 4a–c). This
of the BBA impact on vegetation. shows that NPP is likely to reach an optimum when fd ap-
proximately equals 52 %–56 %. The existence of an opti-
3.1.3 Surface radiation mum fd that would maximise carbon sequestration is con-
sistent with findings reported in past modelling studies (e.g.
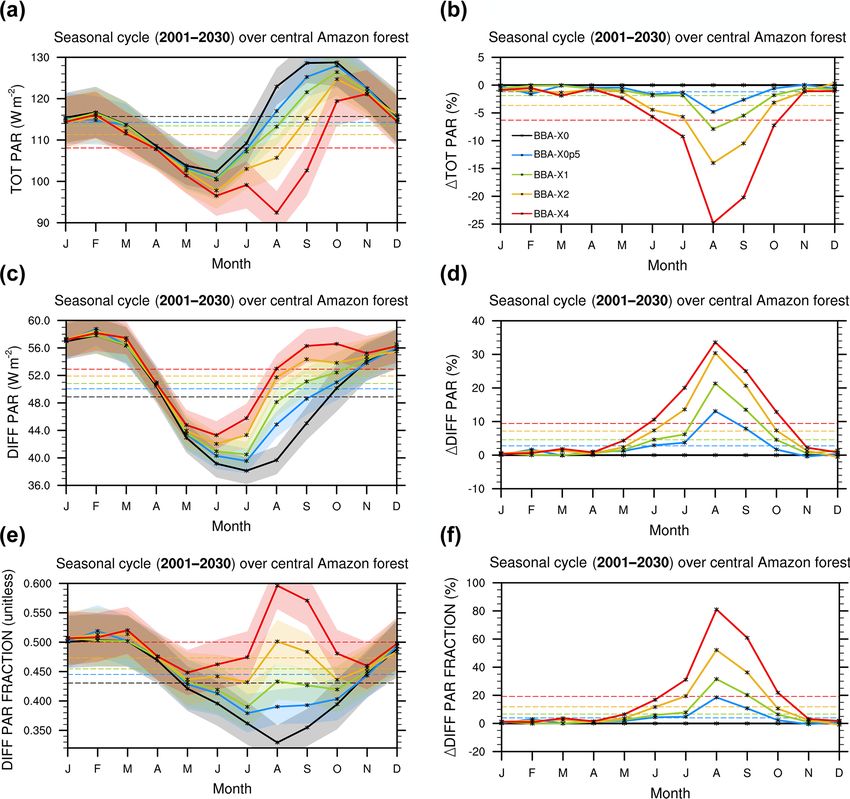
Figure 3 illustrates the impact of BBA on the radiative fluxes Knohl and Baldocchi, 2008; Mercado et al., 2009a; Pedruzo-
in the HadGEM2-ES simulations. The seasonal cycle of the Bagazgoitia et al., 2017; Yue and Unger, 2017). Such an opti-
total PAR (TotPAR) shows a strong decrease during the mum, however, depends strongly on factors such as the veg-
whole dry season with the strongest reduction occurring in etation canopy architecture environmental conditions, solar
August and September. The reduction in TotPAR is in the zenith angle or the optical properties of the scattering par-
range of −18.0 to −7.5 W m−2 (i.e. −14.0 to −5.5 %) in the ticles. The fact that an optimum diffuse fraction emerges is
BBAx1 and BBAx2 experiments, respectively (Fig. 3a, b). consistent with our understanding of the DFE mechanism.
For the most extreme emission scenarios (BBAx4), the re- When fd is lower than the optimum, an increase in the
duction in TotPAR is as high as −30 W m−2 , or −25 %, in amount of diffuse radiation increases carbon assimilation be-
August. Conversely, the diffuse component of PAR (Diff- cause a larger area of shaded leaves become photosynthet-
PAR) increases with aerosols as expected from the theory ically active. For fd beyond the optimum, the effect of the
of light scattering (Fig. 3c, d). The diffuse PAR reaching attenuation of TotPAR dominates, and sunlit leaves are no
the top of the canopy is increased by approximately +6.0 longer light saturated, resulting in an overall decrease in bio-
to +12.0 W m−2 (i.e. approximately +14.0 to +31.0 %) dur- chemical fluxes at the canopy level with further increase in
ing August and September in the BBAx1 and BBAx2 sim- fd .
ulations (Fig. 3c, d). Overall this leads to an increase in Figure 4c could be used to infer an AOT for which fd is
the diffuse fraction of PAR (i.e. fd ) of +20.0 to +55.0 % getting close to the optimum value of 0.55 (Fig. 4d). This
(Fig. 3e, f). would approximately occur at an AOT of ∼ 0.9–1 (Fig. 4c).
An alternative representation of the impact of BBA on the However, we do not observe that the highest NPP enhance-
radiative fluxes is depicted in Fig. 4 for August and Septem- ment occurs around these values of AOT in our simulations
ber. Here, the composite plot is constructed using the four (see Sect. 3.3). This can be understood as a consequence of
simulations that include BBA emissions to calculate the Tot- equifinality because both the effects of clouds and the effects
PAR (Fig. 4a), DiffPAR (Fig. 4b) and fd (Fig. 4c) at the sur- of aerosols on radiation occur concomitantly. There are then
face as a function of the total AOT (i.e. BBA + background many possible combinations of cloud and aerosol scenarios
aerosols). The composite was constructed by first averaging that could create optimum conditions maximising the DFE.
each simulation over time to create climatologies for the spe- It would be possible to disentangle the effect of BBA from
cific months, and then all pixels contained in the domain of the effect of clouds on carbon sequestration by either screen-
analysis were sampled to construct the scatterplots of the de- ing out cloudy scenes or diagnosing the biochemical fluxes
sired quantities. It is important to note that radiative quanti- in the clear-sky portion of the model grid boxes, providing a
ties were sampled for the full sky grid box and that no condi- mean to quantify the maximum potential impact of BBA on
tional sampling was applied a priori; therefore cloud effects carbon sequestration. This approach was used by Moreira et
are implicitly accounted for in these statistics. Subsequently, al. (2017) to conclude that BBA could increase the GPP of
further averaging of the data into 30 bins of AOT (respec- the Amazon forest by up to 27 %. While this study is insight-
tively fd for Fig. 4d) was applied to smooth the signal. Fig- ful, our aims here are different as we seek to understand the
ure 4a shows the expected monotonic decrease in TotPAR impact of BBA while considering the system-wide behaviour
with AOT. Concomitantly, the DiffPAR (Fig. 4b) increases that is including the effects of both aerosols and clouds. This
with AOT up to values of around 1.75 and decreases for alternative approach was used by Yue and Unger (2017) to
Atmos. Chem. Phys., 19, 1301–1326, 2019 www.atmos-chem-phys.net/19/1301/2019/You can also read


