City of Whitehorse Health and Wellbeing Profile - March 2021
←
→
Page content transcription
If your browser does not render page correctly, please read the page content below

City of Whitehorse
Health and Wellbeing
Profile

March 2021
CITY OF WHITEHORSE HEALTH AND WELLBEING PROFILE, JANUARY 2021                                 2

                 Data sources
                 Unless referenced otherwise, demographic information is sourced from the
                 2016 ABS Census of Population and Housing. Other information sources
                 include the Victorian Population Health Survey, VicHealth Indicators Survey
                 and the Australian Urban Observatory. A full reference list is provided. The
                 profile will be updated in June/July 2021 to include additional data releases.

                 Further information
                 Refer to Council’s demographic fact sheets and interactive maps at
                 https://www.whitehorse.vic.gov.au/about-council/about-whitehorse

                 Contact Community Development Department at
                 CDEnquiries@whitehorse.vic.gov.au
CITY OF WHITEHORSE HEALTH AND WELLBEING PROFILE, JANUARY 2021 3
Contents
Data sources........................................................................................................................................ 2
Further information ............................................................................................................................ 2
Introduction ............................................................................................................................................ 6
Context .................................................................................................................................................... 6
Requirements for Health and Wellbeing Planning ............................................................................. 6
Community engagement ................................................................................................................ 7
Partnerships and integration .......................................................................................................... 7
Victorian Health Priorities ............................................................................................................... 7
COVID-19 Pandemic ............................................................................................................................ 8
Part A. The people of Whitehorse ........................................................................................................ 10
1. The population .......................................................................................................................... 10
2. Changing population profile ..................................................................................................... 11
3. Diversity of people .................................................................................................................... 13
a. Children and their families .................................................................................................... 13
b. Young people ........................................................................................................................ 14
c. Adults .................................................................................................................................... 15
d. Parents .................................................................................................................................. 15
e. Older adults........................................................................................................................... 15
f. People aged 75 and over ...................................................................................................... 16
g. People with a disability ......................................................................................................... 17
h. Aboriginal and Torres Strait Islander people ........................................................................ 17
i. LGBTI people ......................................................................................................................... 17
j. People from non-English speaking culturally diverse backgrounds ..................................... 18
k. International students .......................................................................................................... 18
Part B. Liveability of Whitehorse .......................................................................................................... 20
1. Safety ........................................................................................................................................ 20
2. Social connection and inclusion ................................................................................................ 20
3. Walkability ................................................................................................................................ 21
4. Open space and forest .............................................................................................................. 22
5. Access to public open space ..................................................................................................... 22
6. Environmental sustainability .................................................................................................... 22
7. Housing diversity & affordability .............................................................................................. 23CITY OF WHITEHORSE HEALTH AND WELLBEING PROFILE, JANUARY 2021 4
8. Fresh food access ...................................................................................................................... 23
9. Access to social infrastructure (health, education community, leisure and recreation) .......... 24
10. Leisure, recreation and cultural opportunities ..................................................................... 24
11. Public transport..................................................................................................................... 25
12. Cycling infrastructure ............................................................................................................ 25
13. Employment/labour market participation ............................................................................ 25
Part C. Health disparity in Whitehorse ................................................................................................. 27
1. People who are unemployed or underemployed ..................................................................... 28
2. People on low income............................................................................................................... 29
3. People with a disability ............................................................................................................. 29
a. Carers of people with disability ............................................................................................ 30
4. People from a non-English culturally diverse background ....................................................... 30
5. People who are LGBTI ............................................................................................................... 31
6. People who are Aboriginal or Torres Strait Islander ................................................................. 31
7. People who are homeless or in insecure housing .................................................................... 32
8. People who are digitally excluded ............................................................................................ 32
Part D. Health and wellbeing in Whitehorse ........................................................................................ 34
1. Impacts of COVID-19 pandemic ................................................................................................ 35
a. The local experience ............................................................................................................. 36
2. Chronic disease ......................................................................................................................... 38
a. Avoidable deaths .................................................................................................................. 38
b. Chronic disease ..................................................................................................................... 38
c. Risk factors for chronic disease............................................................................................. 38
3. Injury ......................................................................................................................................... 39
a. Falls ....................................................................................................................................... 39
b. Road related injury................................................................................................................ 40
c. Violence................................................................................................................................. 40
4. Mental health............................................................................................................................ 42
a. Self-harm ............................................................................................................................... 42
b. Gambling ............................................................................................................................... 42
c. Young people ........................................................................................................................ 43
d. Women.................................................................................................................................. 44
e. Men ....................................................................................................................................... 45
f. LGBTI people ......................................................................................................................... 45CITY OF WHITEHORSE HEALTH AND WELLBEING PROFILE, JANUARY 2021 5
g. Older people and carers........................................................................................................ 45
5. Harm from alcohol and other drugs ......................................................................................... 46
a. Hospital admissions due to alcohol and pharmaceutical drugs ........................................... 46
b. Alcohol use ............................................................................................................................ 46
c. Alcohol harms ....................................................................................................................... 47
d. Alcohol availability ................................................................................................................ 47
e. Tobacco use .......................................................................................................................... 47
f. E-cigarettes ........................................................................................................................... 47
6. Communicable disease ............................................................................................................. 48
7. Impacts of climate change ........................................................................................................ 49
a. Climate predictions ............................................................................................................... 49
b. Public health risks ................................................................................................................. 49
c. Heat stress ............................................................................................................................ 50
d. Air pollution .......................................................................................................................... 50
e. Greenhouse gas emissions.................................................................................................... 50
f. Household solar power ......................................................................................................... 50
g. Waste reduction.................................................................................................................... 51
h. Deaths related to climate change ......................................................................................... 51
Appendices............................................................................................................................................ 53
Appendix 1: Health and wellbeing indicators and measures............................................................ 53
References ............................................................................................................................................ 63CITY OF WHITEHORSE HEALTH AND WELLBEING PROFILE, JANUARY 2021 6
Introduction
The City of Whitehorse Health and Wellbeing Profile January 2021 presents current and relevant
information from various trustworthy sources about the people of Whitehorse and their health and
wellbeing status. Throughout the profile aspects of health and wellbeing for the people of
Whitehorse may be compared with Metropolitan Melbourne, Eastern Region, Victorian and
Australian populations. A full reference list of data sources is provided at the end of the profile.
The People of Whitehorse First the profile describes the characteristics of the people of
Whitehorse, from a whole of population perspective to a closer look at the diversity of people who
live in the municipality. Characteristics of these cohorts help us understand how best to respond to
the health and wellbeing challenges of individuals and groups in Whitehorse.
Liveability of Whitehorse Next the many environmental aspects of Whitehorse that influence
people’s health and wellbeing – its liveability – are outlined.
Health Disparity in Whitehorse In recognition that the burden of poor health is not evenly spread
across our community, the profile describes particular groups within Whitehorse that experience
greater health disparity.
Health and Wellbeing in Whitehorse Lastly, the profile presents preventable key areas of poor
health and wellbeing for the people who live in Whitehorse, based on an analysis of the data and
observations of local service providers. This information is themed as chronic disease, injury, mental
health and wellbeing, use of alcohol and other drugs, communicable disease and the impacts of
climate change.
Context
The purpose of the profile is to inform the development of the City of Whitehorse Municipal Public
Health and Wellbeing Plan for 2021-2025.
The Municipal Public Health and Wellbeing Plan (MPHWP) describes the work Council will undertake
in partnership with the community, with other levels of government and with key State and local
organisations over the next four years to improve the health and wellbeing of people in Whitehorse.
Requirements for Health and Wellbeing Planning
The Municipal Public Health and Wellbeing Plan (MPHWP) sets the broad mission, goals and
priorities to enable people living in a municipality to achieve maximum health and wellbeing.
In preparing a health and wellbeing plan, the Public Health and Wellbeing Act 2008 requires council
MPHWPs to:
Be consistent with the corporate plan of the Council and the Municipal Strategic Statement
(MSS).
Specify measures to prevent family violence and respond to the needs of victims of family
violence in the local community.
Have regard to climate change.CITY OF WHITEHORSE HEALTH AND WELLBEING PROFILE, JANUARY 2021 7
Consider the focus areas and priorities of the Victorian Public Health and Wellbeing Plan
2019–2023.
Community engagement
In 2021 community engagement for the MPHWP is integrated with the four-year Council Plan and
the ten-year Finance Plan, and includes deliberative engagement. The MPHWP and Council Plan are
aligned to achieve the Community Vision 2040.
Partnerships and integration
Other relevant strategic plans across Council and those of local community partners with an interest
in public health are integrated (where appropriate) or sit alongside the MPHWP to ensure a
coordinated local prevention effort. Council strategic plans that align with the MPHWP include:
Disability Action Plan
Early Years Plan
Youth Plan
Reconciliation Action Plan
Volunteering and Community Participation Strategy
Diversity Plan
Health Ageing Plan
Family Violence Prevention Action Plan 2019-2021
Sustainability Strategy 2016-2022
Waste Management Strategy 2018 – 2028
Interim Climate Response Plan 2020-2022
Urban Forest Strategy 2018-2021
Urban Biodiversity Strategy 2014-2024
Open Space Strategy 2007
Play Space Strategy 2011
Arts and Cultural Strategy 2013-2023
Whitehorse Recreation Strategy 2015-2024
Whitehorse Integrated Transport Strategy 2011
Box Hill Integrated Transport Strategy 2020
Cycling Strategy 2016
Community Road Safety Strategy 2013
Domestic Animal Management Plan 2017-2021
Investment & Economic Development Extension Strategy 2020-2022
Digital Strategy 2017-2020
Municipal Emergency Management Plan February 2020
Prevention and health promotion funded organisations and councils work together with the
Department of Families, Fairness and Housing (DFFH) and other local partners to establish a
common approach to the preparation of health and wellbeing plans.
Victorian Health Priorities
The Victorian public health and wellbeing plan 2019–2023 provides continuity for the priorities of
the previous plan, while recognising two additional leading threats to health and wellbeing globally:CITY OF WHITEHORSE HEALTH AND WELLBEING PROFILE, JANUARY 2021 8
the health impacts of climate change and antimicrobial resistance (the ability to effectively treat
infections in our community).
The State-wide plan highlights four priority focus areas to encourage coordinated action where it is
anticipated to make the greatest gains. These are highlighted in bold below:
Tackling climate change and its impact on health
Increasing healthy eating
Increasing active living
Reducing tobacco-related harm
Reducing injury
Preventing all forms of violence
Decreasing the risk of drug resistant infections in the community
Improving mental wellbeing
Improving sexual and reproductive health
Reducing harmful alcohol and drug use
The Victorian public health and wellbeing plan 2019-2023 recognises key links between actions
taken in a number of these priority areas. For example, by promoting active transport (walking,
cycling or use of public transport) and reducing the number of trips by car we in turn reduce
emissions. A reduction in emissions and increasing active transport produces health co-benefits
through improvements to air quality and increasing opportunities for physical activity.
COVID-19 Pandemic
Subsequent to the release of the Victorian public health and wellbeing plan, a major worldwide
public health event has had sudden and profound impacts on everyone. The COVID-19 pandemic is a
unique emergency event unlike any we have experienced in the past.
Since being reported in January 2020, the Whitehorse community has experienced a low rate of
infection. However, the impact of the control measures and fear of the virus itself have impacted our
community.
Restrictions on human contact and movement as well as the wearing of personal protective
equipment are public health controls that have not been implemented in our society before. The
introduction of these restrictions is significantly impacting on the economy (constraints on people’s
ability to work and do business), education (students’ ability to attend schools/tertiary institutes),
health (constraints on access to health services, manifestations of psychological distress, mental
health issues, decreased physical activity etc.) and social (impacts of people being isolated and more
vulnerable). Health inequalities will increase as a result.
The MPHWP will be informed by the most up to date evidence and information about the impacts of
the pandemic and will prioritise strategies for community recovery.
The profile will be updated in June/July 2021 to include additional data releases. Additional data
sources are welcome.CITY OF WHITEHORSE HEALTH AND WELLBEING PROFILE, JANUARY 2021 9
CITY OF WHITEHORSE HEALTH AND WELLBEING PROFILE, JANUARY 2021                                     10

Part A. The people of Whitehorse
The City of Whitehorse hosts a diverse and growing population. This section describes the current
population profile, the forecast changes due to ageing and migration and then the diverse groups of
people who call Whitehorse their home.

1. The population
On 30 June 2019, it is estimated that 178,739 people lived in Whitehorse. The population age
distribution (shown in Figure 1) is generally similar to the state average. Figure 1 highlights that
Whitehorse has proportionally more people in the over 70 age groups and 20-24 year olds, and less
proportionally less people in the 25 to 39 year old age groups than all of Melbourne. The median age
in Whitehorse was 38 years. Twenty per cent of the population are aged less than 18 years.

        Figure 1 – Whitehorse Age Structure compared to Greater Melbourne – 5 year groups, 2016

9%

8%

7%

6%

5%

4%

3%

2%

1%

0%
      0-4   5-9 10-1415-1920-2425-2930-3435-3940-4445-4950-5455-5960-6465-6970-7475-7980-84 85+

                                    Whitehorse      Greater Melbourne

While fifty-two per cent of the population in Whitehorse are female, there are more males than
females in all of the five year age increments under 40 years. For every five year age increment over
50, there are more females than males. This is particularly so for the older age groups; there are
nearly twice as many women as men aged 85 plus. Box Hill has a larger concentration of residents
aged 20-29 than the rest of the municipality

Whitehorse is home to many families. In 2016, there were 60,431 households in Whitehorse and, as
illustrated in Figure 2, the most common household type comprised couples with dependents (34.5
per cent). Lone person households and the heads of lone-parent households are more frequently
CITY OF WHITEHORSE HEALTH AND WELLBEING PROFILE, JANUARY 2021 11
women. In 2016, 62.3 per cent of all people living alone were female, and this ratio increases with
age. 81.7 per cent of lone-parent households in Whitehorse have a female head.
Figure 2 – Whitehorse Household type, 2016
Other household
3%
Lone person
household
23%
Couple with children
35%
Group household
5%
Other family
1%
Single parent family
10%
Couple without
children
23%
In 2016 26.7 per cent of people both live and work in Whitehorse and many more do so in the
surrounding municipalities.
2. Changing population profile
Whitehorse has an increasingly ageing population. Currently more than 17.5 per cent of people are
over the age of 65 and 3.1 per cent of the population is aged 85+. Between now and 2041, the
number of people aged 65+ will increase by approximately 11,113 people. In Whitehorse 63.4 per
cent of people with a disability are aged 65 or over. Also, many people aged over 65 years care for a
person with a disability, long term illness or old age. (In 2016 there were 3,705 carers in Whitehorse
aged over 65). Around 34 per cent of people aged 75+ in Whitehorse live alone, the larger
proportion of these being female (77 per cent).CITY OF WHITEHORSE HEALTH AND WELLBEING PROFILE, JANUARY 2021 12
A growing and changing population in Whitehorse is seeing relative increases in the numbers of
young people (1,851 under the age of 25 between 2011 and 2016) and people born in non-English
speaking countries of origin (12,139 between 2011 and 2016). The age structure forecasts for the
period 2016 and 2040, as illustrated in Figure 3, indicate a 26.9 per cent increase in population for
under working age, a 36.4 per cent increase in population of working age and a 38.8 per cent
increase in population of retirement age. The population is forecast to increase at an average annual
rate of 1.5 per cent between 2016 and 2041 (ID Consulting, 2020).
Figure 3 – Whitehorse Population and Household Forecasts, 2016 to 2041
Total Population Households Average household size
250,000 3.0
2.5
Forecast population / households
200,000
2.0
150,000
1.5
100,000
1.0
50,000
0.5
0 0.0
2016
2017
2018
2019
2020
2021
2022
2023
2024
2025
2026
2027
2028
2029
2030
2031
2032
2033
2034
2035
2036
2037
2038
2039
2040
2041
Forecast year (ending June 30)
Source: .id Consulting (2021), Census of Population and Housing
While the dominant household type in Whitehorse is 'Couple families with dependents', by 2041 the
largest forecast increase is expected in 'Lone person households’ as illustrated in Figure 4. It is
estimated that at this time lone households will account for more than a quarter of all households in
Whitehorse, predominantly with older people and younger residents. The average household size is
expected to fall from 2.6 in 2016 to 2.57 by 2041, as illustrated by the red line in Figure 3.CITY OF WHITEHORSE HEALTH AND WELLBEING PROFILE, JANUARY 2021 13
Figure 4 – Whitehorse Household Types Forecast, 2016 to 2041
30,000
25,000
Number of households
20,000
15,000
10,000
5,000
0
Couple families Couples Group Lone person One parent Other families
with without households households family
dependents dependents
Household type
2016 2031 2041
In Whitehorse, the rate of new settler arrivals per 100,000 of population is among the highest in the
state at 1,105.1, in comparison to the Victorian average of 682.5.i Between 2012 and 2017 the
highest number of new settler arrivals was from China at 6,516, followed by India at 1,657 and
Malaysia at 543.
3. Diversity of people
People of diverse ages, genders, abilities and cultural and language backgrounds make up the
population of Whitehorse.
a. Children and their families
Children aged 0-11 years account for 13.4 per cent of the total Whitehorse population, slightly less
than Greater Melbourne at 14.9 per cent. There is a higher proportion of male children aged 0-11
years (14.1%) compared to female (12.8%). Between 2016 and 2041, the 0-11 age cohort is
expected to increase by 5,946 residents. Over the same period, the percentage of households
comprised of couples with dependent children is expected to decrease from 34.8 per cent to 32.6
per cent.
The early years (pregnancy to eight years) are a period of rapid cognitive, biological and social
development and the most critical in influencing a person’s long-term health and wellbeing. The
environment in which a child spends these early years – the family, educational and care settings
and the broader community – strongly shapes whether or not they have good foundations for their
future health, wellbeing and development.CITY OF WHITEHORSE HEALTH AND WELLBEING PROFILE, JANUARY 2021 14
In 2015 Whitehorse recorded higher than average Victorian rates of 3.5 year olds attending maternal
and child health checks (67.8% compared to 66.1%) and kindergarten participation rate (100.6 per
cent1 compared to 98.1 per cent).ii
Children fully immunised at one, two and five years across Whitehorse in 2020 was higher than
Victoria as a whole. 96.8% of 5 year olds in Whitehorse are fully immunised.iii
In 2015/2016, 47 per cent of children were fully breast feeding at 6 months in Whitehorse,
compared to 49 per cent for Victoria as a whole.
The Australian Early Development Census measures how children have developed by the time they
start school. It looks at five domains of early childhood development: physical health and wellbeing,
social competence, emotional maturity, language and cognitive skills, and communication skills and
general knowledge.
In 2018, 13.3 per cent of Whitehorse children were considered vulnerable on one or more domains,
in comparison to the Victorian average of 19.9 per cent and Australian average of 21.7 per cent. A
further 5.6 per cent of Whitehorse children were considered vulnerable on two or more domains, in
comparison to the Victorian average of 10.1 per cent and Australian average of 11.0 per cent.iv
In 2014 Whitehorse had a rate of 4.2 per 1,000 children of substantiated child abuse cases for
children aged 1-17 years, compared with 9.2/1,000 for Victoria.v Children's exposure to domestic
violence has been increasingly recognised as a form of child abuse.
b. Young people
A person’s experience in the formative years between 12 and 25 has a significant influence on their
long term health and wellbeing and capacity to enjoy a full, active and rewarding life to their full
capacity. Access to education, employment, healthy food, respectful relationships and social,
sporting and creative pursuits all play a part.
Young people aged 12 to 25 years account for 19.3 per cent of the total Whitehorse
population, which is comparable to the 18.3 per cent across Metropolitan Melbourne.
There are 16,128 male and 15,234 females aged 12 to 25 living in Whitehorse.
A total of 31.5 per cent of young people aged 12 to 25 living in Whitehorse were born in a
non-English speaking country, significantly higher than Metropolitan Melbourne (22.1%) and
Victoria (18.2%). In addition, 38.4 per cent of all young people speak a language other than
English at home.
In Whitehorse Year 9 students achieving national learning benchmarks is 95.0 per cent for
literacy and 97.5 per cent for numeracy compared to Victoria at 92.0 per cent and 95.5 per
cent respectively.
A total of 54.2 per cent of 18 to 24 year olds in Whitehorse are attending a university,
compared to 40.3 per cent for Metropolitan Melbourne. A similar percentage of students in
Whitehorse and Greater Melbourne attend TAFE (6.9% and 7.5% respectively).
Five per cent of 15-24-year-olds in Whitehorse are not in employment or education.
1
This figure is higher than 100% reflecting participation in Whitehorse kindergartens by children living outside the
municipality.CITY OF WHITEHORSE HEALTH AND WELLBEING PROFILE, JANUARY 2021 15
Secondary school retention rates are higher in Whitehorse, with 97.4% of 19 year olds
having completed Year 12, in comparison to the Victorian State average of 88.2%.vi
c. Adults
People aged 25-65 years account for 52.2 per cent of the total Whitehorse population, 3 per cent
less than Greater Melbourne at 55.2 per cent. There are 48.1 per cent male and 51.9 per cent
female in this age group. Between 2016 and 2041, this age cohort is expected to increase by 30,754
residents.
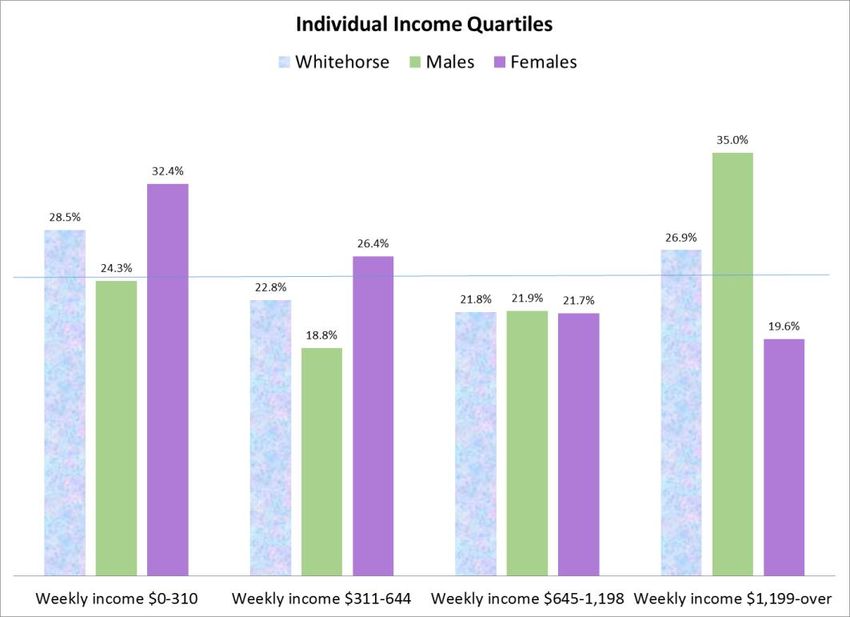
Gender differences in working aged adults reveal distinct differences in employment and income:
The female median weekly income is $498 (persons aged 15+)
The male median weekly income is $798 (persons aged 15+)
15.2 per cent of females undertake 30+ hours of unpaid domestic work each week
2.6 per cent of males undertake 30+ hours of unpaid domestic work each week
33.7 per cent of females are employed full-time
62.9 per cent of males are employed full-time
8.1 per cent of employed females are in a managerial position
15.2 per cent of employed males are in a managerial position.
d. Parents
In Whitehorse 34.5 per cent of households are couples with children and 9.5 per cent are single
parent families. 81.7 per cent of single parents are female and 18.4 per cent are male.
Over 85 per cent of families in Whitehorse have one or two children:
42.5 per cent one child
42.7 per cent two children
12.1 per cent three children
2.7 per cent four or more children
In Australia the proportion of same-sex couple families with children increased from 12 per cent in
2011 to 15 per cent in 2016. Female same-sex couples were more likely to have children than male
same-sex couples.
In Whitehorse, females are more likely than males to provide care to dependent children over a
fortnight period. 30.4 per cent of females gave care over a fortnight, compared with 25.0 per cent of
males
e. Older adults
Older people have a wealth of knowledge, experience and actively contribute to the wellbeing of the
community. Many older people are caring for others – partners, children and grandchildren. The
interconnectedness of physical and mental health plays out strongly for older people.CITY OF WHITEHORSE HEALTH AND WELLBEING PROFILE, JANUARY 2021 16
Good physical health enables older people to socialise, travel and work and to participate actively in
society while poor physical health increases the risk of isolation and depression.
In 2016, 17.5 per cent of Whitehorse residents were aged 65 plus; this compares with 14 per
cent for Metropolitan Melbourne.
The municipality is 42.9 per cent male; 57.1 per cent female
40.7 per cent of people aged 65 plus years in the City of Whitehorse were born overseas;
31.8 per cent were from a non-English speaking background, compared with 46.2 per cent
and 35.7 per cent respectively for Metropolitan Melbourne;
The largest non-English speaking country of birth for people aged 65 or more in Whitehorse
in 2016 was China, where 5.3 per cent or 1,493 people aged 65 years or more were born.
This is followed by Greece (4.4%) and Italy (3.9%). More than one in four persons over 65
years speaks a language other than English at home (26.6%).
Approximately 7,628 people in the City of Whitehorse need help with daily living tasks due
to disability. Of these, 63.4 per cent of people with a disability are aged 65 or over.
In 2016 there were 3,705 carers aged 65 plus in the City of Whitehorse providing unpaid
assistance to a person with a disability, long term illness, or old age.
The rate of people using residential aged care in the Eastern Metropolitan Region of
Melbourne (including City of Whitehorse) is 49.7 per 1,000 people in the aged care
population.vii
The population of males and females aged 65 years and over is forecast to increase by a total of
11,113 persons between 2016 and 2041, which is an increase of 5,694 females and 5,419 males (ID
Consulting, 2020), resulting in a total of 39,729 or 17.3 per cent of the total population.
More than thirty per cent of people aged 65 plus in the City of Whitehorse were born overseas, with
a non-English speaking background. Evidence shows that older people from CALD backgrounds can
face a higher risk of social isolation and poorer health outcomes. In addition, those who migrated to
Australia at an older age, or who are from refugee background, are at greater risk of encountering
mental and physical health issues.
The numbers of people with dementia in Whitehorse will rise significantly (estimated to almost
double over the next 34 years) and those at risk of elder abuse will also rise. A fall for an older
person may precipitate a loss of function and independence.
f. People aged 75 and over
Nine per cent of Whitehorse residents are aged 75 years and over. This compares with six per cent
for Metropolitan Melbourne and seven per cent for Victoria. Of these older Whitehorse residents:
34.1 per cent live in lone person households.
59.2 per cent are female; 40.8 are male
Approximately 35 per cent of people aged 80 to 89 years live alone in Whitehorse, which is higher
than the percentage for the same group in Greater Melbourne (31.9%) and Victoria (32.9%).
Whitehorse has the highest percentage of people aged 90 years plus living alone at 34.2 per cent,CITY OF WHITEHORSE HEALTH AND WELLBEING PROFILE, JANUARY 2021 17 which is considerably higher than Greater Melbourne and Victoria, with both just under 30 per cent.viii g. People with a disability Disability can occur at any time; prior to or at birth, as the result of accident, injury, chronic illness or trauma, during childhood, adulthood or through older age. In addition, a diverse range of social, environmental, biological and psychological factors can impact on an individual’s mental health and wellbeing resulting in the person experiencing mental illness or psychiatric disability. Whilst the experience and impacts of disability and mental illness is unique to the person, disability and mental illness presents in all cultural groups, across gender, and socio economic groupings. ABS data indicates the presence of disability increases with age. Disability may be associated with accident illness and injury across the lifespan but may also be related to health risks, lifestyle choices and the ageing process more generally. 7,628 people in Whitehorse need assistance with core activities and of these, 64.3 per cent are aged 65 or over. 4.7 per cent of people in Whitehorse need assistance with core activities of daily living, compared to 5.1 per cent of Victorians. 41.7 per cent of people who need assistance with core activities in Whitehorse are male, while 58.3 per cent are female. The rate of disability in Australia has remained relatively stable over time with approximately 17.7 per cent of people reporting a level of disability. Almost one-quarter (23.2 per cent) of all people with disability report a mental or behavioural disorder as their main condition, up from 21.5 percent in 2015. Disability support pension recipients in Whitehorse were more likely to identify their primary disability as psychological/psychiatric (31.2 per cent), musculoskeletal and connective tissue (26.1 per cent) and intellectual/learning (12.4 per cent) than other forms of disability. The majority (56 per cent) of disability support pension recipients in Whitehorse are aged over 50 years. h. Aboriginal and Torres Strait Islander people Council recognises that Aboriginal and Torres Strait Islander people and culture are an integral part of the Australian and Whitehorse community. Many local landmarks are of important historical and cultural significance. According to the 2016 Census, 358 persons or approximately 0.2 per cent of the population in Whitehorse identify as Aboriginal or Torres Strait Islander. While Whitehorse has among the lowest percentage of residents of Aboriginal and Torres Strait Islander origin in the state, this is often underreported. i. LGBTI people It is very difficult to obtain a reliable estimate of the number of people who identify as LGBTI within the City of Whitehorse. Gender diversity is sensitive and private, and the manner in which survey questions are phrased, the fashion in which the survey is conducted, the survey date, and the segment of the community under investigation can yield distinctly different results. The Australian Human Rights Commission (2014) estimate that 11 per cent of Australian population identify as having a diverse sexual orientation, sex or gender identity, while Hayden Brown (2021) a researcher at the City of Greater Dandenong, using Census and other data, says that 12.5 per cent is a more
CITY OF WHITEHORSE HEALTH AND WELLBEING PROFILE, JANUARY 2021 18
reliable estimate.ix x Based on these two studies, the LGBTI population in Whitehorse is estimated
to be somewhere between 19,661 and 22,342 residents.
j. People from non-English speaking culturally diverse backgrounds
The City of Whitehorse is a diverse community, with roughly a third of the population born in a non-
English speaking country (33.1 per cent), and over 36.7 per cent of people speak a language other
than English at home.
We have a higher rate of new settler arrivals (1,105.1 per 100,000 population) than the Victorian
average (682.5 100,000 population). As at 30 September 2020, a total of 47 asylum seekers were
living in the Whitehorse municipality and have been granted bridging visas.
The unique situations and experiences of people from a non-English speaking background vary
greatly, however there are a number of challenges that consistently appear in research. These
challenges include:
socio-economic disadvantage
social isolation, including digital isolation evident during 2020 lock down
language barriers
racism
cultural translation difficulties
underexposure to Australian services and systems
lower rates of service accessxi
The COVID-19 crisis has amplified some of the existing barriers for multicultural communities due to
challenges accessing in-language support, disruption in trusted community networks, and the
prevailing lack of culturally responsive mental health services.xii
k. International students
A significant number of international students choose to study in the City of Whitehorse. In 2019,
around 26 per cent of Deakin University’s course enrolments were from international students and
with more than 30,000 students attending their Burwood campus, this equates to more than 7,700
international students.
It is estimated that up to 40 per cent of international students living in the inner east of Melbourne
attend a smaller private RTO rather than a large university or TAFE.xiii
The economic impact and benefits of international students for the municipality and surrounding
areas is well documentedxiv however these students are particularly vulnerable to a number of
health and wellbeing risk factors.
For international students the COVID-19 pandemic has intensified their challenges. Emerging and
compounding risks for this vulnerable cohort include:
Heightened risk of depression, anxiety, psychological distress and deteriorating emotional
wellbeing, concern for family overseasCITY OF WHITEHORSE HEALTH AND WELLBEING PROFILE, JANUARY 2021 19
Financial insecurity, loss of employment, limited support from families in home countries
due to worldwide economic impacts; growing personal indebtedness and vulnerability to
financial scams
Housing insecurity, risk of homelessness, overcrowding in shared housing
Vulnerability to housing, employment and sexual exploitation
Visa insecurity
Isolation and loneliness, fracturing of relationships
o Disconnection from the wider community, peers and social support networks
o Disconnection from universities and education providers
o Disengagement from course of study
o Barriers to accessing health and wellbeing support
Developing online gaming addictionsxvCITY OF WHITEHORSE HEALTH AND WELLBEING PROFILE, JANUARY 2021 20
Part B. Liveability of Whitehorse
Liveable, walkable neighbourhoods play an important role in public health and increase
environmental, economic and social sustainability. A ‘liveable’ community is:
‘safe, attractive, socially cohesive and inclusive, and environmentally sustainable;
with affordable and diverse housing linked by convenient public transport, walking
and cycling infrastructure to employment, education, public open space, local shops,
health and community services, and leisure and cultural opportunities.’xvi
Various aspects of Whitehorse liveability are described below.
1. Safety
Feelings or perceptions of safety affect how people move around and freely access all aspects of the
municipality – transport, open spaces, activities and facilities. Whitehorse is a relatively safe
community, and crime rates in Whitehorse are lower than the Eastern Metropolitan and State
averages. The criminal incident rate per 100,000 of population in Whitehorse is 4015.8, compared to
6019.7 for Victoria. xvii
The rate of alleged crimes against the person in Whitehorse in 2020 was 513.2 per 100,000 people,
which is also lower than for Metropolitan Melbourne (571.3/100,000). xviii 96.3 per cent of people
feel safe on Whitehorse streets, walking alone during the day.xix
However people in Whitehorse feel less safe walking alone at night, particularly women and older
people, than during the day. The rate of residents who felt “safe” or “very safe” when walking alone
at night in their local area decreased from 68 per cent in 2011 to 56.8 per cent in 2015. xx
2. Social connection and inclusion
It is observed that people who are connected and actively engaged in their local communities are
more likely to feel positive about their neighbourhood, and connecting into clubs, schools, faith and
other community groups have a positive influence on wellbeing and social cohesion.xxi
In 2015:
77.2 per cent of people surveyed in Whitehorse said that people in the neighbourhood are
willing to help each other which is higher than Victorian average of 74.1 per centxxii
76.2 per cent of people surveyed in Whitehorse said that people in their neighbourhood can
be trusted which is higher than the Victorian average of 71.9 per centxxiii
61.8 per cent of people surveyed in Whitehorse said this is a close-knit neighbourhood, a
result similar to Victoriaxxiv
77.2 per cent of people surveyed in Whitehorse spoke with more than five people the
previous dayxxv
69.7 per cent of people surveyed rated the community as “good” or “very good” for
community and support groupsxxvi
Racial vilification weakens community cohesion and a sense that everyone is welcome in
Whitehorse.CITY OF WHITEHORSE HEALTH AND WELLBEING PROFILE, JANUARY 2021 21
Racist incidents have risen in Australia during COVID-19. At the start of the pandemic in February
2020, the Australian Human Rights Commission recorded more complaints under the Racial
Discrimination Act than at any time during the previous twelve months. Since February 2020, a third
of complaints received by the Commission were related to COVID-19.xxvii Experiences of racism are
associated with poorer mental healthxxviii
3. Walkability
Walkable communities are good for our health, traffic management and the environment. A
combination of higher residential densities, well-connected street networks and mixed land uses are
positively associated with people walking (for transport) to local destinations. Combined, these
variables create a transport walkability index. Neighbourhoods with connected streets, higher
population density and various local destinations (e.g., jobs, shops, services,) score higher on the
transport walkability index than those in sprawling areas with cul-de-sacs, lower population densities
and fewer local destinations. xxix
The Victorian Planning Provisions and Precinct Structure Planning Guidelines have guidelines for
three urban design features that affect walkability:
Access to destinations – requires 80-90 per cent of residences be within 1 km of an activity
centre large enough to support a supermarket.
Street connectivity – sets a standard for the length and width of street blocks, to create
walkable blocks with a maximum perimeter of 720 m.
Density – specifies an average net density of 15 dwellings per hectare. This is too low to
create walkable neighbourhoods.xxx
26.7 per cent of people who live in Whitehorse also work in Whitehorse and many more do so from
surrounding municipalities.
In Whitehorse we have:
An average street connectivity per square kilometre of 82 /km2 (this is in the 56th
percentile2; Range from 64.2 to 109.5/km2)
An average number of daily living destinations present (0-3) within 1600m of 2.6/3 (this is in
the 59th percentile; Range from 1.2 to 3.0/3)
An average distance to closest activity centre of 1685.1m (this is in the 50th percentile;
Range from 0.0 to 3652.0m)
A Walkability for Transport Index of 0.4 (this is in the 65th percentile; Range from -2.1 to 1.7)
xxxi
2
Percentiles indicate the percentage of scores that fall below a particular value. They tell you where a score stands relative
to other scores. For example, if street connectivity average is at the 56th percentile, this indicates this street connectivity
average is higher than 56 percent of other scores – in this case other municipalities in Metropolitan Melbourne.CITY OF WHITEHORSE HEALTH AND WELLBEING PROFILE, JANUARY 2021 22
4. Open space and forest
Whitehorse is approximately 64 square kilometres in area, and almost 10 percent of that area is
managed by Council as community open space; including parks and gardens, streetscapes and
community facilities.xxxii
Existing canopy cover in Whitehorse has been estimated at between 22 and 26 per cent. It is
considered that below 30 per cent there is generally not enough canopy cover to fully achieve all the
benefits of the urban forest.xxxiii
The health and wellbeing benefits of the urban forest and green open space include:
Studies show that urban vegetation slows heartbeats, lowers blood pressure, and relaxes
brain wave patterns.
A stronger feeling of connection to nature is associated with mental health benefits and
more sustainable behaviours.
The colour green is calming and relieves eye strain.
People walk and jog more on shaded streets; which encourages interaction with neighbours
and improves the sense of community.
Trees significantly cool the urban environment helping to manage heat stress.
Trees produce oxygen, intercept airborne particulates, and reduce smog.
Access to trees, green spaces, and parks promotes physical activity, reduces stress, and can
improve the overall quality of life in our cities and towns. These factors can contribute to the
prevention of a range of chronic diseases which are related to sedentary lifestyles.
Urban landscaping, including trees, helps lower crime rates.
Trees increase the visual amenity of streets and open spacesxxxiv
In 2019/20 3,307 new trees were planted by Council in the municipal area.xxxv
5. Access to public open space
Better access to public open spaces promotes physical activity and has a positive effect on mental
health.
The percentage of dwellings in Whitehorse within 400m or less distance of public open space was
75.9 per cent in 2018 (56th percentile; Range from 0.0 to 100.0%).xxxvi
Half of the dwellings in Whitehorse were within 400m of public space larger than 1.5 hectares in
2018 (59th percentile; Range from 0.0 to 100.0%).xxxvii
6. Environmental sustainability
Reducing, re-using and recycling waste prevents pollution that can harm our health and the
environment.
In Whitehorse in 2018/2019:
Total residual waste collected was 27.3k (annual tonnes collected)
Total commingled recyclables collected was 15.3k (annual tonnes collected)
Total garden organics collected was 12.5k (annual tonnes collected)xxxviiiCITY OF WHITEHORSE HEALTH AND WELLBEING PROFILE, JANUARY 2021 23
A review for the development of Council’s Waste Management Strategy 2018-2028 found that the
community has diverting approximately 51 per cent of kerbside waste from landfill for a number of
years, which is well above the state average of 45 per cent. The findings however revealed that:
Kerbside garbage bins contain 44 percent food waste compared to the Victorian average
which was around 35-38
The total organic waste adds up to 60 per cent for Whitehorse compared to the Victorian
average, which was 50 per cent for all organics.
There is only two percent contamination in kerbside green waste bins showing that those
who choose the service are using it well. Sixty per cent of households have the optional
garden waste bin.
Approximately 11 percent of waste in recycling bins in Whitehorse is contaminate, higher
than the rest of Victoria (averaged 5.6 per cent, 2014-15) and significantly higher than the
preferred industry level of 3-5 per cent. Generally bin contamination rates are higher in
apartments at about 25 per cent, compared to separate households at 11 per cent.xxxix
7. Housing diversity & affordability
The rate of social housing in Whitehorse is 8.6 per 1,000 estimated residential population. This is the
second highest rate in the eastern metropolitan region (EMR), with Maroondah having the highest
rate of 9.1 per 1,000 estimated residential population. However, the EMR overall has significantly
less public housing than the other metropolitan regions; the north western metropolitan region has
a rate of 11.2 while the EMR has a rate of 6.1 per 1,000 estimated residential population.
In Whitehorse 2.4 per cent of all households in the municipality are social housing.
11.8 per cent of households in Whitehorse are in housing stress (rental or mortgage), compared to
Victoria 11.4 per cent and Metropolitan Melbourne 11.7 per cent.
Rental housing stress is highest in Box Hill, accounting for 30.5 per cent of all renters. This is
followed by Burwood, with 18.6 per cent of renters. Mortgage stress is greatest in Vermont and
Blackburn North, accounting for 9.5 and 8.7 of mortgagees
In December 2020, the percentage of available affordable lettings in Whitehorse is just 1.4 per cent;
significantly lower than Victoria at 11.4 per cent and Metropolitan Melbourne at 7.4 per cent.xl In
2019 Whitehorse only had 2.1 per cent affordable lettings.
8. Fresh food access
Access to fresh food provides residents with the opportunity to purchase nutritional foods which
support healthy eating behaviours and lifestyles. Supermarkets are a common source of fresh
healthy foods, but additionally, local retail outlets such as fruit and vegetable retailers
(greengrocers) also provide important opportunities to purchase these types of foods.
Eating fast food on a regular basis can lead to being overweight and obesity. Being overweight or
obese, increases a person’s risk of developing chronic diseases such as type-2 diabetes, coronary
heart disease and some cancers. Close proximity to fast food retailers may influence an individual’sCITY OF WHITEHORSE HEALTH AND WELLBEING PROFILE, JANUARY 2021 24
diet, particularly if it is within walkable distance. Most people will not regularly walk distances
greater than 800m – 1km to destinations such as shops and services. xli
Similarly, living within easy walking distance of fresh food stores encourages and enables people to
each well and to walk or cycle instead of driving and hence further reducing their risk of chronic
disease.
In Whitehorse, residents are well serviced by access to fresh food, but have less distance to travel to
access fast food:
The percentage of dwellings within 1km of a supermarket is 45.5 per cent (56th percentile;
Range from 0.0 to 100.0%) xlii
There are no dwellings without any food outlet within 3.2km (100th percentile; Range from
0.0 to 100.0%) xliii
The average distance to the closest healthy food outlet (supermarket or greengrocer) is
1036.2m (59th percentile; Range from 0.0 to 2683.0m) which is further than the average
distance to the closest fast food outlet; 941.6m (38th percentile; Range from 0.0 to 2489.0m)
xliv
9. Access to social infrastructure (health, education community, leisure and recreation)
Well-planned social infrastructure supports the liveability of communities by promoting walking and
community social interaction. It is associated with improved physical and mental health and
resident’s satisfaction with the area in which they live. The Social Infrastructure Index (SII) developed
by the Australian Urban Observatory measures 16 individual service types including Community
Centres, Culture and Leisure, Early Years, Education, Health and Social Services and Sport and
Recreation which were used to calculate the presence of service mix within a threshold distance.
Whitehorse has a SII of 7.5 where a maximum score of 16 represents the highest mix of social
infrastructure with all types present. (This score is in the 59th percentile; Range from 2.2 to 11.2/16)
xlv
Whitehorse has 0.3 general practice clinics and 0.2 pharmacies per 1,000 population; these rates are
equivalent to Victoria as a whole.xlvi
85.4 per cent of the population stated they could definitely access community services and
resources; this is a similar percentage to Victoria as a whole. xlvii
10. Leisure, recreation and cultural opportunities
Whitehorse is home to outdoor spaces, leisure centres and sporting grounds providing access to
sporting clubs, community activities and recreation. Arts, cultural and recreational activity build
social cohesion and improve community health and wellbeing. Whitehorse has 26 sports fields and
reserves as well as a golf course, skate parks and indoor sports centres. In 2018/2019 there were
1,633,693 visitors to aquatic facilities, an increase of more than 47,000 visits over the previous 12
months.You can also read