More for Less How to plan and deliver the Bay Area's major transit projects in less time, for less money and with better public value
←
→
Page content transcription
If your browser does not render page correctly, please read the page content below
SPUR REPORT
TRANSPORTATION

More for
Less
How to plan and deliver the Bay
Area’s major transit projects in
less time, for less money and with
better public value

SEPTEMBER 2020          SPUR.ORG/MOREFORLESS
This report is a component of the SPUR Regional Strategy,
                                            a vision for the future of the San Francisco Bay Area

                                            spur.org/regionalstrategy

                                            This report was adopted by the SPUR Executive Board on February 4, 2020.

Acknowledgements

This report was written by Laura            Thank you to the many people who            Thank you to the funders of the SPUR
Tolkoff, with research support from         also provided input into this project,      Regional Strategy:
Jonathon Kass, Nicole Soultanov, Jelena     including: Bernice Alaniz, Jim Banaszak,
Djruovic and Joshua Karlin-Resnick          Winsome Bowen, Andreas Breiter, Ed          Chan Zuckerberg Initiative
and with steady guidance from staff         Chan, Tilly Chang, Stuart Cohen, John       Clarence E. Heller Charitable Foundation
from numerous public agencies and           Cook, Sue Dyer, Stephen Engblom, Karen      Curtis Infrastructure Initiative
transit agencies, consultants and civic     Trapenberg Frick, Tom Gellibrand, Sadie     Dignity Health
groups. SPUR’s Executive Board and          Graham, Tony Hansen, David Ho, Robert       Facebook
Transformative Transit Project Delivery     Jones, Nick Josefowitz, Ed Harrington,      Genentech
Task Force discussed and debated the        Leyla Hedayat, Gary Kennerly, Paula         George Miller
recommendations in this white paper.        Kirlin, Adina Levin, Alon Levy, Michael     Hellman Foundation
All recommendations contained in this       Lindsay, Gwen Litvak, John Martin, Tony     John S. and James L. Knight Foundation
report are SPUR’s.                          Meggs, Val Menotti, Joanne Parker, Colin    Marin Community Foundation
                                            Peppard, Howard Permut, Sebastian           Sage Foundation
SPUR is particularly grateful to the        Petty, John Porcari, Jean-Claude Prager,    Silicon Valley Community Foundation
members of a task force that was            Andrew Quinn, Dennis Ratcliffe, John        Stanford University
convened to help shape this report:         Ristow, Liz Scanlon, Joshua Schank,         Additional funding provided by AECOM,
Jim Allison, Jason Baker, Ignacio           Brian Stanke, Ben Tripousis, Kyle Vinson,   Fund for the Environment and Urban
Barandiaran, Dale Bonner, Andreas           Duncan Watry, Simon Whitehorn, Colin        Life, Microsoft, the Seed Fund, Stripe,
Breamer, Diane Cowin, Eric Eidlin, John     Wright, Joy Woo and Jessica Zenk.           Uber Technologies and Wells Fargo.
Fisher, John Funghi, Darlene Gee, Ian
Griffiths, Ariane Hogan, Jill Jaffe, Doug   Edited by Karen Steen
Johnson, Dan Leavitt, Boris Lipkin,         Designed by Shawn Hazen
Joanne Parker, Shannon Peloquin,            Copyedited by Valerie Sinzdak
Therese Trivedi, Dennis Turchon, Kate       Cover photo by Sergio Ruiz
White, Simon Whitehorn and Luis
Zurinaga.
Contents
Executive Summary                                    4

Introduction                                          8
Project Delivery Problems Are Costing the Bay Area

Big Idea 1                                           15
Improve regional transportation planning, project
selection and project oversight.

Big Idea 2                                           28
Create a new organization to deliver the region’s
most significant and high-risk projects.

Big Idea 3                                           36
Streamline environmental laws for projects that
deliver significant environmental benefits.

Appendix A                                           44
Project Costs

Appendix                                             50
Project Timelines
MORE FOR LESS                                                                                                        4

Executive Summary

                                                                                                                         Photo by Sergio Ruiz
The San Francisco Bay Area’s transit network is at a critical juncture. In the last decade, the region experienced
unprecedented economic and population growth. Yet it has failed to maintain its aging transit systems or add
new infrastructure to support this growth. Getting around has become slow, inconvenient and painful, and most
of the region remains inaccessible by transit. Today, in the midst of a pandemic that has drastically reduced
ridership and revenue, many transit agencies are also experiencing a severe fiscal crisis, threatening to stop some
from running altogether before year’s end.
       A major reason why we do not have the transit network we need is because projects cost too much and
take too long. And when each project is so expensive, it’s no wonder that there’s little money left to deliver the
frequency and quality of service we need. There is too much at stake if we fail to bring down the time and costs
of delivering projects. With each negative headline about project delays or cost overruns, people will lose faith in
government to address our major challenges and may be less inclined to invest in infrastructure for the common
good. The transit network will plummet into a state of decay that will make it impossible to bring riders back, let
alone attract new riders. We will fail to meet our climate goals in the last decade that we have before time runs
out.
       SPUR believes that the region’s success depends on getting ahead of these challenges and building the
infrastructure we need. Yet the Bay Area has a poor track record of delivering major transit projects quickly and
cost-effectively. Our projects regularly take decades from start to finish, and our project costs rank among the
highest in the world.
MORE FOR LESS 5
This paper characterizes some of the chief reasons why major transportation projects take too long and cost
too much in the Bay Area. The recommendations in it answer three key questions:
1. How can regional agencies and transit operators ensure that the Bay Area is planning for and selecting the
best major transit projects to build?
2. How can regional agencies and transit operators deliver the most significant, high-cost and high-risk projects
more quickly and cost-effectively?
3. How can California remove legislative and regulatory barriers to ensure successful project delivery?
This paper focuses on major transit projects, characterized as complex, large-scale projects that are
significant to the region’s transit network and that transform the way people get around by providing significant
new access, frequency and connectivity and reducing greenhouse gas emissions. We focus on these projects
because they have high initial costs and are at high risk of cost overruns and delay. With approximately $100
billion worth of major projects in the pipeline in the Bay Area, the savings from these recommendations could
number in the tens of billions of dollars.
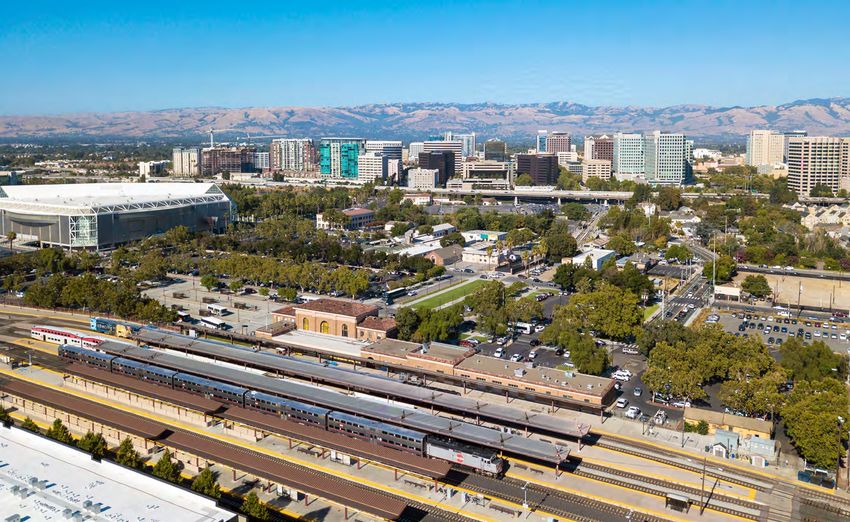
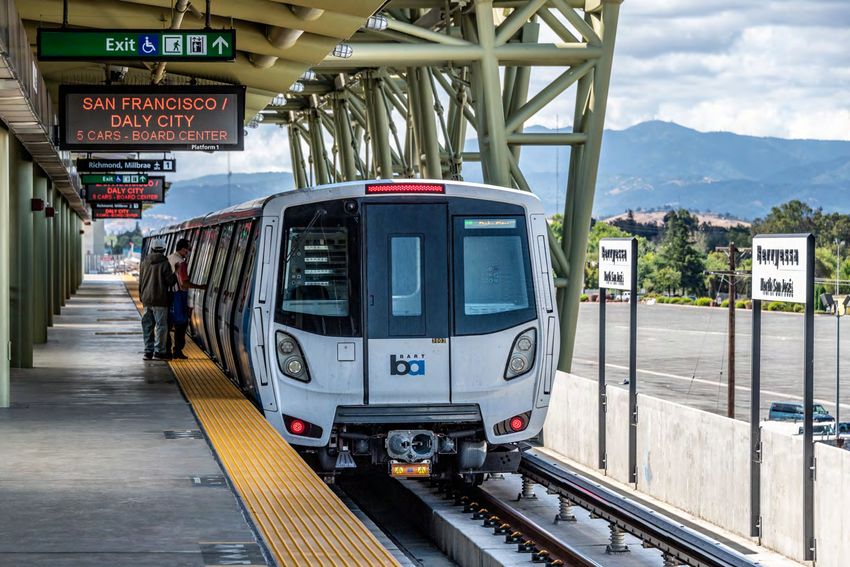
Some of these major transit projects cost over $1 billion and could be classified as “megaprojects” according
Major transit projects such as the remaking recommendations for how the Bay Area can
of San Jose’s Diridon Station often take too get better at delivering significant projects.
long and cost too much. This report makes 10
Photo by Sergio RuizMORE FOR LESS 6
to academic literature.1 These include integrated station projects such as the rebuilding of Diridon Station or the
new Salesforce Transit Center, the electrification of diesel railroads, and rail extensions such as the Silicon Valley
BART extension or additional transbay crossings, among others. However, the Bay Area has many projects that
do not meet the $1 billion cost threshold but can be equally transformative and can suffer from similar risks and
challenges. These include the region’s many stalled bus rapid transit projects.
To see the Bay Area’s next generation of major transit infrastructure projects built more quickly and cost-
effectively, we need to change the governance of project delivery. SPUR proposes three big ideas and makes 10
recommendations for delivering transit projects in the Bay Area in ways that save time and money. Though most
beneficial as a package, each of these ideas can be pursued independently.
Big Idea 1:
Improve regional transportation planning, project selection and project oversight.
Improve regional transportation planning and project oversight so that only the projects that offer the best value
to the Bay Area are advanced. The Bay Area has a history of selecting projects based on political clout rather
than through a rigorous selection process based on a regional vision or objective cost-benefit metrics. Further,
there are currently few incentives to control project costs. Project delivery problems start well before a project
ever breaks ground.
1. Expand the Metropolitan Transportation Commission’s authority to act as the region’s transit network
planner.
2. Develop a long-term strategic plan for a seamless network of regional transit and managed highway lanes
to guide capital investments.
3. Establish a “stage gate” process with phases and periodic decision points to determine a project’s
readiness to advance to the next stage in the project life cycle.
4. Rigorously evaluate the business case and deliverability options for a project, especially before making
financial and political commitments to it.
5. Establish integrated project management teams throughout the project life cycle.
Big Idea 2:
Create a new organization to deliver the region’s most significant and high-risk
projects.
A chief reason why the Bay Area has struggled with project delivery is because we build so few projects. Every
project falls victim to “first timer” mistakes. Procurement and construction management are specialized skills
that need to be nurtured through experience, especially because each project is unique. We further explore
the concept described in Recommendation 6 in our companion paper, Infrastructure Bay Area: A proposal for
successful delivery of transformative transit projects (spur.org/IBA).
1 Bent Flyvbjerg, “What You Should Know About Megaprojects and Why: An Overview,” Project Management Journal, v. 45 (2), April-May 2014, pp. 6–19. https://journals.sagepub.
com/doi/10.1002/pmj.21409MORE FOR LESS 7
6. Establish Infrastructure Bay Area, a project delivery entity responsible for the successful delivery of the
region’s most significant megaprojects.
7. Give Infrastructure Bay Area the ability to use nontraditional project delivery approaches.
8. Allow Infrastructure Bay Area to select a bidder on the basis of the best value rather than cost alone.
Big Idea 3:
Streamline environmental laws for projects that deliver significant environmental
benefits.
California’s foremost environmental protection law, the California Environmental Quality Act (CEQA), is often
used inappropriately to delay or stop projects that would have significant benefit to the environment. Adapting
CEQA for the most environmentally beneficial projects could reduce project costs and timelines, accelerating the
transition to a more sustainable, affordable and healthy transportation system.
9. Establish a statewide certification process for major transit projects over $1 billion that would reduce
uncertainty and undue delay and cost in exchange for adopting best practices in project delivery.
10. Give statutory exemptions to bus rapid transit, bicycle enhancement projects and pedestrian
improvements.
Reforming project delivery is a problem that cannot wait. If we continue on as we always have, the few
projects that the region manages to deliver will cost too much, take too long and fail to make the region
accessible and sustainable. This is a future we simply cannot accept or afford.MORE FOR LESS 8
Introduction
Project Delivery Problems
Are Costing the Bay Area
In 2019, the Bay Area’s transportation network seemed as if it were about to break. The peak travel “hour”
seemed to stretch into the entire day. Trains and buses were uncomfortably crowded. Many people were leaving
their homes before their children woke up just to avoid traffic. In the middle of the day, transit was slow and
largely nonexistent. The region’s transit network sorely needed more capacity, more reliability and more access
— and it was finally readying itself to make those investments.
Today, we face another kind of breaking point. The world has been thrust into a pandemic that has taken the
lives of hundreds of thousands of people and left millions unemployed in just a few months in the United States
alone. In the face of COVID-19, the Bay Area has gone quiet. There is no peak hour. Crowd management is about
keeping people 6 feet apart and is a matter of life and death, not comfort or convenience. Large employers
who had amassed sizeable real estate portfolios and operated their own bus networks to foster in-person
collaboration are now letting people work at home indefinitely.
With these changes, transit agencies are facing an existential crisis. As people shelter in place and practice
social distancing, transit systems are experiencing plummeting ridership and revenue. Transit fares, parking fees,
bridge tolls and other transportation funds are drying up.
SPUR believes that the Bay Area’s future is an urban one. Cities have survived pandemics before — and
become better for it.2 And though COVID-19 has made all aspects of society seem unanchored, one thing
remains unchanged: Cities need transit to survive. Even today, transit is a lifeline connecting essential workers to
hospitals, pharmacies, testing centers and jobs at all points along the food supply chain. And after we emerge
from the pandemic, we will need a significant percentage of people to shift to transit for more of their trips: A
future with more driving is a future filled with more congestion, more pollution and greater threats from climate
change.
Transit can thrive if it functions well for everyone, particularly for people of color, people with low incomes,
people with disabilities, older adults and children. But our transit network already serves too few people. Service
is designed primarily for commuters with nine-to-five jobs. Despite crowding on a number of trains and buses,
less than 3% of all trips are taken by transit, and average per capita boarding rates have fallen below their levels
in 1990.3
To make transit better for everyone, we need to make it more reliable, integrated and frequent, and in
some cases, we need to expand it to make more of the Bay Area accessible to more people. Doing so requires
investments in policies that make the transit system function better for all,4 as well as new capital projects that
add reliability, speed, capacity and access.
2 Benjamin Grant and Sarah Karlinsky, “Physically Distant But Still Together: How Cities in the Bay Area and Beyond Will Survive the Coronavirus,” SPUR, March 18, 2020, https://
www.spur.org/news/2020-03-18/physically-distant-still-together-how-cities-bay-area-and-beyond-will-survive
3 Metropolitan Transportation Commission (MTC), “Historical Trend for Daily Transit Ridership,” Vital Signs, https://www.vitalsigns.mtc.ca.gov/transit-ridership#chart-0
4 Arielle Fleisher, “Transit Fare Integration Wins Transformative Projects Competition,” SPUR, February 18, 2020, https://www.spur.org/news/2020-02-18/transit-fare-integration-
wins-transformative-projects-competitionMORE FOR LESS 9
How Poor Project Delivery Perpetuates Inequity
People with low incomes make up over half of transit riders in the Bay Area,5 which is more than twice their share
of the regional population, and people of color account for 62% of transit trips.6 That means that the high cost
and decades-long process to deliver transit improvements has the greatest impact on low-income communities
and communities of color. Solving the problem of project delivery will greatly benefit these groups.
Long timelines leave historically marginalized communities without basic access, sometimes for decades.
For example, it has taken 17 years to deliver the East Bay Bus Rapid Transit project, leaving people who live in
neighborhoods like East Oakland and downtown Oakland without a high-quality, efficient way to get where they
need to go. By the time it’s completed, the project may not even benefit the same people who voted for it. It
understandably diminishes public trust and accountability when government can’t keep its promises, particularly
for communities that have repeatedly suffered from being overlooked or overpromised.
Often, project delays are caused by individuals whose narrow interests play an outsized role in project
decisions. California’s foremost environmental law, the California Environmental Quality Act (CEQA), allows
anyone to sue to effectively block a project, even on non-environmental grounds such as impacts on parking,
traffic or aesthetics. For example, an individual sued the San Francisco bicycle plan over parking losses and
traffic impacts, holding up 34 miles of bike lanes for four years. The East Bay Bus Rapid Transit project was
likewise compromised when a single business owner in Berkeley threatened to file a lawsuit under CEQA over
parking losses. This forced the project sponsor to significantly scale the project back to run only between
Oakland and San Leandro, reducing accessibility for low-income communities.7 Similar challenges unfolded with
the Geary Bus Rapid Transit project in San Francisco. That the lawsuits can be filed anonymously further protects
the rights of an individual over the rights of the public.
Wealthier, whiter and more car-oriented communities have a lot of power over transit funding and capital
investments. For decades, the federal government has been divesting from transportation; today, federal funding
makes up only 11% of all transportation dollars in the Bay Area.8 To their credit, voters in most Bay Area counties
have repeatedly taxed themselves to try and make up the difference. Yet in order to win at the ballot, the tax
measures dedicate a significant amount of locally generated funds to car-oriented projects or rail expansions,
which tend to benefit wealthier and whiter populations than capital projects that improve capacity on existing
systems.9 Similar dynamics play out at the regional level. In 2001, the Metropolitan Transportation Commission
(MTC) adopted Resolution 3434, a political compromise that promised MTC’s support for $10.5 billion (in 2001
dollars) for rail expansion projects nominated by Bay Area political leaders competing for funds in their districts.
5 MTC, Plan Bay Area 2040 Equity Analysis Report, July 2017, p. 5-5. http://2040.planbayarea.org/sites/default/files/2017-07/Equity_Report_PBA%202040%20_7-2017.pdf
6 MTC, Regional Means-Based Transit Fare Pricing Study Project Overview Report, Draft Final, March 2017, p. 4, https://mtc.ca.gov/our-work/plans-projects/other-plans/means-
based-fare-discount-program
7 Judy Silber, “Oakland City Council Gives Final Approval to East Bay BRT,” Streetsblog SF, July 8, 2012, https://sf.streetsblog.org/2012/07/18/oakland-city-council-gives-final-
approval-to-east-bay-brt/
8 MTC, Plan Bay Area 2040, Chapter 4, “Investments,” p. 64, https://mtc.ca.gov/sites/default/files/4-Investments.pdf
9 “Faster Bay Area” in 2019/2020 was a regional ballot measure for transportation and the first ballot measure proposed exclusively for public transit.MORE FOR LESS 10
Projects Regularly Take Too Long and Cost Too Much
The Bay Area cannot afford to wait another decade without investment in the transit network. Yet capital
projects were too expensive even before the current crisis.10 Out of more than 90 capital projects submitted
to MTC in 2019 for Plan Bay Area 2050, fewer than a dozen were considered to be cost-effective. And for the
foreseeable future, transit agencies and cities will be faced with shrunken budgets. We will need to do more with
less.
The Bay Area has a poor track record in delivering major transportation projects on time, on budget
and without major defect. And we are not alone. Across the globe, delivering megaprojects is notoriously
challenging,11, 12 and schedule and cost overruns are common.13 In a survey of megaprojects around the world,
researcher Bent Flyvbjerg found that rail projects encountered an average cost overrun of more than 44%.14 With
over $100 billion worth of megaprojects on the horizon, cost overruns could run into the tens of billions. We
simply can’t afford that.
In the Bay Area, projects consistently cost more and take longer than in other urbanized regions.15 Several
systemic factors that drive up time and cost are unique to the Bay Area and California: extreme institutional
fragmentation that makes it difficult to put forward a regional vision and gain alignment between decision-
makers, an environmental review process that is often misused and adds years to a project’s schedule, and a
lack of flexibility and experience in capital project procurement, among others. This paper characterizes these
problems and is a call to action to fix them.
0
30
20
10
16
12
82
0
20
20
20
20
20
20
19
FIGURE 1
The Silicon Valley BART
Silicon Valley BART Funding measure Split Funding
n Expected
Extension Has Taken Nearly Extension in passed project u
measure a
Federal Transit
BART Short Range into 2 passedd t
Administration
Half a Century Transportation Plan
Major investment
phases full fundingg
study
The Silicon Valley BART Extension was
first identified in 1982, but the project Phase I and II Phase II Phase II
will not be completed until 2029, nearly Environmental EIR (2) EIR (3)
Impact Report (1)
half a century later.
BERRYESA
Ground- Original Actual
SVBX Phase I breaking opening opening
date date
SANTA CLARA Original New
SVBX Phase II opening opening
Project selection, planning & funding date date
Environmental review
Construction
10 Laura Tolkoff and Arielle Fleisher, “To Achieve Seamless Transit, We Must Change What and How We Build,” SPUR, December 18, 2019, https://www.spur.org/news/2019-12-18/
achieve-seamless-transit-we-must-change-what-and-how-we-build
11 See note 1.
12 Karen Trapenberg Frick, Remaking the San Francisco–Oakland Bay Bridge: A Case of Shadowboxing with Nature, Routledge, 2016.
13 In a survey of 258 transportation infrastructure projects in 20 countries (both transit and auto), 90% experienced cost escalation. Bent Flyvbjerg, Mette K. Skamris Holm and
Soren L. Buhl, “What Causes Cost Overrun in Transport Infrastructure Projects?” Transport Reviews, v. 24 (1), 2004, pp. 3–18.
14 See note 1.
15 Andy Bosselman, “Bay Area Subway and Rail Costs: Why Are They Among the Highest in the World?,” Curbed, June 18, 2018, https://sf.curbed.com/2018/6/18/17464616/bay-
area-subway-train-rail-costs-price-bart-muniMORE FOR LESS 11
FIGURE 2
6
8
03
07
Van Ness Bus Rapid Transit
1
14
16
19
13
15
21
17
95
0
0
11
0
20
20
20
20
20
20
20
20
20
20
20
20
20
19
Has Taken Nearly 26 Years
A conceptual study in 1995 identified four Four First official Fuding SFCTAA Initial c
Project
corridors study as part passed— b
feasilbility federal o
handoff
new high-priority corridors for frequent, concept of Market- Prop K study funding SFCTSS >
fast transit, including Van Ness–Mission. study Octavia Plan approval SFMTAA
The study initially looked at light rail and
bus rapid transit options. Van Ness Bus Environmental EIR
Impact Report l
Complete
Rapid Transit ran into several delays, Begnis n Administration
Federal Transit m R
Record
including issues with Caltrans over lane of Decision
width during the planning phase as well
as challenges with the construction Groundbreaking
contractor and unmarked utilities that Original Second Actual
Project selection, planning & funding opening opening opening
impeded construction. date date date
Environmental review
Construction
20 0
4
8
5
20 3
07
10
1
16
19
96
20 9
98
12
21
93
0
0
0
0
0
0
9
20
20
20
20
20
20
20
20
20
19
19
19
19
T
Third e
Street Central Central subway
b prelim engineering
e r
T
Transit r
Project subway r
studies (through 2009)9 Federal Transit
d d in
Identified included in Administration fulll
B
Bayshore e Regional e
Initial federal funding agreementn
T
Transit t
Study Transportation p
funding approval l
Plan
THIRD STREET CENTRAL
Environmental
e IImpact
c SEIR EIR
I
LRT (PHASE 1) SUBWAY
Report start
a begins complete
o e
(PHASE 2)
EIR completed
p
Federal
a Transit Administration
e Transit Administration
Federal recordd of decision
o of decision
record
THIRD STREET
Groundbreaking Original Actual
LRT (PHASE 1)
opening opening
date date
Groundbreaking Original Second New
opening date opening opening
CENTRAL date date
SUBWAY
(PHASE 2)
FIGURE 3 measure that helped to fund it.16 This project is
The Central Subway Has the second phase (of three) of the Third Street Source: SPUR analysis. See Appendix B for sources.
Experienced Cost Increases of Light Rail Project. The first phase, the T-Third
40% and Will Open Three Line, opened in 2007. The Central Subway was
Years Late initially estimated to cost $647 million (in 2001)
The Central Subway, which will bring Muni and to take eight years to build, yet the cost
service to some of San Francisco’s most job-rich and schedule ballooned during the construction
districts, was first identified as a goal in the phase. The project is now anticipated to cost
1980s. Initial project planning and environmental $1.6 billion and to open in 2021, three years late
work for the project only began in 2005, after and 11 years after it started construction.17
the passage of a local ballot
16 San Francisco Municipal Transportation Authority (SFMTA), “Central Subway Project History,” www.sfmta.com/central-subway-project-history
17 Rachel Swan, “San Francisco’s Central Subway Hits Huge Delay—Won’t Open Until 2021,” San Francisco Chronicle, September 18, 2019, https://www.sfchronicle.com/bayarea/
article/San-Francisco-s-Central-Subway-hits-huge-delay-14432776.phpMORE FOR LESS 12
FIGURE 4
International Comparison of Construction the Barcelona L9/L10 metro, even though they use the
Sources: Compiled by SPUR. See Appendix A for Bay Area transit costs. European transit project costs originally presented in foreign currencies were converted using the average annual exchange rate for 2019. At the time of this writing, all of
Costs for Urban Rail Projects same tunneling technology and the L9/L10 extension
American urban rail projects regularly cost more on a is the longest and deepest in Europe and traverses
per-mile basis than comparable projects in Europe.18 highly developed neighborhoods. New York City’s East
This figure compares the costs per mile (in US dollars) of Side Access is included because New York is regularly
a sample of urban rail projects with a significant amount cited as having the highest urban rail construction costs
of underground tunneling. The Silicon Valley BART in the world.
extension costs almost four times as much per mile as
Our project costs start high. Many projects have come to cost so much that it is easy to cast doubt
on whether we should be building them at all. Out of more than 90 capital projects submitted to MTC for
consideration in Plan Bay Area 2050 in 2019, fewer than a dozen had benefits that exceeded costs.19Despite high
initial costs, large projects face a number of challenges that make them particularly vulnerable to cost overruns,
as detailed on page 16.
Project delivery reform is not just a money issue—it is an issue of equity and the environment. When capital
projects go over budget, transit agencies look for ways to bridge the shortfall. First they look to find cost savings
in the project’s design (“value engineering”), then they take from their operating budgets, across both rail and
local transit services. This can disproportionately impact people with low incomes, who make up over half of the
Bay Area’s transit riders.20 One prominent example is BART’s Oakland Airport Connector. As costs escalated,
BART cut promised stations in East Oakland and sought to reallocate funding for buses that would connect to
the project.21 Low-income households are doubly vulnerable to project delivery problems — first because of the
the European projects are still under construction and subject to change .
delay in improved transit, and second because escalating costs can threaten to diminish the quality of existing
service.
Project delivery is also a determining factor in the region’s ability to reduce greenhouse gas emissions and
avoid a global climate catastrophe. The Bay Area is expected to fail to meet its 2035 climate targets,22 in part
18 Alon Levy, “Why It’s So Expensive to Build Urban Rail in the U.S.,” CityLab, January 16, 2018, https://www.citylab.com/transportation/2018/01/why-its-so-expensive-to-build-
urban-rail-in-the-us/551408/
19 MTC, “Project Performance Assessment,” February 2020, https://mtc.ca.gov/our-work/plans-projects/horizon/project-performance-assessment
20 See note 6.
21 Joel Ramos and Clarrissa Cabansagan, Crossing Together: Equity Considerations for a Second Transbay Crossing, TransForm, 2017, https://www.transformca.org/transform-
report/crossing-together
22 Under SB 375, Plan Bay Area, the region’s sustainable communities strategy, must meet or exceed a greenhouse gas reduction target of 19% by 2035. Bold strategies that result
in less driving will be required to meet this target. See: “Plan Bay Area 2050 Draft Blueprint: Setting the Stage,” presented by Dave Vautin to the MTC and Association of Bay
Area Governments (ABAG) Executive Board on January 31, 2020. https://mtc.legistar.com/MeetingDetail.aspx?ID=752053&GUID=B43014E3-E6FA-4EAA-B3FE-0260C3EB778D&
Options=info|&Search=MORE FOR LESS 13
because it has not delivered efficient and reliable transit that makes transit more attractive than driving. At
present, the transportation sector is responsible for 40% of all of the greenhouse gas emissions in California,
largely because of our overreliance on passenger vehicles.23 The percentage of people in the Bay Area who drive
alone to work has hovered at about 66% on average (and closer to 80% in some counties) since the 1980s.24 All
realistic paths toward achieving dramatic reductions in greenhouse gas emissions involve transit capacity and
transit connections that simply do not exist today. There is no time to wait.
23 Legislative Analyst’s Office, Assessing California’s Climate Policies — Transportation, December 21, 2018, https://lao.ca.gov/Publications/Report/3912#Key_Takeaways_From_
Review_of_Major_Policies
24 MTC, “Historical Commute Mode Choice,” Vital Signs, updated May 2018, http://www.vitalsigns.mtc.ca.gov/commute-mode-choiceMORE FOR LESS 14
The Project Life Cycle
This paper addresses challenges throughout a project’s life cycle, starting with regional planning and project
selection and continuing through project planning and ultimately project delivery. Each of these prototypical
project phases is described below.25 These phases will be referenced throughout this report.
FIGURE 5
TRANSPORTATION PROJECT LIFE CYCLE
Regional Planning
Establish the vision for the transit network and service performance standards for each part of
the network. Standards include operational and user-focused elements and aim to achieve
environmental, social and economic outcomes. Project selection is based on these regional goals
and outcomes.
Project Initiation
Establish an integrated project management team; engage the public in the project vision and
design; determine the project’s planning vision, objectives and strategic outcomes in relationship
to the regional network plan; assess the project feasibility; and compare initial investment Project Definition
options.
and Design
Project Development
Confirm the need for the project, continue public engagement, evaluate investment options,
complete environmental review, select a preferred investment option, conduct initial design and
engineering, establish a funding and financing program, secure funding and financing, complete
a project-delivery-options analysis with a value-for-money analysis and risk assessment,
complete final design and engineering, and secure permits and approvals from all resource and
regulatory agencies.
Procurement
Implement the selected project delivery approach, prepare project for market, bid the contracts
for construction and determine workforce requirements.
Project Construction
Finalize execution strategy, build the project and ensure that the project is ready for
operations/service. Project Delivery
Operations
Bring project into service.
Closeout
Monitor, evaluate the lessons learned and measure project performance against expectations.
25 There is some simplification in this description, which tends to reflect a process that uses a more traditional deliverability approach such as design-build.MORE FOR LESS 15
Big Idea 1
Improve regional transportation
planning, project selection and
project oversight.
Good projects start with good planning. The recommendations in this section emphasize a stronger role for
regional planning, project evaluation and project selection. Additionally, large transportation projects are
uniquely complex and require a higher level of oversight and project controls, particularly in the early phases, to
spot warning signs and correct future problems.
Challenge:
The Bay Area’s fragmented transportation governance system makes it extremely
difficult to align around a shared vision for the transit network and the projects
that will deliver it.
There are more than two dozen transit agencies and nine countywide congestion management agencies in the
San Francisco Bay Area, each with its own unique geographies, funding structures, services and priorities. Having
so many different agencies with a hand in planning and funding transit makes it harder to create a shared vision
for the region’s infrastructure needs and to make rational funding decisions that are good for the region as a
whole. Exacerbating the challenge, each agency wants its projects to be included in the regional transportation
plan so that it can be eligible for scarce regional, federal and state discretionary funding, which leads to a deeply
competitive project selection process. Currently, the process for developing the regional transportation plan is
that each agency nominates projects to MTC for inclusion in Plan Bay Area and MTC evaluates them according
to cost-benefit metrics and qualitative criteria. As a result, the region’s long-range transportation plan is a
piecemeal set of projects collected from local nominations and political negotiations rather than a shared vision
developed from a regional set of environmental, social and economic goals.
At the project level, each agency has different priorities driven by its business and operational requirements.
It can be hard to find common ground, let alone a shared vision. Further, there are few incentives or standard
processes to encourage making shared decisions or prioritizing regional outcomes. State and federal transit
funding programs have generally not emphasized integration.26
Fragmented institutions, timelines and funding sources often stand in the way of planning collaboratively
or selecting investments rationally. Adjacent or connecting projects are often planned independently instead of
as one project — on different timelines, with different budgets and without sufficient consideration for phasing
of decisions and construction. These differences tend to be “solved” by increasing the scope and size of the
26 CalSTA’s Transit and Intercity Rail Program (TIRCP) is a rare exception that emphasizes integration between systems, particularly integration with high-speed rail. See: https://
dot.ca.gov/programs/rail-and-mass-transportation/transit-and-intercity-rail-capital-programMORE FOR LESS 16
infrastructure or by sacrificing operational efficiency.27 For example:
> Caltrain and the California High-Speed Rail Authority have agreed to share the rail corridor between
San Francisco and San José, but each has different operating requirements. Consequently, initial plans
were based on an assumption that high-speed rail would not be able to fit within the footprint of the
station and would need to operate in a physically separate aerial structure above the existing station.
This new structure would have further bisected downtown San Jose, which already faces struggles where
Highway 87 cuts through it. In 2018, after a study tour hosted by SPUR showed new ways of operating
and designing high-speed rail stations, the plans for an aerial structure were abandoned in favor of an at-
ground configuration.
> The City of San José sold public land immediately adjacent to Diridon Station and the railyard to a
developer. A portion of the parcel had been identified as necessary to create a better rail alignment that
would allow faster train speeds and more trains per hour. Though the decision to sell the land will bring
long-awaited economic development to the area, it compromises both rail operations at one of the
region’s most significant transit hubs and the long-term capacity of the rail network.
> BART’s Antioch line travels through the Berkeley hills tunnels and is bisected by the Hayward Fault, an
active earthquake fault. In 2015, the BART board of directors weighed several options for how it would
upgrade the tunnels as part of its earthquake safety program. One of the considerations was whether
or not to take a tunnel out of service to do the seismic upgrades. Of the two final options considered,
one would have taken a track out of service during construction and provided express bus service to
passengers on Highway 24. It would have cost $284 million and delivered better safety in just over four
years. The second option would require a new tunnel but would not significantly disrupt service on
the existing tunnels. It would cost $918 million and require almost 10 years to build.28 Preferring not to
disrupt service, the board ultimately chose the latter option, requiring an extra $700 million and six years
of construction to drill a third tunnel. The selected option had a poor economic and financial case and
deviated from the most important policy goal of improving safety as quickly as possible.
Challenge:
Projects often suffer from poor cost-benefit estimates at the outset, which distorts
project selection and has cascading impacts through the life of a project.
Newly nominated transit ideas and projects are most likely to suffer from poor initial estimates of costs and
benefits.29 In reviewing a sample of recently completed or ongoing transit projects in the Bay Area, SPUR found
large differences between initial cost estimates and cost estimates done during the environmental review phase,
27 Alon Levy, “Why American Costs Are So High (Work-in-Progress),” Pedestrian Observations, March 3, 2019, https://pedestrianobservations.com/2019/03/03/why-american-
costs-are-so-high-work-in-progress/
28 “BART Earthquake Safety Program,” presented by Robert Mitroff to the BART Board of Directors, May 28, 2015, https://www.bart.gov/about/bod/meetings/2015
29 Karen Trapenberg Frick, “Megaplanning for Mega and Mini Projects: Common Challenges and Ways Forward,” Appendix C in Ratna Amin, Caltrain Corridor Vision Plan, 2017,
https://www.spur.org/publications/spur-report/2017-02-23/caltrain-corridor-vision-planMORE FOR LESS 17
when the scope of the project is clearer and the design is more advanced. Further, actual costs are almost always
much higher than initial estimates. For example, the actual costs for the Transbay Transit Center were 40% higher
than the initial estimates.
In the Bay Area, financial and political commitments are made to projects before the costs are well defined.
Project selection occurs early and is based on initial cost estimates, skewing decisions toward projects that may
not be cost-effective upon further design and analysis. By the time a project is finished, the costs may have
increased so much that it is unlikely the project would have been selected had realistic cost-benefit metrics been
available at the outset. See Figure 6 for greater detail.
FIGURE 6 the project progressed through design and not intended to pinpoint the precise causes of
Differences Between Estimated construction. Comparing the early estimates cost escalation for each project. The differences
and Actual Capital Costs with advanced estimates gives an indication often reflect the evolution and refinement as
This chart shows the proportion of a project’s of how much project cost estimates can a project moves beyond the most conceptual
costs that were accounted for early on in a change between the time that an initial public stage and should not be interpreted as
project’s life cycle and the proportion of a commitment is made and the point when a malfeasance.
project’s costs that only became known as project’s design comes into focus. This chart is
Downtown Extension Project***
Oakland Airport Connector***
International Boulevard Bus Rapid Transit***
(East Bay Bus Rapid Transit)***
Transbay Transit Center***
Caltrain Electrification***
(4th and King to Tamien)***
Central subway***
SMART Larkspur to Cloverdale***
Silicon Valley BART Extension Phase II - Santa Clara***
Source: SPUR analysis with support from Arup. See Appendix A for methods and sources.
Silicon Valley BART Extension Phase I - Berryessa***
BART Warm Springs***
-11%
0% 50% 100% 150% 200%
Initial construction cost Contingency and finance costs explicitly excluded from initial construction cost.
Change due to annual cost escalation Construction cost savings relative to advanced construction cost estimate
Change due to other factors
* Project under construction or incomplete.
** Project not yet begun and not yet bid.
*** Phase I is complete by not closed out. VTA reports an anticipated $45 million in savings.MORE FOR LESS 18
There are many reasons why initial cost estimates can meaningfully differ from actual project costs,
including:
> Shifting timelines: Projects often face a vicious cycle: The higher the initial cost, the longer it takes to fund
them. The longer it takes to fund them, the more the project costs. Project costs tend to increase on an
annual basis based on changes in construction costs (e.g., labor and materials), which can grow by 3% to
5% per year on average. When a project is delayed, the costs inevitably go up. This is particularly true in
a place like the Bay Area, where state and regional governments play only a very small role in prioritizing
capital investments and consequently there is significant pressure to spread limited funds thin across many
projects.
> Scope changes: The project may evolve steadily in scope, scale, construction method or technology from
the time it is conceived to the time it completes its environmental review.
> Limited resources for cost estimation early on: There are often few up-front resources to do rigorous
cost estimating in the early, conceptual stage of a project. Many projects are nominated to the region’s
transportation plan without a comprehensive feasibility assessment or a business case. Typically, these
early cost estimates do not include comparisons to the costs and timelines for similar projects and do not
account for financing costs, which can be sizable.30
> Optimism bias: Globally, projects are almost always subject to optimism bias, meaning that people tend
to estimate that a project can be delivered for less money and less time and with greater benefits than
actually occur.31
> Funding pressures: The federal government requires regional transportation plans to be fiscally
constrained, which means that the transportation investments included must be possible to fund
using reasonably anticipated sources of revenue as well as funding from local ballot measures.32 There
is significant pressure to make a project appear cost-effective for it to be included in the regional
transportation plan and therefore be eligible for federal and state funding.
30 Ibid.
31 Ibid.
32 Federal Transit Administration, “Financial Planning & Fiscal Constraint,” March 11, 2019, https://www.transit.dot.gov/regulations-and-guidance/transportation-planning/financial-
planning-fiscal-constraintMORE FOR LESS 19
Cost Estimation for London’s Elizabeth Line
Crossrail Ltd. is a publicly owned project delivery organization that is developing a new 73-mile railway
line, the Elizabeth Line, under the busiest part of London. A subsidiary of Transport for London, it is jointly
owned by Transport for London and the U.K. Department for Transport. In determining a cost estimate
for the project, Crossrail Ltd. built a comprehensive cost model that quantified risks and uncertainties
and settled on a “cost envelope,” or range, rather than a single number. This approach allowed Crossrail
Ltd. to have a more honest conversation with project sponsors about the uncertainties, encouraging their
full engagement in key decisions that were needed to deliver the project successfully and securing the
ability to successfully defend the program when political leadership changed. The early emphasis on risk
assessment translated into a focus on risk management in all parts of the project.33 Though the Elizabeth
Line, like other transit megaprojects around the world, has experienced delays and cost escalation, its most
recent cost estimate, at £18.25 billion, is still within reach of the initial cost envelope.
Together, these challenges mean that when a project makes it into the regional transportation plan or a
ballot measure, the cost estimate is probably too low. Low front-end cost estimates can lead project sponsors,
MTC and other policymakers to support projects that they might not have backed if they’d had more accurate
cost estimates. As time goes on, this can have cascading effects: Costs and timelines almost always increase
when a project goes through more thorough design and engineering; projects have to go back to the ballot and
public trust deteriorates; and project sponsors are often required to compromise on project design and quality
to make ends meet. Yet it takes great political bravery and personal risk to revisit a project that the public has
committed to in a ballot measure, even when it becomes riddled with red flags. Therefore, it is critical that the
Bay Area improve the up-front work of project evaluation and selection.
Recommendation 1:
Expand MTC’s authority to act as the region’s transit network planner.
Who’s responsible: California legislature, transit agencies, congestion management agencies
There are many places around the world with high-functioning, seamless transit networks that rely on multiple
operators to deliver services. These places all have one entity that’s accountable for designing the network. This
transit coordinator, sometimes referred to as a “network planner” or “transport alliance,” plans and integrates
projects, services, fares and customer information so that they add up to a more integrated and functional
network. The Bay Area is missing this critical institutional role.
Though MTC’s mandate is to be the transportation planning, financing and coordinating agency for the Bay
Area, it has not exercised its authorities to fulfill its planning and coordination functions. It focuses primarily on
its financing role, selecting which projects will receive state and federal funding. In part, MTC is limited by the
33 Simon Wright, Richard Palczynski, and Patrick ten Have, “Crossrail Programme Organization and Management for Delivering London’s Elizabeth Line,” Proceedings of the
Institution of Civil Engineers, 2017, https://learninglegacy.crossrail.co.uk/wp-content/uploads/2017/09/1R-001-Programme-organisation-and-management.pdfMORE FOR LESS 20
constraints of its own governance structure, which is made up primarily of officials who are locally elected and
therefore face competing commitments between making regional decisions and maximizing the investment in
their local communities. In part, MTC is also hampered by its lack of transit operating expertise, which at times
engenders pushback from operators. Ultimately, transportation planning is largely done by transit agencies and
county congestion management agencies. Thus, MTC ends up acting as a regional transportation project selector
rather than a regional transportation planner.34 As a result, the region’s transportation plan is useful for financial
planning but is fundamentally not a planning tool for long-range infrastructure buildout.
In other countries around the world, regional network planners play a critical role in guiding, evaluating
and selecting the capital projects that get built. They do this by establishing a long-range, service-based vision
to guide capital investment programs and by instituting a process through which projects are periodically and
objectively evaluated for their benefits, costs, deliverability and risks.
Recommendation 2
Develop a long-term strategic plan for a seamless network of regional transit and
managed highway lanes to guide capital investments.
Who’s responsible: MTC, transit agencies, cities, Caifornia State Transportation Agency (CalSTA), Caltrans,
California Highway Patrol (CHP)
A long-range plan for the region’s transit network would provide the vision and strategic direction for the Bay
Area’s infrastructure needs, making project selection more transparent and public dollars more purposeful. SPUR
recommends that MTC develop and implement a long-term strategic plan for service performance and capital
investments of the regional, trunk-line “backbone” network and for high-frequency routes that connect people
to the regional system. This should also include regional express bus service that runs on a network of highway
lanes that are managed and priced.35 (For more information, see SPUR’s forthcoming paper A Transit Coordinator
for the Bay Area.)
The strategic plan should:
> Identify key regional transit and managed-lane corridors for high-frequency, rapid transit services and key
corridors for feeder services into the rapid network.
> Define a service vision that provides regional transit services at regular, repeating intervals with minimized
wait times between transfers.
> Establish regional goals and standards for the quality of service on each corridor identified. The standards
should focus on access and cover two categories of service quality. The first is operational elements
such as frequency of service, hours of service, safety, reliability, timed connections, speed, productivity
34 For instance, for Plan Bay Area 2050, local governments, transportation agencies and congestion management agencies nominated 93 projects for evaluation. With a $423
billion backlog for operations, maintenance and repair, MTC is only considering a handful of low-cost projects sprinkled throughout the region, along with funding to study a
second transbay crossing, as of this writing. See: MTC, “Plan Bay Area 2050: Draft Blueprint Strategies,” presented February 20, 2020, to the Joint MTC Planning Committee with
the ABAG Administrative Committee.
35 For the purpose of this paper, express lanes (also referred to as high-occupancy toll lanes or HOT lanes) are a form of managed highway lanes that can be used by high-
occupancy vehicles for free while permitting access to other vehicles for a variable fee that is adjusted so that these vehicles will not exceed available capacity in the lane.
Regional express bus service refers to bus service that primarily operates at a multi-county or regional scale, traveling on managed highway lanes and making limited stops. Such
services often extend outside the boundaries of a single transit district.MORE FOR LESS 21
and interoperability(the ability for different services to use the same tracks, vehicles, maintenance yards
and signal systems). The second is user experience elements such as information display, schedule
coordination, ease of transferring between services, ticketing and fare policy, amenities and comfort.
Importantly, the service vision and standards must drive capital investment decisions. The plan provides a
strategic framework for the wider public policy objectives that capital investments should achieve. SPUR believes
that MTC should only allocate funding from regional ballot measures and state discretionary funds to projects
that align with the long-range strategic plan. The strategic plan should be coupled with a list of priority projects
that are significant to the region and a funding plan for implementation in five-year and 10-year increments.
Absent an implementation plan that is consistent from year to year and makes clear the standing of each project,
the intense competition between transit agencies for every new funding opportunity will continue.
The Bay Area can draw on international best practices for models of network planners. For example,
the network planner in Zurich, ZVV, establishes a service-based vision for the region. ZVV determines public
transit service frequencies based on population and employment density with no bias for either bus or rail. The
standards are organized into “supply zones,” areas with a combination of at least 300 people, jobs and training
places. These are served at least hourly by at least one stop.36 The service levels increase based on the size and
density of the place on a regular, repeating schedule, increasing to minimum service frequencies of an hour,
half hour or every 15 minutes.37 Capital investments are made only as necessary to achieve the service vision
and reliable travel times. In this way, the service-based plan is used to prioritize future capital investments:
Improvements are made only if they work to achieve that schedule regardless of whether they meet the transit
agency’s own performance goals or political commitments.
There’s already a model for success closer to home. In 2018, California developed a service-based state rail
vision, with hourly and half-hourly service minimums on key state corridors. Since then, rail agencies across the
state have been working together to implement this plan by doing more detailed business planning and rail
planning in each corridor. Caltrain is currently in the process of completing its business plan, which includes
a program of capital investments for increased service. Capitol Corridor, Caltrain, Altamont Corridor Express
(ACE), the California High-Speed Rail Authority, the San Joaquin Regional Rail Authority and Alameda County
Transportation Commission are working together on a Northern California Network Integration plan to map out
the infrastructure needs and trade-offs to achieve the state’s vision. The state rail plan’s strategic vision provided
a foundation for transit agencies and operators to do more detailed capital and operational planning to meet
that vision, which can in turn inform the Bay Area’s priority investment strategy and federally mandated regional
transportation plan.
Recommendation 3
Establish a “stage gate” process with phases and periodic decision points to
determine a project’s readiness to advance into the next stage in the project life
cycle.
Who’s responsible: MTC
36 Tim Petersen, “Network Planning, Swiss Style: Making Public Transport Work in Semi-Rural Areas,” Proceedings of the 32nd Australasian Transport Research Forum (ATRF).
https://www.researchgate.net/publication/254609967_Network_planning_Swiss_style_Making_public_transport_work_in_semi-rural_areas
37 Paul Mees, Transport for Suburbia: Beyond the Automobile Age, Earthscan Publishing, 2010.MORE FOR LESS 22
Several countries have developed very robust institutional frameworks to ensure accountability and transparency
in project delivery and excellence in planning and construction, with many agencies playing a discrete role. For
example, the United Kingdom has an agency that evaluates and selects capital projects using standardized
criteria, Network Rail, as well as a public-sector cabinet-level (national) Infrastructure and Projects Authority,
which supports project delivery across many infrastructure sectors for projects receiving public funds, and a
National Audit Office, which provides oversight on major capital projects and agencies like Crossrail Ltd.
The Bay Area lacks a strong framework for accountability and transparency in project delivery. SPUR
recommends a bigger role for MTC in providing oversight and accountability over major transit projects. MTC is
well positioned to take on a greater oversight role both because it assumes some of the financial risk as a project
investor and because it has a broad mandate to serve the public.
One way to address this is for MTC to establish a stage gate process. A stage gate process is a project
management technique that divides a project or process into phases or stages, separated by decision points,
known as “gates.” During a transit project’s selection and funding, stage gates occur at major project phase
transitions and govern whether a project can move to the next stage toward delivery and operation. At each
stage gate, project sponsors are required to submit a set of deliverables for evaluation. Stage gates are intended
to prevent agencies from making commitments to projects before it is determined that the project is sound, that
project sponsors and delivery agents are positioned to succeed, that the goals and objectives remain clear and
understood and that the project can be expected to deliver on those goals and objectives within current funding
and time constraints.
MTC should define periodic reviews that take place between stages in the transit selection and funding
process, using the results of the review to allocate funding and make sure that all actors are fully coordinated
and aligned. The review process should be designed to accomplish the following:
> Assess project progress.
> Ensure transparency among stakeholder agencies.
> Identify and reduce project uncertainties.
> Coordinate and gain alignment among project sponsors, funders and other decision-making entities.
> Determine the project sponsor’s organizational readiness.
> Ensure that funding is distributed only to the projects that are ready to advance.
> Support learning by evaluating project performance.
This use of stage gates is a broadly applied best practice. Internationally, it has been deployed with success
by a number of delivery organizations for major transit projects. For example, Network Rail, the manager for
most of the railway network in the United Kingdom, applied a stage gate process to the Elizabeth Line project;
initially intended as guidance, it evolved to inform the governance framework for the project as it revealed the
need for stronger decision-making. (See sidebar “Network Rail’s Governance for Rail Investment Process” on
page 23.) In the Australian state of New South Wales, infrastructure investment follows a gateway review process
with detailed guidance to assist lead agencies in managing structured and transparent reviews between each
stage. Similarly, the U.S. Federal Transit Administration (FTA) uses a form of stage gates, defining deliverables
that project sponsors must submit in each phase of a project’s life cycle in order to receive funding from the New
Starts program.38 This provides sponsor agencies with a clear road map for what must be done to deliver project
funding. However, this prominent U.S. model is focused more on funding qualification than on project delivery.
38 Federal Transit Administration (FTA), “Final Interim Policy Guidance Federal Transit Administration Capital Investment Grant Program,” June 2016, https://www.transit.dot.gov/
sites/fta.dot.gov/files/docs/FAST_Updated_Interim_Policy_Guidance_June%20_2016.pdfYou can also read