Lake Forest College Publications - Lake Forest College - Core
←
→
Page content transcription
If your browser does not render page correctly, please read the page content below
Lake Forest College
Lake Forest College Publications

Senior Theses Student Publications

4-27-2020

An Economic Analysis of The Pink Tax
Hajar L. Habbal
Lake Forest College, habbalhl@lakeforest.edu

Follow this and additional works at: https://publications.lakeforest.edu/seniortheses

 Part of the Economics Commons, and the Taxation Commons

Recommended Citation
Habbal, Hajar L., "An Economic Analysis of The Pink Tax" (2020). Senior Theses.

This Thesis is brought to you for free and open access by the Student Publications at Lake Forest College
Publications. It has been accepted for inclusion in Senior Theses by an authorized administrator of Lake Forest
College Publications. For more information, please contact levinson@lakeforest.edu.
An Economic Analysis of The Pink Tax

Abstract
The “Pink Tax” broadly refers to firm pricing strategies and/or government policies that raise transactional
costs (usually higher taxes or higher prices) for women. Conversations about the Pink Tax have been
steadily growing over the past several decades; people have conflicting views on its existence, causes,
and implications, to the point that there are substantive questions regarding its validity. More research is
needed to determine where exactly the Pink Tax comes from and what are its true effects. For those who
argue that the Pink Tax exists and is detrimental to females, a leading explanation for the transmission
mechanism is through the propagation of gender socialization trough marketing strategies. Due to the
lack of government data that allow for direct measurement of the Pink Tax, this study provides an
analysis of consumers’ exposure to marketing. Specifically, this study correlates gender, age, race, marital
status, and marijuana use (to proxy for preferences for certain types of behavior) with marketing
exposure, to offer support for the claim that the Pink Tax benefits from this transmission mechanism. The
findings demonstrate there is a strong inverse relationship between education and marketing exposure,
measured by hours spent watching television in a week as a teenager.

Document Type
Thesis

Degree Name
Bachelor of Arts (BA)

Department or Program
Economics, Business, and Finance

First Advisor
Robert J. Lemke

Second Advisor
Amanda J. Felkey

Third Advisor
Susan M. Long

Subject Categories
Economics | Taxation

 This thesis is available at Lake Forest College Publications: https://publications.lakeforest.edu/seniortheses/163
LAKE FOREST COLLEGE

 Senior Thesis

 An Economic Analysis of The Pink Tax

 by

 Hajar L. Habbal

 April 27, 2020

 The report of the investigation undertaken as a
 Senior Thesis, to carry two courses of credit in
 the Department of Economics, Business, and Finance

_______________________ _______________________
Davis Schneiderman Robert J. Lemke, Chairperson
Krebs Provost and Dean of the Faculty

 _______________________
 Amanda J. Felkey

 _______________________
 Susan M. Long

 _______________________
 Elizabeth Benacka

 _______________________
 Patricia Thomas

Abstract

 The “Pink Tax” broadly refers to firm pricing strategies and/or government

policies that raise transactional costs (usually higher taxes or higher prices) for women.

Conversations about the Pink Tax have been steadily growing over the past several

decades; people have conflicting views on its existence, causes, and implications, to the

point that there are substantive questions regarding its validity. More research is needed

to determine where exactly the Pink Tax comes from and what are its true effects. For

those who argue that the Pink Tax exists and is detrimental to females, a leading

explanation for the transmission mechanism is through the propagation of gender

socialization trough marketing strategies. Due to the lack of government data that allow

for direct measurement of the Pink Tax, this study provides an analysis of consumers’

exposure to marketing. Specifically, this study correlates gender, age, race, marital status,

and marijuana use (to proxy for preferences for certain types of behavior) with marketing

exposure, to offer support for the claim that the Pink Tax benefits from this transmission

mechanism. The findings demonstrate there is a strong inverse relationship between

education and marketing exposure, measured by hours spent watching television in a

week as a teenager.
To my sister whose anger about razor prices fueled my passion for the subject

 and to my parents for pushing me to achieve my dreams.
Acknowledgments

 I wish to acknowledge the support and great love of my family, my mom, Touria; my
dad, Omar; and my sister, Dahlia. They kept me going on and this work would not have
 been possible without their support.

 I would like to thank my academic and thesis advisor, Professor Robert Lemke, for his
 time, help, and encouragement over the course of my college career. Being my biggest
 supporter at Lake Forest College, I am grateful for his continuous mentorship. Thanks
also to my committee members for their comments, support, and advice, not only for my
 senior thesis, but for much more.

I would also like to thank my friends who have listened to me talk about the Pink Tax for
 the past 10 months and who have accompanied me on numerous sleepless nights at the
 library.

 Lastly, I would like to thank the institution of Lake Forest College. Without its
 impeccable education and its marvelous professors, my dreams of writing a thesis on a
subject that deeply mattered to me would have not been honored. Thank you Lake Forest
 College for giving me this chance. I will always be a Forester Forever.
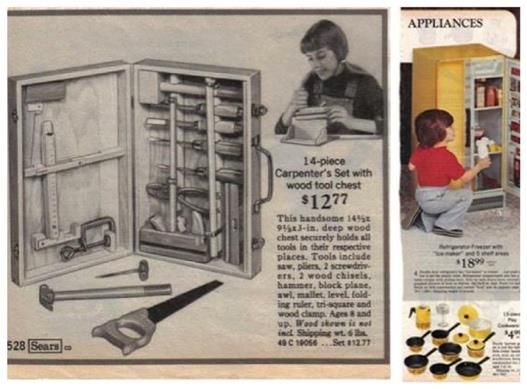
Table of Contents

I. Introduction…………………………………………………………………………… 1

II. Gender Socialization …………………………………………………………………. 2

III. Gender-Based Price Discrimination ...………………………………………………. 8

IV. The Tampon Tax ...……………………………………………………………...….. 12

V. Specific Examples of the Pink Tax ...……………………………………………….. 18

VI. The National Longitudinal Survey of Youth, 1979 …...…………………………… 32

VII. The Econometric Model ……………………………………………….………….. 35

VIII. Regression Results ………………………………………………..……………… 37

XI. Policy Prescriptions …………………………………………………...…………… 41

X. Conclusion ……………………………………………………………………...…... 51

References ……………………………………………………………………………….53

Appendix: Visual Examples of the Pink Tax ……………………………………………59
I. Introduction

 Gender-based price discrimination is a form of economic discrimination that

occurs when one gender is charged a different price than the other for identical (or nearly

identical) products or services. Within the sphere of gender-based price discrimination,

the “Pink Tax” refers to the extra charges placed on products and services that are

essentially identical but are marketed separately to men and women (e.g., the price

difference between a “male” and “female” deodorant). The name, the Pink Tax, stems

from the historical prevalence of products being marketed to women having a tendency to

be pink in color. The Pink Tax manifests itself in two ways. First, certain products or

services bear an additional tax to the price. Second, which is not literally a tax, firms sell

products marketed to women at a higher price than they sell (nearly identical) products

marketed to men. In this second case, firms are not charging higher prices on female

products out of malice but are following a profit-maximizing strategy that capitalizes on

market trends, preferences, shopping behavior, and psychology. Even though a literal tax

is not in place, many women feel compelled to pay these higher prices for a variety of

reasons. Thus, when the market bears higher prices on “female” products, therefore, a

financial burden is being placed on women that is not placed on men, epitomizing social

gender-stereotypical norms whether the firm’s discriminatory pricing is intentional or

not.

 1
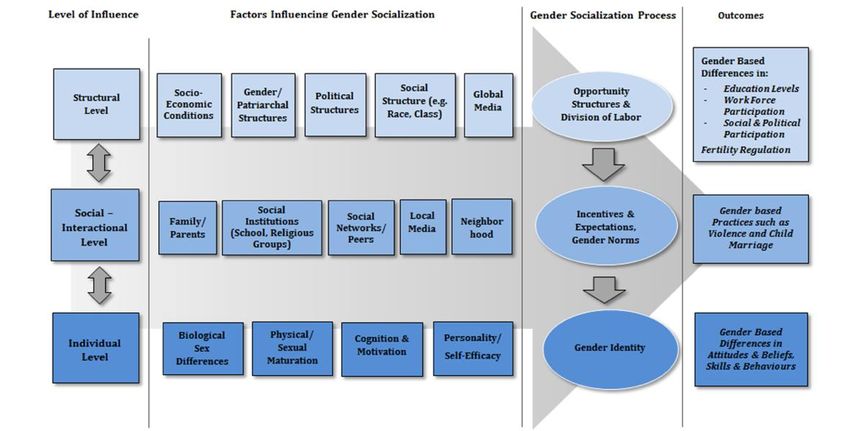
II. Gender Socialization

 The Pink Tax arises from the pressure of following stereotypical gender norms in

order to fit in society (Smith, 2007). The appropriate term here is called “gender

socialization.” Gender socialization is the process by which people learn how they

“should” act based on their sex. To be specific, gender socialization starts with the

stipulations that biological sex determines an individual's masculine or feminine identity.

Gender applies to the facets of self that are non-physiological in nature. For the purpose

of this paper, gender will be defined in the traditional sense of being binary (women are

females and men are males) as opposed to the more recent convention of gender being on

a continuum. Granting that an individual's gender is not independent of his or her sex,

gender varies by the culture someone lives in. As such, gender can vary from one culture

to another, which is extensively seen through the process of gender socialization (Smith,

2007). Gender socialization then refers to how society intentionally and unintentionally

teaches rules, norms and expectations for both sexes. According to UNICEF (2017),

gender socialization can be compartmentalized into three different groups of influence

levels: structural (e.g. socio-economic conditions), social-interactional (e.g. family) and

individual (e.g. biologically). Figure 1 provides a visual description of the entire process

of gender socialization working through these three levels.

 Structural influences of gender socialization manifest through socio-economic

conditions, gender/patriarchal structures, political structures, social structures (like race

and class), or global media (John, Stoebenau, Ritter, Edmeades & Balvin, 2017). Despite

the complexity of the relationship between the different factors affecting the process of

gender socialization, it has been demonstrated that, among the predictors, socio-economic

 2
conditions and patriarchal structures strongly affect this process at the macro-level.

Patriarchy is a social system in which, generally speaking, men hold much more power

than women in all aspects of society, including inside households, at work, and in

politics. Consequently men, rather than women, are bestowed political leadership

positions, moral authority, social privilege, and property ownership (Sultana, 2010). This

relationship at the macro-level necessarily correlates human development and gender

equality at the country level (Hausmann, 2014). For instance, the human development

index (HDI) is a cross-country measure of human well-being within a country, taking into

account economics, health, education, human rights, etc. The UNICEF report (2017)

shows that countries with high levels of HDI are typically associated with more gender

equality compared to countries with low levels of HDI. In terms of women’s well-being,

higher HDI implies countries with a high human development index (HDI)1 are shown to

be more gender-equal, which is measured as having good reproductive health,

opportunities for gender empowerment, and greater labor market participation for

women, (e.g. Norway, Switzerland, Germany) compared to countries with lower levels of

HDI that don’t afford women these benefits (e.g. Niger, Chad, South Sudan).

 However, as direct as this correlation may seem, socio-economic development

and gender equality do not necessarily move lock step together. Sometimes, based on

geographic location and geopolitical context, countries with a fairly high HDI can have

low gender equality levels (e.g. Iran, Egypt). That is, the political landscape also dictates

how gender socialization manifests itself. If women and men do not have equal access to

 1
 The Human Development Index measures life expectancy, employment, and per capita income
in order to rank and divide countries into four tiers of human development.

 3
opportunity, a distinction between genders will almost certainly be perpetuated. As

women increase their role in male-dominated areas, such as politics and traditional male-

dominated industries like law and finance, a platform for women to be more vocal and to

seek the recognition that they deserve is created. That platform also provides the

necessary tools for adolescent girls to have same-sex role models further their own

development and advancement (Slaby & Frey, 1975). The same goes for women

portrayed in public media. The more often women are represented as existing outside

their typical gender, the more readily girls will break from stereotypes and contest the

gender socialization process that is ever-present in current society (Koenig, 2018). The

shift away from women’s traditional role in the household to powerful women in the

workforce gives even more importance to those women holding professional careers

(Smith, 2007).

 The social interactional influences of gender socialization that perpetuate gender

stereotypes are family, neighbors, schools, social networks and peers. According to

several studies, children use gender categorization (male or female) to focus their

attention on same-gender role models (Martin & Ruble, 2004). They observe and absorb

the behaviors of those models and figure out the differences in behavior between

one gender and the other. Learning from these models, children are more likely to exhibit

the same behaviors of the role models they identify with, and in so doing, form a strong

idea of what their gender “can” and “cannot” do. Moreover, when these stereotypes are

perpetuated by model agents like parents, peers, teachers, and figures in the media,

children become even more rigid about their belief (Martin & Ruble, 2004).

 4
The last level of influence in the gender socialization process is at the individual

level. Humans are all different biologically, physically, cognitively, and personality-wise.

Because of individual differences, humans are taught to act differently towards each other

in a continuous cycle. If a person is a woman, she will be treated differently than if she

was a man. From that difference at the individual level, many stereotypes, created by the

process of gender socialization, are perpetuated and affect how one is treated. Even

before a baby is born, caregivers may feel the need to appropriate a certain color pallet to

the gender of the infant. Paoletti (2012) makes the argument that this particular

construction – pink is for girls and blue is for boys – is a fairly recent construct. Prior to

the 20th century, white was the popular color for children's clothes since it was simpler to

clean and wash. However, the introduction of a gendered color pallet escalated in the

1980s. Paoletti observes that that the demand for (or, at least consumption of), gender-

specific baby clothing arose as a result of people wanting to learn the sex of their baby

before the birth, which became possible in the 1980s when such tests became affordable.

With parents learning whether they were having a girl or a boy, they became more

inclined to decorate the nursery long in advance with the "appropriate" color, blue for

boys and pink for girls, and toys (Paoletti, 2012). Manufacturers and designers took

advantage of the market and offered parents a greater opportunity to “identify” they baby

as a baby girl or as a baby boy by offering gendered products for newborns, including

clothing, toys, crib bedding, wallpaper, and even baby shampoo. All of this product

marketing and consumption behavior perpetuates gender socialization (Paoletti, 1987).

 Additionally, after birth, the child is exposed to many terms and symbols that

shape their conception of gender roles and stereotypes. Stereotypes, although associated

 5
to a negative connotation, are very useful to navigate the world. Categorizing people into

boxes based on similarities can help humans organize their thoughts and make the world

a less confusing place. The stereotypes children encounter can be seen through the

language people use to describe or talk to a child, in person or portrayed through the

media. For example, parents (and family, friends, neighbors, and the media) often

describe boys through their physical characteristics, strength and agility, while girls are

assessed through the concepts of beauty, fragility and emotions (Smith, 2007).

Furthermore, one flagrant way children are differentiated by gender is through the toys

advertised to them. Even though some parents have adapted to the changing society and

push their child to explore different toys based on their likes and not society’s pressure,

the world still has a long way to go. It is truly important for model agents to understand

the impact of their behaviors and suggestions near children because beliefs about gender

are formed at a very young age.

 Through one’s developmental cycle, gender socialization is continuously

perpetuated in everyday life situations. For example, women are expected to look pretty

and put together. Throughout the 20th century to the present, society has told women that

they had to wear makeup and be “presentable” in the workplace. Even with women’s

advancement in more powerful positions in the last 30 years (e.g., in banking, the law,

medicine, etc.), society still expects women to look and dress a certain way in order to be

taken seriously and on par with their male colleagues (Dellinger & Williams, 1997).

Presently, this phenomenon is often discussed on blogs and in online forums all across

the world, because while women feel the pressure to appear visually pleasing, they also

recognize the extreme cost to do so. Even having to purchasing a basic drugstore

 6
eyeshadow and mascara in order to be presentable is an expectation, and an additional

cost, that is not expected of men. The cheapest eyeshadow and mascara at a local

Walgreens cost $1.09 and $1.99 respectively; with taxes, this comes to $3.33 in Lake

County, IL. And, makeup is only one of the countless “requirements” for a women’s

social acceptability in the workplace. A professional women will need to have her hair

done, wear a professional pair of shoes, wear designer clothes, and own elegant jewelry

in order to even be welcomed into some professions, not to say anything about what it

may take to earn promotions or gain power (Dellinger & Williams, 1997). Obviously,

every decade has its own stereotypical trends, and women were not always required to

wear makeup, however, in the 21st century, they are (Zosuls, Miller, Ruble, Martin, &

Fabes, 2011). Overall, gender stereotypes are cultivated/promoted and carried throughout

society, through gender socialization, which results in the Pink Tax.

 At the three different levels of influence mentioned previously, there are forces

that affect a certain gender more than another, which can lead to negative economic

impacts. At the structural level, there are gender-based differences in education, the

workforce, socio-political participation, and reproductive health regulations. At the

social-interactional level, gender socialization may manifest itself in marital violence and

child marriage. Lastly, at the individual level, gender socialization affects women and

men by cultivating different attitudes, beliefs, skills and behaviors across the genders. In

this way, gender socialization creates the basis for an unseen bias or expectation being

placed on a gender. Specifically, these outcomes of gender socialization in the 21st

century continue to perpetuate the foundation of a gender-based price discrimination, also

known as the Pink Tax.

 7
III. Gender-Based Price Discrimination

 In order to eventually discuss gender-based price discrimination, we must first

discuss price discrimination in general.

 Price discrimination occurs when identical or nearly identical goods and services

are priced differently to different sets of consumers, and the price differences cannot be

attributed to differences in production costs such as transportation costs. For example,

charging higher prices in Hawaii than in California for avocados grown in California is

not price discrimination as long as the transportation cost accounts for the additional

price charged in Hawaii. On the other hand, McDonalds charging senior citizens $0.79

for a coffee but charging $1.09 for the same coffee bought by anyone else is price

discrimination.

 Price discrimination is a selling tactic that firms use to maximize their profit.

When consumer groups are identifiable, with each group having different average

preferences or a different budget or a different willingness to pay for a product, charging

a menu of different prices allows the firm to segregate the market into smaller markets,

and ultimately charge the profit maximizing price in each market rather than choosing a

single price across all markets.

 To be technical, when consumer purchase a good or service, except for the

marginal buyer, each consumer would have been willing to pay even more at the point of

purchase. The difference between one’s willingness to pay and the actual price paid is

termed the consumer’s surplus. Summing each consumer’s surplus across the entire

market is called “Total Consumer Surplus” by economists. (As a side note, graphically

total consumer surplus is the area under the demand curve and above the market price).

 8
Consumer surplus is an important concept for economists as it represents the value of the

market to consumers (Liston-Heyes & Neokleous, 2000).

 Now, turning attention to price discrimination, the idea is simply that by charging

different groups of consumers a different price, the firm can capture some of the

consumer surplus. That is, price discrimination is a way to extract more money from

consumers and to increase firm profits. Price discrimination is pursued whenever the

profit gained by creating segmented markets is greater than the profit earned from selling

to a single market. Thus, price discrimination is only effective if (1) different consumer

groups are identifiable, and (2) if the groups vary systematically in their willingness to

pay for the good, and (3) the high value group maintains relatively inelastic demand for

the good so that they are willing to pay the higher prices. Consumers tend to pay a higher

price in a fairly inelastic submarket, while consumers in a fairly elastic submarket pay a

lower price. Linking this to gender socialization is straightforward. The process of gender

socialization tells women that women are supposed to look, dress, and act a certain way,

and that as a woman, you should not ignore these social norms. The immediate

consequence, therefore, is that women, taken on average as an identifiable group separate

from men, have highly inelastic demand for the “necessities” of life in a society that

dictates particular behavior.

 Economics and the law distinguish between three degrees of price discrimination:

perfect-price pricing (1st degree), bulk pricing (2nd degree), and target market pricing (3rd

degree). First degree price discrimination tracks each consumer’s demand curve

perfectly, as each consumer is charged their willingness to pay. In this sense, first degree

price discrimination is demand-based since it depends on the willingness-to-pay of

 9
consumers (Ferrel, Kapelianis, Ferrell & Rowland, 2018). As first degree price

discrimination occurs when a firm sells its product at the maximum price possible for

each unit consumed, first degree price discrimination allows the firm to capture all

consumer surplus and maximize firm profits. A key feature of first-degree price

discrimination, therefore, is that the firm negotiates price with each individual consumer.

For example, at a souk, consumers can bid on a product and sellers might be over-pricing

it, but the consumer will only pay the maximum they are willing to spend. Pure first-

degree price discrimination is rare in the marketplace, because most goods are not so

expensive as to afford the firm the ability to assign resources to the negotiation process.

 Second degree price discrimination occurs when prices are based on the amount

purchased (i.e., buying in bulk). This form of price discrimination happens more often

than first degree price discrimination and can regularly be seen at wholesale markets like

Costco Wholesale Corporation, Home Depot, and even at grocery stores where per unit

prices are frequently lower when buying a larger container.

 Third degree price discrimination, which is the most relevant to the Pink Tax,

occurs when a firm charges different prices to different identifiable groups of consumers.

Such identifiable traits could be gender, location, or age. The idea, as stated earlier, is that

firms will want to engage in third degree price discrimination whenever the identifiable

groups have a different willingness to pay and a different demand elasticity for the good

(Listen-Heyes & Neokleous, 2000). Examples of third-degree price discrimination run

rampant. Transportation companies offer discounts to both senior citizens and to students.

Airlines charge different prices for round trips that include a Saturday night stay

(presumably indicative of leisure travel) and trips that are started and completed within

 10
the same work week (presumably indicative of business travel that is paid for by

employers). Many professional sports franchises charge lower ticket prices to veterans.

Each of these examples are readily observable in the marketplace.

 The Pink Tax, however, is a much more nefarious examples of third-degree price

discrimination. Gender socialization leads society to value gender differences, whether

real or not. Therefore, although Proctor and Gamble or Johnson & Johnson doesn’t

charge one price to women and one price to men for an identical product, the result of

gender socialization is that companies like this can sell nearly identical products, but

marketed to women and men differently, and ultimately be able to charge different prices

to different segments of society. Thus, third degree price discrimination can be used to

describe clothing, toys, health care products, and other markets where products marketed

to women or girls or baby girls cost more than nearly identical products marketed to men

or boys or baby boys. Although much more difficult to identify, this type of gender-based

pricing is a form of third-degree price discrimination and is called gender-based price

discrimination.

 Gender-based price discrimination is difficult to identify, and firms and

politicians frequently argue against its existence. A firm can easily claim that apparently

“nearly identical” products are, in fact, not nearly identical in the manufacturing process.

For example, a textile firm that sells nearly identical t-shirts at different prices can claim

a difference in pattern or cut or style contributes to an additional cost incurred by the firm

which then justifies charging higher prices for female products. Similarly, a health care

products company can argue that the addition of a perfume to a women’s deodorant

justifies a higher price, or even a toy manufacturer can argue that the difference in color

 11
of a children’s bicycle took more time or money to produce. Moreover, these arguments

might even withstand the scrutiny of a court of law when firms are required to “open their

books” to investigators, because firms still control the conversation about what drives

particular costs.

 Ultimately, though, one of the strongest indicators of the Pink Tax is that, even if

there are some legitimate costs that drive up the price of some products marketed toward

women, there is no reason to expect the costs to always be higher for women. But this is

what careful scrutiny of the market shows. Gender-based price discrimination unjustly

exists when almost all markets that target different products for women and men charge

higher prices for the women products. This could not legitimately be the case if higher

prices were always indicative of higher production costs alone.

 As unfair and unjust gender-based price discrimination is, directly taxing women

for their gender is even more abrasive to women as it is a visible attack on being a

woman. This happens when governments intentionally tax products that are uniquely

utilized by women for biological purposes: feminine hygiene products. This is known as

the tampon tax, and it is taken up in the next section.

IV. The Tampon Tax

 Within the realm of the Pink Tax exists the Tampon Tax. The “Tampon tax” is a

popular term used to describe tampons and other feminine hygiene products that are

subject to VAT (value-added tax) or sales tax, unlike the status of tax exemption given to

other items considered necessities. Tax exemption supporters argue that tampons,

sanitary napkins, menstrual cups and similar items are essential items that are

 12
unavoidable for women and should therefore be tax exempt. Advocates argue that

women’s hygiene products necessary to the hygiene of menstrual cycle should be

categorized along with other essential, tax-exempt needs, such as food and personal

medical products. There are no necessary product needing a tax exemption for men,

including condoms, that could be comparable to female hygiene products because

menstruation is biological and “feminine hygiene is not a choice.” Given that biological

females are the vast majority of buyers of feminine hygiene products, the increased cost

paid by women because such products are not tax exempt is criticized as discriminatory

against women.

 In 2004, the government of Kenya led the way by taking the position that

feminine hygiene products are a necessity, and they eliminated the Tampon Tax. More

than a decade passed before any other country followed suit. In 2015, after an online

petition signed by thousands made its way to parliament, Canada also exempted these

products from taxation. And in 2018, India abolished its 12 percent tax on feminine

hygiene products. In the case of India, change came about following to years of activism

from advocacy groups and celebrities. Superstar actor Akshlay Kumar starred in Pad Man

as the leading male actor and raised awareness for the Niine Movement.2 In Colombia,

the Constitutional Court unanimously ruled in November 2018 that its 5 percent tax on

tampons and pads, on grounds of gender equality, would be abolished. After 18 years of

campaigning, Australia abolished its 10 percent tax on feminine hygiene products

 2
 The Niine Movement was introduced as an audacious five-year campaign to engage and educate
people of all sexes and ages to address the stigma associated with menstruation and to ensure that every girl
and woman achieves their full potential through hygienic management of their time.

 13
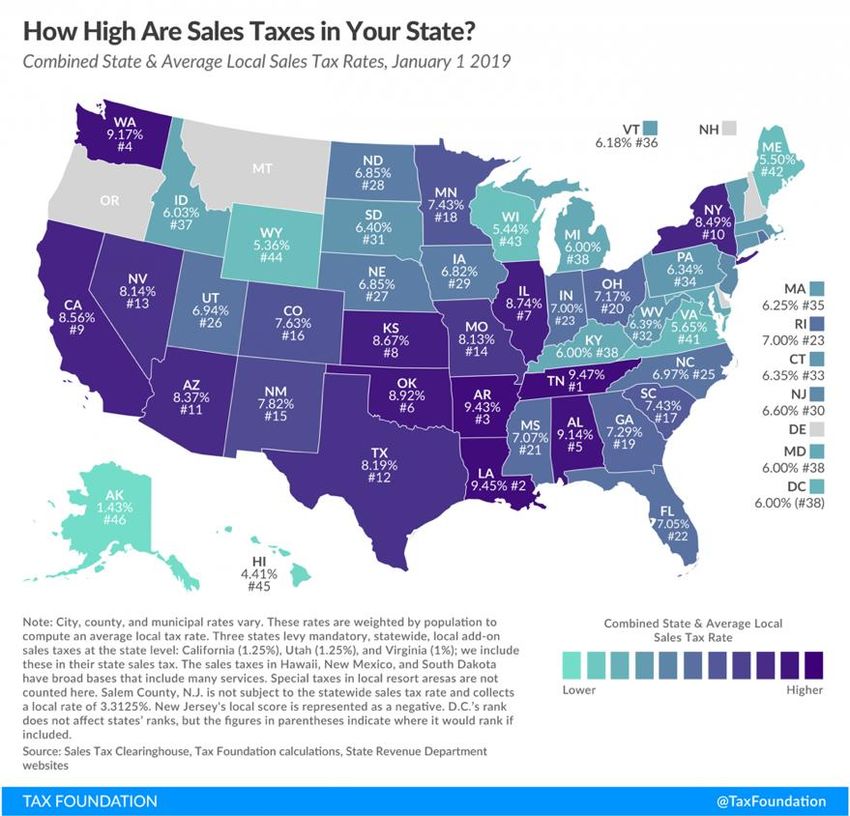
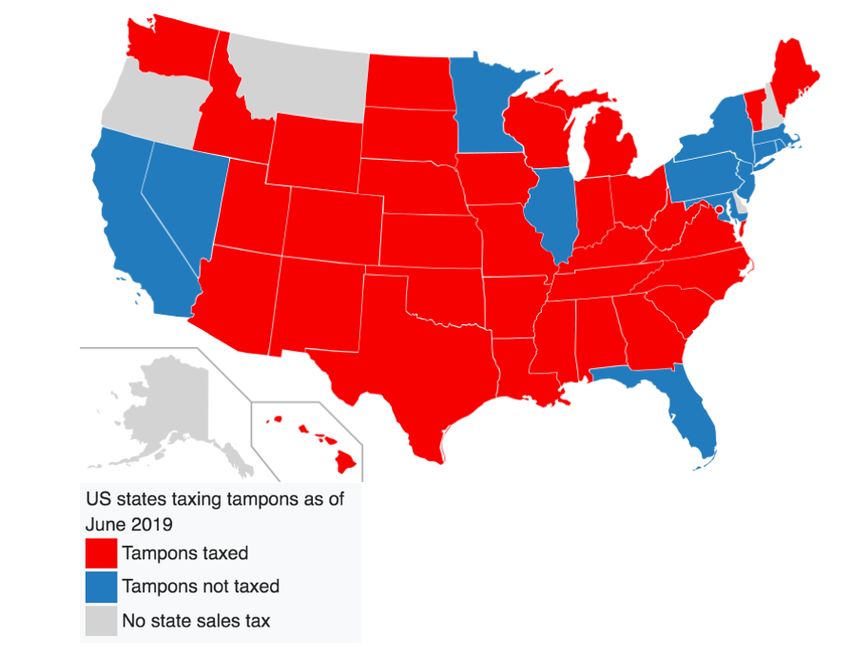
effective January 1, 2019, after all Australian states and territories agreed to expressly

exclude sanitary products from their goods and services tax. Prior to January 1, 2020,

sanitary items in Germany were classified as “luxury good,” and therefore were subject to

a 19 percent tax. As of January 1 of this year, however, Germany reclassified sanitary

items as “normal goods,” and now such items are subject to a 7 percent tax.

 Most countries collect either a value-added tax (VAT), goods and services tax

(GST), or a sales tax. The United States is somewhat unique in that that federal

government does not impose any of these three taxes, however, many states do as do

many local governments such as counties, municipalities, and cities. Nearly all states in

the United States apply a state-wide sales tax to the purchase of “tangible individual

property” with the exclusion of necessary items such as food, medications, prosthetics,

supplies to agriculture, and sometimes clothing. The exemptions vary among the states.

However, as shown in Figure 2, not all states have adopted a state-wide sales tax. As

shown in Figure 2, state-wide sales taxes range from 0 percent in Alaska, Delaware,

Montana New Hampshire, and Oregon to almost 9.5 percent in Tennessee. The lowest

state sales tax in a state that has such a tax is 5.36 percent in Wyoming. It is estimated

that the burden of sales tax on an average Americans is about 2 percent of their personal

income (Bellafiore, 2020). State sales taxes generate almost one-third of state revenue on

average, making state sales taxes the most lucrative revenue source for state budgets after

personal income taxes for most states (Bellafiore, 2020). Reliance on sales tax ranges

widely from state to state. Sales taxes in the south and west are much more significant

than in other parts of the country such as New England and the Midwest. For example,

only 20 percent of state revenues came from the sales tax in New York, while the sales

 14
tax accounted for more than 50 percent of state revenues in Arizona, California, Ohio,

and Texas.

 Just as states differ in their overall use of sales taxes (Figure 2), states also differ

in the extent to which they tax on feminine hygiene products such as pads and tampons

for women. Figure 3 shows that there is a wide disparity in the taxation of feminine

hygiene products. Certainly, states that don’t have a sales tax do not tax such products,

but even some states with a general sales tax have taken steps to exempt feminine

hygiene products in order to respect gender equality. As of December 2019, in addition to

the five states without a sales tax (Alaska, Delaware, Montana New Hampshire, and

Oregon ), thirteen states with a sales tax had exempted taxation of feminine hygiene

products, including California, Connecticut, Florida, Illinois, Maryland, Massachusetts,

Minnesota, Nevada, New Jersey, New York, Ohio3, Pennsylvania, Rhode Island, Utah. In

contrast to these states that respect gender equality on this front, 32 states do not. Women

in these states, therefore, spend even more on feminine hygiene products. In 2016, when

California was still taxing feminine hygiene products, women in California paid $20

million in taxes on tampons and sanitary products (Garcia, 2016). Armed with this

statistic, California Assemblywoman Cristina Garcia pushed forward an agenda for

gender equality. A back-of-the-envelope calculation is that women spend, on average, $7

per month on feminine hygiene products. Multiplied by 40, which is the average time a

woman has her period in a lifetime, amounts to spending a total of $3,360 during one’s

lifetime on such products. These numbers were reported by the California

 3
 Utah and Ohio are not pictured in blue in Figure 3 because legislation passed after the making of
this map.

 15
Assemblywoman Cristina Garcia when proposing a bill to fight against this inequality.

Unfortunately, it did not pass but it set an unprecedented conversation in the government.

This initial push led to the development of the bill H. R. 972.

 The Tampon Tax has become a big conversation in the government as of 2017

when Congress took up H. R. 972, commonly known as the Menstrual Equity for All Act

of 2017. Unfortunately, it did not pass. The bill proposed a tax exclusion, tax credit, and

requirements that applied to the purchase or distribution of menstrual hygiene products.

The bill amended the Internal Revenue Code in two important ways. First, it would allow

menstrual hygiene product purchases to be eligible for reimbursement from flexible

spending accounts. A flexible spending account, also known as a flexible spending

arrangement or FSA, is a special account to which an individual contributes non-taxable

money, and from which pays for certain out-of-pocket health care costs. For example,

people who set up FSAs can pay for office visit and prescription co-pays, medical

equipment, and even eyeglasses and contact lenses with pre-tax dollars. By design, FSA

accounts save the individual an amount equal to the income taxes that would have been

paid on the saved money. For example, if one’s federal marginal income tax rate is 24

percent, then by paying for a $50 co-payment out of an FSA, the true cost of the co-

payment is 76 percent of $50, or $38. Many employers have set up FSA programs that

allow their employees to contribute to an FSA if they choose to. Second, H. R. 972

provided a $120 refundable tax credit for women who use menstrual hygiene product.

 H. R. 972 also targeted several policy levers outside the purview of the IRS. For

one, it required the McKinney-Vento Homeless Assistance Act to require written

guidelines from the Emergency Food and Shelter Program National Board to ensure that

 16
funds would be used to provide women in emergency situations with menstrual hygiene

products. Second, H. R. 972 would have required any state receiving a grant under the

Edward Byrne Memorial Justice Assistance Grant Program to report annually to the

Department of Justice (DOJ) that all female prisoners and detainees in the state had

access to menstrual hygiene products on demand and at no cost to the detainees. If

no certification was provided to the DOJ, then grant funding would be reduced by 20

percent and reallocated to states that submitted their certifications. Third, H. R. 972 also

would have amended the Occupational Safety and Health Act 1970 in order to require the

Labor Department to rule that private employers, with no fewer than 100 workers,

provide their employees with free menstrual hygiene products.

 H.R. 972 was introduced in the House but was never taken up for a vote. Despite

this, the simple fact that H.R. 972 was introduced to the House was used by many states

as a steppingstone in establishing state anti-Tampon Tax laws or bills. Since 2019,

several states have introduced bills to repeal the tax. In particular, Figure 4 shows the

extent to which the conversation around menstrual equity for all has been established.

Even though only 13 states have officially repealed the Tampon Tax, many others have

added legislation in their budget and brought financial aid to those forced to use feminine

hygiene products, especially bringing aid to schools, prisons and women’s shelters. Upon

hearing about the Pink Tax, it is a common misconception that the Tampon Tax uniquely

constitutes the Pink Tax. The Tampon Tax is part of the Pink Tax but there are many

more aspects to it.

 17
V. Specific Examples of the Pink Tax

 The Pink Tax is an outgrowth of gender socialization. Gender-based price

discrimination affects everyone differently since it exists in numerous industries,

including personal care products, clothing, toys, accessories, insurance, hairdressing, and

dry cleaning. According to the New York City Department of Consumer Affairs 2015

study, From Cradle to Cane: The Cost of Being a Female Consumer, products marketed

to women or girls cost 7 percent more, on average, than comparable products marketed to

men and boys. When writing its study, the New York City Department of Consumers

Affairs (hereafter referred to as DCA) analyzed more than 90 brands encompassing

nearly 800 individual products. The products chosen by the DCA were selected based on

how close they were in branding, ingredients, appearance, textile, construction, and/or

marketing to minimize differences stemming from gendered marketing and design (DCA,

2015).

 Since the argument that gender socialization manifests itself throughout society in

terms of the Pink Tax is central to my thesis, it is important to be crystal clear about this

manifestation, and in particular to be convincing as to its existence. In order to do that, it

is important to carefully present several examples. For brevity, I will demonstrate the

pink tax in three different markets – clothing, children’s toys, and health care products.

Clothing

 The DCA (2015) listed types of clothes that are essentials in the closet of an

average consumer: a combination of casual clothes, professional clothes, and essential

items, such as socks and underwear. Seven types of clothing garments were examined:

 18
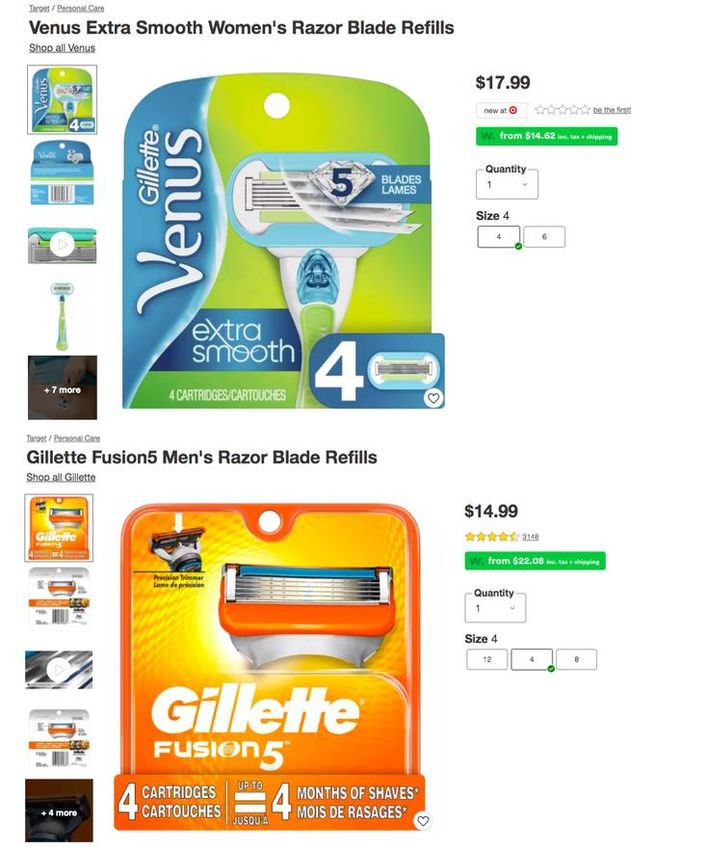
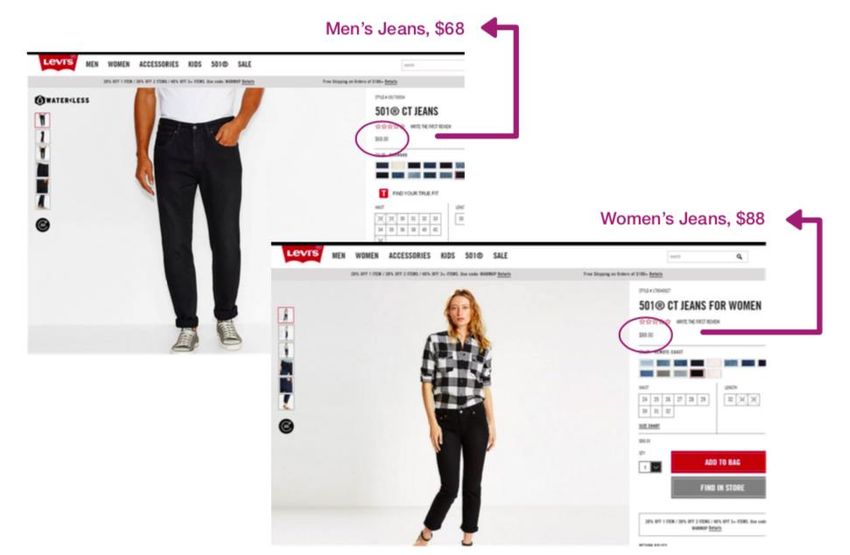
dress pants, dress shirts, jeans casual shirts, sweaters, socks, and underwear. Individual

clothing articles were only chosen if there were two clear versions of the same item, one

destined for males and the other for females, by the same retailers. The DCA (2015) took

efforts to identify nearly identical apparel items in order to eliminate variations in design

and fabric used that could affect quality and price.

 The DCA (2015) calculated an average price for each category of clothing item

by taking the average of the high and low prices of the items. Overall, they found that

women’s clothing was 8 percent more expensive compared to men’s clothing, except for

underwear for which men tended to spend 29 percent more than women. The largest price

difference, on average, was in shirts where women paid nearly 15 percent more than a

comparable men’s shirt. The clothing item with the least gender differential was dress

shirts, costing women an average of 13 percent more compared to a comparable men’s

dress shirt.

 One could argue that women's and men's clothing differ in production costs due to

the distinctness of build, cut, and design. Because women's clothing tends to be made

with a more expensive blend of fabrics and because many men’s shirts only have one

fabric, this difference in textiles could be the major driver of price differences.

Additionally, how an item is cut— men tend to have straight-cut clothes unlike women's

fitted cuts — may result in more fabric waste which would be more costly. However,

despite these potential explanations, it is hard to image such arguments can account for

such an astounding difference in pricing in items that are nearly identical. For example, in

Figure 5, the jeans showcased are cut similarly, produced by the same manufacturer,

marketed identically and yet have a price difference of $20.

 19
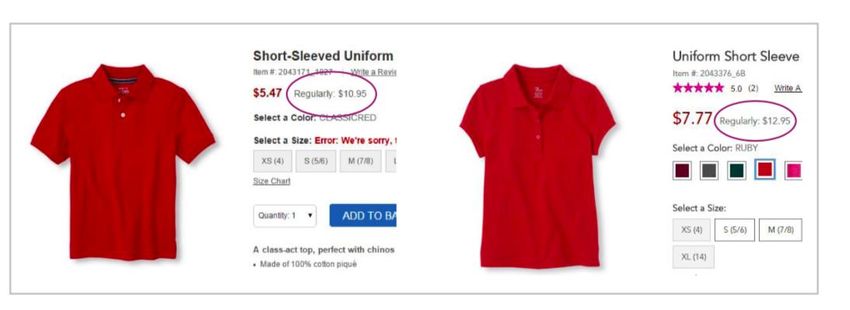
The DCA (2015) chose children's clothing products in a similar fashion to adult

clothing items. Through their research, they looked at baby pants, shirts, shoes, sweaters,

onesies, children’s jeans, shirts, underwear, and toddler shoes. According to the DCA, on

average, girls’ clothing items cost 4 percent more than boys clothing items. In seven of

the nine product categories (everything but children underwear and toddler shoes), items

meant for girls cost more. The greatest price difference in the children’s clothing group

was girl shirts which cost an average of 13 percent more than boys’ shirts. However,

other products such as onesies, baby shirts, and baby shoes were priced less than 5

percent higher. Figure 6 produces an advertisement for a children’s polo shirt from

Children’s Place being priced differently (by gender and color) despite the items being

otherwise identical. In this case, two nearly identical products but marketed separately to

boys and girls cost girls $2.30 more (or 42 percent more) than boys.

 Additional to the DCA research, from personal experience and searches, I have

discovered gender-based price discrimination in multiple products. Most shocking to-date

is a BabyGap sweater. The sweater is shown in Figure 7. The items in question are a

“Disney Minnie Mouse Gap Logo Hoodie Sweatshirt” marketed for girls and a “Disney

Mickey Mouse Gap Logo Hoodie Sweatshirt” marketed for boys. Despite having the

same amount of graphics, the same copyright,4 belonging to and being sold by the same

firm, and being sold at the same time, Baby Gap prices the sweater marketed to girls for

 4
 It is commonly known that Disney protects the licensing of its characters based on their
popularity. Following this argument, either Mickey Mouse and Minnie Mouse have the same licensing
price or Mickey’s is more expensive. Therefore, the price difference in these two products cannot be placed
on the copyright differences. Put simply, as Mickey Mouse is the iconic Disney character, if either product
should have been priced higher, it should have been the Mickey Mouse Gap sweatshirt.

 20
$5 more than the sweater marketed to boys. Even if through previous research, it has

been shown how implicit gender socialization starts at a very early age by wearing certain

types of clothing (Pomerleau, Bolduc, Malcuit, & Cossette, 1990). Colors and clothing

types can be traditionally classified as masculine or feminine, which means their clothing

is seen as definition of their genders (Barnes & Eicher, 1992). Once a year, on October

31, children and adults dress up the way that they want for Halloween. Halloween

costumes are a way for people, including children, to express what they want and who

they identify as. In The Pink Dragon is Female, Nelson (2000) explores 469 Halloween

costumes for children in order to study the degree to which children's costume wear

reproduces and reiterates more traditional gender representations. Out of all the types of

costumes surveyed, 8 percent were gender-neutral, 42 percent were masculine, and 50

percent were feminine. Feminine costumes were grouped in a small selection that

principally depicted queens, princesses and other representations of conventional

femininity, while masculine costumes portrayed villains and heroes, symbols of power,

strength, and death. Nelson’s (2000) study of Halloween costumes concluded that

Halloween costumes propagate gender socialization through the marketing of these

products. Starting most clearly with costumes intended for children, gender-distinctive

marketing techniques are used by the makers of costumes and sewing designs to

encourage gender dichotomization. The marketing behind the production and selling of

these costumes demonstrates “gender display” through the pictures of the models wearing

the costumes, the accessories, and the colors of the garment.

 21
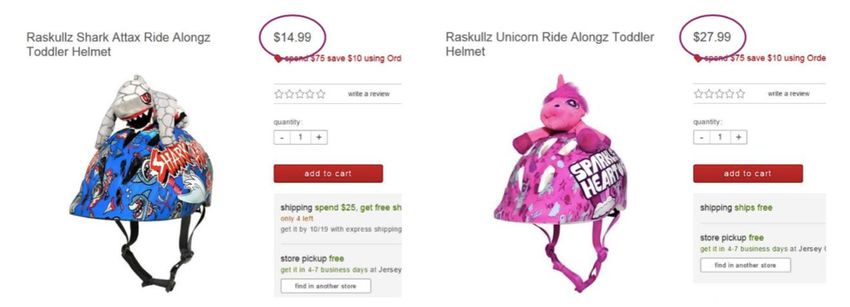
Toys

 Gender-based price discrimination also affects the pricing of children’s toys

(Klass, 2018). The DCA report from 2015 also investigated the pricing of children’s toys.

In particular that study considered 106 different toys grouped into six broadly defined

product categories of bikes and scooters, general toys, backpacks, preschool toys, helmets

and pads, and arts and crafts. DCA (2015) reported that, on average, toys and accessories

marketed to girls cost 7 percent more than a comparable product marketed to boys. Of the

53 different pairs of toys considered, products were priced equally regardless of sex only

20 times (38 percent). The product intended for girls was priced higher in 28 times (55

percent). And the product intended for boys was priced higher just 5 times (8 percent).

The most gender-equal product category meaning that it was associated with the lowest

cost difference was backpacks, with the average price difference between backpacks

marketed towards girls or boys was just 0.8 percent or $0.20. In contrast, the product

category with the greatest price differential was helmets and pads with products intended

for girls costing 13 percent ($2.90) more, on average, than identical products intended for

boys. As an example, to see how egregious the pricing differences can be in this category,

Figure 8 shows the pricing of two bicycle helmets. In particular, at the same Target, at the

same time, a “blue” Raskullz Shark Attax Ride Alongz Toddler Helmet retails for $14.99

while a “pink” Raskullz Unicorn Ride Alongz Toddler Helmet retails for $27.99. It is

difficult to see how the manufacturer could justify a difference of $13 on the grounds of

production costs (almost 87 percent more than the price of the boy’s product). Moreover,

this is not just an artifact of selecting the most abusive retailing. Figure 9 displays the

price of four different bicycle helmets sold on Amazon in April of 2020. In this case, the

 22
dinosaur and Mohawk helmet both retail for under $20, while a unicorn helmet is on sale

for $23.09 and a Kitty Cat helmet retails for $24.99

 The next category with the highest price discrepancy was for general toys. It can

be assumed that since products marketed to girls are not inherently the same as those

marketed to boys, the general toys category combined products that were the closest in

brand and function intended. To relate it to gender socialization, as previously mentioned,

children by searching for gender cues (Martin & Ruble, 2004) associate colors and items

to a specific gender early on. As previously mentioned, parents are crucial agents in the

process of gender socialization. The home environment serves as a basis for children to

develop gender-stereotypical attitudes and expectations. Parents view boys and girls

differently across cultures by promoting stereotypical behaviors, assigning different roles

in the household, and putting forward different attitudes. Parents also unconsciously

purchase toys that promote gender socialization. Rheingold and Cook (1975) examined

children's bedrooms which revealed that girls have more dolls and domestic toys, while

boys have more cars, educational materials, sports equipment, computers, and military

toys.

 Through the process of gender socialization, society establishes guidelines for

children to associate certain toys with a gender. The toys marketed to girls are related to

dolls (which may portray unethical beauty standards, e.g., Barbie Dolls), fairies, cooking

kits, and other toys that facilitate play that lets girls pretend to be a mother and wife,

cooking, cleaning, keeping house, and raising children (Huston, 1985; Smith and Daglish,

1977). During their childhood, boys are pushed to act more “tough” and to prefer toys

that are red or blue which is what society considers a symbol of their masculinity. They

 23
are taught to love cars, dinosaurs, and fighting toys (i.e., pretend swords and guns), and

are told it is acceptable to pretend to be ninjas, astronauts, policemen, and firemen (Fagot,

1988). Play themes also vary according to gender; boys list cowboys and soldiers as their

favorite games, while girls list playing house and school play as their favorite activities

(Sutton-Smith, Rosenberg, and Morgan, 1963). Due to the depiction of what is

“appropriate” for a gender through marketing tactics, it is common that many toys and

play activities are associated with a specific gender. The same way Halloween costumes

were marketed differently to girls and boys, similar stereotyping occurs with toys. The

marketing itself, is also quite intentional. Peretti and Sydney (1985) found that bikes,

chemistry sets, and plastic swords, were much more likely to include images of boys in

television ads, store catalogs, and print ads. Similarly, advertisement for dolls and pretend

play for housekeeping and school were more likely to include images of girls.

 Surprisingly, toys are much more gendered now than 50 years ago. From the

1920s to the 1960s, toys marketed towards girls were heavily focused on nurturing and

domestic tasks (Figure 10), while toys marketed towards boys were heavily focused on

building and working (Figure 11). In the 1970s, however, with waves of feminism

facilitating women breaking stereotypes, marching for equality, taking control of their

reproductive rights, and entering male-dominated professions, toys became more and

more gender-neutral as well. Figure 12 shows two advertisements in the 1970 Sears &

Robuck catalog in which a girl is featured in an advertisement for toy tools, and a boy is

featured in an advertisement for kitchen toys.

 Then, in 1984, a surprising event happened in Congress that radically shifted the

way toys would be marketed to children to this day. Prior to 1984, the federal

 24
government, working through the Federal Communications Commission (FCC), limited

the amount of advertising that television stations could target toward children. In 1984,

the FCC removed these regulations which affectively allowed the marketplace to now

determine and provide television programming for children. In 1988, politicians created a

bill that would limit advertisements during children’s programming to a total of 12

minutes an hour on weekdays and 10.5 minutes an hour on weekends. The bill also

required broadcasters to provide an educational and informational purpose to children’s

programs in order to secure a broadcasting license renewal (Molotsky, 1988). In 1988,

this bill passed Congress, however, after strong pushes from pro-advertisement lobbies,

President Reagan formally pocket-vetoed all previous regulation aimed at limiting

children’s exposure to advertising on the grounds that “the Constitution simply does not

empower the Federal Government to oversee the programming decisions of broadcasters

in the manner provided by this bill'” (Reagan, 1988). Overall, the deregulation of

children's television broadcasting enabled toy manufacturers to create more

advertisements for their products, and to air them more often and during a wider variety

of programs (Molotsky, 1988). With deregulation of advertising to children, gender

became an incredibly significant differentiator between shows and the toys that were

advertised during their airtime. Broadcasters would highlight specific toys in

commercials and certain programs to entice children to purchase those toys. With those

changes, gender-neutral ads became scarce, and gendered toys became the new norm in

the marketing world. With the deregulation came also the lack of rules surrounding the

type of advertisement and the length of the advertisement. Very quickly, children were

exposed to 11 minutes of advertisements per hour on weekends and 14 minutes per hour

 25
on weekdays (Molotsky, 1988). Many reports from the House Committee on Energy and

Commerce predicted that at that rate, millions of children would have invested more time

in front of a television screen than at a school by the time the child heads to college.

Children would have been faced with over 200,000 unregulated television advertisement

over their entire childhood (Molotsky, 1988). After President Reagan left office and

President George H. W. Bush was elected, rules and regulations changed. In an attempt to

reregulate an industry that was once deregulated, Bush’s administration introduced the

Children Television Act. Even though this act resembled the 1988 act, it had become a

more pressing issue due to the extreme deregulation of advertisement. The Children's

Television Act mandated that all programs must be focused on the children's educational

and informational needs. The act also reduced the amount of time that broadcasters could

spend promoting advertisements during children's programs. FCC regulations restricted

the amount of ads to 10.5 minutes per hour on weekends and 12 minutes per hour on

weekdays (FCC, 2019). These appalling numbers from reports of the House Committee

on Energy and Commerce pushed politicians from both sides to pass the act in Congress.

It was then signed by President Bush. Unfortunately, to this day, the re-regulation of the

television advertisement world didn’t stop the propagation of gendered-marketed toys.

Television’s increasing popularity in the 1990s, due in part to expanded access to cable

television, programs continued to advertise toys according to gender norms, dolls for girls

and cars for boys (Klass, 2018).

 Presently, advertising to minors remains largely unregulated, and now with the

introduction of the internet and social media, manufacturers have a broader access to

children. Prior to the 2000’s, advertisements were predominantly in newspapers, on

 26
You can also read