Scientific Opinion on Dietary Reference Values for vitamin C1
←
→
Page content transcription
If your browser does not render page correctly, please read the page content below
EFSA Journal 2013;11(11):3418

                                            SCIENTIFIC OPINION

            Scientific Opinion on Dietary Reference Values for vitamin C1
                EFSA Panel on Dietetic Products, Nutrition and Allergies (NDA)2, 3

                             European Food Safety Authority (EFSA), Parma, Italy

ABSTRACT
Following a request from the European Commission, the Panel on Dietetic Products, Nutrition and Allergies
(NDA) derived Dietary Reference Values (DRVs) for vitamin C. The Panel concludes that an Average
Requirement (AR) can be derived from indicators of vitamin C status, as well as a Population Reference Intake
(PRI) assuming a coefficient of variation (CV) of 10 %. Several health outcomes possibly associated with
vitamin C intake were also considered but data were found to be insufficient to establish DRVs. For healthy
adults, the AR is determined from the quantity of vitamin C that balances metabolic vitamin C losses and allows
the maintenance of an adequate body pool characterised by fasting plasma ascorbate concentrations at around
50 µmol/L. In men, an AR of 90 mg/day of vitamin C and a PRI of 110 mg/day are proposed. As no value for
metabolic losses is available in women, the AR for women is extrapolated from the AR for men on the basis of
differences in reference body weight, and an AR of 80 mg/day and a PRI of 95 mg/day are proposed. For infants
aged 7-11 months, the Panel has decided to retain the PRI of 20 mg/day set by the SCF (1993), as no suitable
evidence has emerged since the previous assessment. For children and adolescents, the ARs for vitamin C are
extrapolated from the ARs for adults taking into account differences in reference body weight, and PRIs are
derived, ranging from 20 mg/day for 1 to 3 year-old children, to 100 and 90 mg/day for boys and girls aged
15-17 years, respectively. For pregnant and lactating women, vitamin C intakes of 10 mg/day and of 60 mg/day
in addition to the PRI of non-pregnant non-lactating women are proposed.

© European Food Safety Authority, 2013

KEY WORDS
vitamin C, metabolic losses, plasma ascorbate, average requirement, Dietary Reference Value, health outcomes

1
    On request from the European Commission, Question No EFSA-Q-2011-01229, adopted on 10 October 2013.
2
    Panel members: Carlo Agostoni, Roberto Berni Canani, Susan Fairweather-Tait, Marina Heinonen, Hannu Korhonen,
    Sébastien La Vieille, Rosangela Marchelli, Ambroise Martin, Androniki Naska, Monika Neuhäuser-Berthold, Grażyna
    Nowicka, Yolanda Sanz, Alfonso Siani, Anders Sjödin, Martin Stern, Sean (J.J.) Strain, Inge Tetens, Daniel Tomé,
    Dominique Turck and Hans Verhagen. Correspondence: nda@efsa.europa.eu
3
    Acknowledgement: The Panel wishes to thank the members of the Working Group on Dietary Reference Values for
    vitamins: Monika Neuhäuser-Berthold, Grażyna Nowicka, Kristina Pentieva, Hildegard Przyrembel, Sean (J.J.) Strain,
    Inge Tetens, Daniel Tomé and Dominique Turck for the preparatory work on this scientific opinion and EFSA staff: Anja
    Brönstrup for the support provided to this scientific opinion.
Suggested citation: EFSA NDA Panel (EFSA Panel on Dietetic Products, Nutrition and Allergies), 2013. Scientific Opinion
on Dietary Reference Values for vitamin C. EFSA Journal 2013;11(11):3418, 68 pp. doi:10.2903/j.efsa.2013.3418
Available online: www.efsa.europa.eu/efsajournal

© European Food Safety Authority, 2013
Dietary Reference Values for vitamin C SUMMARY Following a request from the European Commission, the EFSA Panel on Dietetic Products, Nutrition and Allergies (NDA) was asked to deliver a scientific opinion on Dietary Reference Values (DRVs) for the European population, including vitamin C. Vitamin C (L-ascorbic acid) is an enzyme cofactor for biochemical reactions catalysed by monooxygenases, dioxygenases and mixed function oxygenases. Vitamin C plays an important role in the biosynthesis of collagen, is essential for the synthesis of carnitine and catecholamines, and is also involved in the metabolism of cholesterol to bile acids. Vitamin C in aqueous solution readily scavenges reactive oxygen and nitrogen species, and is part of the antioxidant network of the body. Gastrointestinal absorption is about 80 % for an intake of about 100 mg/day. Vitamin C is transported as the free anion ascorbate in plasma, and is distributed to all tissues. Biomarkers of body stores are related to the size and turnover of vitamin C body stores, and to the mass balance of vitamin C in the body. In this Opinion, plasma ascorbate concentration is considered as the primary indicator of body stores. The mass balance of vitamin C in the body is determined from the rate of turnover of the body pool, considering metabolic losses, urinary losses and the quantity of vitamin C required for the replacement of these losses, taking into account absorption efficiency. Scurvy, characterised by symptoms related to connective tissue defects, occurs in adults at a plasma ascorbate concentration below 10 µmol/L and a body pool less than 300 mg, and can be prevented with an intake of 10 mg vitamin C/day. In vitamin C-depleted men, when vitamin C intake is increased to 60 to 100 mg/day, plasma ascorbate concentrations steeply increase up to a value of about 50 µmol/L, and the body pool rises to 1.0-1.5 g. When vitamin C intake is increased to above 100 mg/day, there is a progressive flattening of the curve until plasma ascorbate reaches a plateau at about 70-80 µmol/L that can be maintained only by chronic ingestion of large doses of vitamin C above 200 mg/day. Plasma ascorbate concentrations above 10 µmol/L but below 50 µmol/L are indicative of a suboptimal status with a risk of insufficiency. A plasma ascorbate concentration of 50 µmol/L is indicative of an adequate status. Urinary excretion of ascorbate is low when plasma ascorbate concentrations are low, but urinary excretion increases sharply for plasma concentrations above about 50 µmol/L, and this is assumed to reflect near-saturation of body pools. The Average Requirement (AR) for vitamin C in healthy adults was determined from the quantity of vitamin C intake that balances metabolic vitamin C losses and maintains fasting plasma ascorbate concentrations at about 50 µmol/L. Taking a conservative approach and based on the fact that a complete set of data was only available in men, the Panel selected metabolic losses of 50 mg/day, an absorption of 80 % and a urinary excretion of 25 % of the vitamin C intake. Thus, a mean vitamin C intake of 91 mg/day (rounded to 90 mg/day) was estimated to be required to balance daily losses, and this intake represents the AR. Assuming a coefficient of variation (CV) of 10 %, a Population Reference Intake (PRI) of 110 mg/day was derived for healthy men. As no value for metabolic losses was available in women, the AR for women was extrapolated from the AR for men. Extrapolation was done by isometric scaling (linear with body weight), since vitamin C is considered to be distributed throughout the whole body, since the multi-compartment models used to calculate the metabolic losses in men consider an exchange with only one whole body tissue pool, since few sex-related differences could be observed in the pharmacokinetics of vitamin C, and since a main part of the observed differences can be explained by body weight differences between sexes. This calculation led to an AR of 78 mg/day (rounded to 80 mg/day) for women. Assuming a CV of 10 % and rounding to the closest 5, a PRI of 95 mg/day of vitamin C was derived for healthy women. Because of a scarcity of data on the influence of ageing, the Panel concluded that there were insufficient data to derive different DRVs for vitamin C for older adults compared to younger adults. The Panel also considered several health outcomes that may be associated with vitamin C intake. The Panel decided that the available data on the effects of vitamin C intake and/or status on scurvy, blood lipids and blood pressure, common cold, and on chronic disease-related outcomes (cardiovascular EFSA Journal 2013;11(11):3418 2
Dietary Reference Values for vitamin C

disease-related, cancer, vision-related, mortality) could not be used as criteria to derive the
requirement for vitamin C.

For infants aged 7-11 months, the Panel decided to retain the PRI of 20 mg/day set by the Scientific
Committee for Food (SCF, 1993), as no suitable evidence has emerged since the previous assessment.
For children and adolescents, the AR for vitamin C was extrapolated from the ARs for adults taking
into account differences in body weight (isometric scaling). The PRIs were derived by assuming a CV
of 10 % and range from 20 mg/day for 1 to 3-year-old children, to 100 and 90 mg/day for boys and
girls aged 15-17 years, respectively.

In pregnancy, plasma ascorbate concentration decreases because of haemodilution and active transfer
to the fetus. For pregnant women, a vitamin C intake of 10 mg/day in addition to the PRI of non-
pregnant women was proposed. In lactating women, the amount of vitamin C secreted in breast milk
reflects maternal vitamin C intake rather than the infant’s requirement. For women exclusively
breastfeeding during the first six months post partum, a vitamin C intake of 60 mg/day, in addition to
the PRI of non-lactating women, was proposed to cover vitamin C losses in breast milk.

The main contributors to the vitamin C intake of adults are fruits and vegetables and their juices, and
potatoes. Data from dietary surveys show that average vitamin C intakes from food only in European
countries range from 69 to 130 mg/day in men and from 65 to 138 mg/day in women.

EFSA Journal 2013;11(11):3418                                                                         3
Dietary Reference Values for vitamin C

TABLE OF CONTENTS
Abstract .................................................................................................................................................... 1
Summary .................................................................................................................................................. 2
Table of contents ...................................................................................................................................... 4
Background as provided by the European Commission........................................................................... 6
Terms of reference as provided by the European Commission ................................................................ 6
Assessment ............................................................................................................................................... 8
1. Introduction ..................................................................................................................................... 8
2. Definition/category .......................................................................................................................... 8
  2.1.      Chemistry ................................................................................................................................ 8
  2.2.      Functions of vitamin C............................................................................................................ 8
     2.2.1. Vitamin C as cosubstrate of enzymatic reactions ............................................................... 8
     2.2.2. Vitamin C as a reducing and antioxidant agent .................................................................. 9
     2.2.3. Health consequences of vitamin C deficiency and excess .................................................. 9
        2.2.3.1. Deficiency .................................................................................................................. 9
        2.2.3.2. Excess ........................................................................................................................ 9
  2.3.      Physiology and metabolism of vitamin C ............................................................................. 10
     2.3.1. Intestinal absorption ......................................................................................................... 10
     2.3.2. Transport in blood and variability of plasma concentrations ........................................... 11
     2.3.3. Distribution to tissues and metabolism ............................................................................. 13
     2.3.4. Body stores and metabolic losses ..................................................................................... 13
     2.3.5. Elimination ....................................................................................................................... 15
        2.3.5.1. Faeces....................................................................................................................... 15
        2.3.5.2. Urine ........................................................................................................................ 15
        2.3.5.3. Breast milk ............................................................................................................... 16
  2.4.      Biomarkers ............................................................................................................................ 16
     2.4.1. Biomarkers of intake ........................................................................................................ 16
     2.4.2. Biomarkers of body stores ................................................................................................ 17
     2.4.3. Biomarkers of function ..................................................................................................... 17
        2.4.3.1. Markers of collagen metabolism .............................................................................. 17
        2.4.3.2. Markers of carnitine status ....................................................................................... 17
        2.4.3.3. Markers of oxidative damage................................................................................... 18
        2.4.3.4. Markers of the function of the immune system ....................................................... 18
  2.5.      Effects of genotype ............................................................................................................... 19
3. Dietary sources and intake data ..................................................................................................... 19
  3.1.      Dietary sources...................................................................................................................... 19
  3.2.      Dietary intake ........................................................................................................................ 19
4. Overview of Dietary Reference Values and recommendations ..................................................... 20
  4.1.      Adults .................................................................................................................................... 20
  4.2.      Infants and children............................................................................................................... 22
  4.3.      Pregnancy and lactation ........................................................................................................ 23
5. Criteria (endpoints) on which to base Dietary Reference Values .................................................. 25
  5.1.      Scurvy ................................................................................................................................... 25
  5.2.      Biomarkers of body stores .................................................................................................... 25
  5.3.      Markers of disease risk ......................................................................................................... 26
     5.3.1. Blood lipids ...................................................................................................................... 26
     5.3.2. Blood pressure .................................................................................................................. 26
  5.4.      Common cold ........................................................................................................................ 27
  5.5.      Chronic disease-related outcomes ......................................................................................... 27
     5.5.1. Cardiovascular disease-related outcomes ......................................................................... 28
     5.5.2. Cancer ............................................................................................................................... 29
     5.5.3. Vision-related outcomes ................................................................................................... 29
     5.5.4. Mortality ........................................................................................................................... 29
     5.5.5. Conclusions on chronic disease-related outcomes............................................................ 29

EFSA Journal 2013;11(11):3418                                                                                                                               4
Dietary Reference Values for vitamin C 5.6. Specific requirements during pregnancy and lactation ......................................................... 30 6. Data on which to base Dietary Reference Values.......................................................................... 30 6.1. Adults .................................................................................................................................... 30 6.2. Infants ................................................................................................................................... 31 6.3. Children and adolescents ...................................................................................................... 31 6.4. Pregnancy and lactation ........................................................................................................ 32 Conclusions ............................................................................................................................................ 32 Recommendations for research .............................................................................................................. 33 References .............................................................................................................................................. 33 Appendices ............................................................................................................................................. 48 Appendix 1. Foods contributing to vitamin C intake in Denmark, Spain and Germany .................... 48 Appendix 2A. Population, methods and period of dietary assessment in children and adolescents in European countries ................................................................................................................................. 50 Appendix 2B. Vitamin C intake among children aged ~0-3 years in European countries ................ 53 Appendix 2C. Vitamin C intake among children aged ~4-6 years in European countries ................ 54 Appendix 2D. Vitamin C intake among children aged ~7-9 years in European countries ................ 55 Appendix 2E. Vitamin C intake among children aged ~10-14 years in European countries ............ 56 Appendix 2F. Vitamin C intake among adolescents aged ~15-18 years in European countries ....... 57 Appendix 3A. Population, methods and period of dietary assessment in adults in European countries58 Appendix 3B. Vitamin C intake among adults aged ~19-65 years in European countries ................ 61 Appendix 3C. Vitamin C intake among adults aged ~19-34 years in European countries ................ 62 Appendix 3D. Vitamin C intake among adults aged ~35-64 years in European countries ................ 63 Appendix 3E. Vitamin C intake among adults aged ~65 years and over in European countries ...... 64 Appendix 4. Vitamin C concentration of human milk from healthy mothers not taking supplements 65 Abbreviations ......................................................................................................................................... 66 EFSA Journal 2013;11(11):3418 5
Dietary Reference Values for vitamin C

BACKGROUND AS PROVIDED BY THE EUROPEAN COMMISSION
The scientific advice on nutrient intakes is important as the basis of Community action in the field of
nutrition, for example such advice has in the past been used as the basis of nutrition labelling. The
Scientific Committee for Food (SCF) report on nutrient and energy intakes for the European
Community dates from 1993. There is a need to review and if necessary to update these earlier
recommendations to ensure that the Community action in the area of nutrition is underpinned by the
latest scientific advice.

In 1993, the SCF adopted an opinion on nutrient and energy intakes for the European Community4.
The report provided Reference Intakes for energy, certain macronutrients and micronutrients, but it did
not include certain substances of physiological importance, for example dietary fibre.

Since then, new scientific data have become available for some of the nutrients, and scientific advisory
bodies in many European Union Member States and in the United States have reported on
recommended dietary intakes. For a number of nutrients, these newly established (national)
recommendations differ from the reference intakes in the SCF (1993) report. Although there is
considerable consensus between these newly derived (national) recommendations, differing opinions
remain on some of the recommendations. Therefore, there is a need to review the existing EU
Reference Intakes in the light of new scientific evidence, and taking into account the more recently
reported national recommendations. There is also a need to include dietary components that were not
covered in the SCF opinion of 1993, such as dietary fibre, and to consider whether it might be
appropriate to establish reference intakes for other (essential) substances with a physiological effect.

In this context, EFSA is requested to consider the existing Population Reference Intakes for energy,
micro- and macronutrients and certain other dietary components, to review and complete the SCF
recommendations, in the light of new evidence, and in addition advise on a Population Reference
Intake for dietary fibre.

For communication of nutrition and healthy eating messages to the public it is generally more
appropriate to express recommendations for the intake of individual nutrients or substances in food-
based terms. In this context, EFSA is asked to provide assistance on the translation of nutrient based
recommendations for a healthy diet into food based recommendations intended for the population as a
whole.

TERMS OF REFERENCE AS PROVIDED BY THE EUROPEAN COMMISSION
In accordance with Article 29 (1)(a) and Article 31 of Regulation (EC) No. 178/2002, the Commission
requests EFSA to review the existing advice of the Scientific Committee for Food on population
reference intakes for energy, nutrients and other substances with a nutritional or physiological effect in
the context of a balanced diet which, when part of an overall healthy lifestyle, contribute to good
health through optimal nutrition.

In the first instance, EFSA is asked to provide advice on energy, macronutrients and dietary fibre.
Specifically, advice is requested on the following dietary components:

      •   Carbohydrates, including sugars;

      •   Fats, including saturated fatty acids, polyunsaturated fatty acids and monounsaturated fatty
          acids, trans fatty acids;

      •   Protein;

4
    Scientific Committee for Food, Nutrient and energy intakes for the European Community, Reports of the Scientific
    Committee for Food 31st series, Office for Official Publication of the European Communities, Luxembourg, 1993.

EFSA Journal 2013;11(11):3418                                                                                     6
Dietary Reference Values for vitamin C
• Dietary fibre.
Following on from the first part of the task, EFSA is asked to advise on population reference intakes
of micronutrients in the diet and, if considered appropriate, other essential substances with a
nutritional or physiological effect in the context of a balanced diet which, when part of an overall
healthy lifestyle, contribute to good health through optimal nutrition.
Finally, EFSA is asked to provide guidance on the translation of nutrient based dietary advice into
guidance, intended for the European population as a whole, on the contribution of different foods or
categories of foods to an overall diet that would help to maintain good health through optimal nutrition
(food-based dietary guidelines).
EFSA Journal 2013;11(11):3418 7Dietary Reference Values for vitamin C ASSESSMENT 1. Introduction Vitamin C (L-ascorbic acid) is a water-soluble organic compound that is needed for normal metabolic functioning of the body. Vitamin C is an essential component of the diet, as humans and other primates have lost the ability to synthesise vitamin C via the glucuronic acid pathway. In 1993, the Scientific Committee for Food (SCF) adopted an opinion on nutrient and energy intakes for the European Community and derived for vitamin C a Lowest Threshold Intake (LTI), an Average Requirement (AR) and a Population Reference Intake (PRI) for adults. The SCF also set PRIs for infants aged 6-11 months and for children. For pregnancy and lactation, additional intakes to be added to the PRI for non-pregnant non-lactating women were proposed. 2. Definition/category 2.1. Chemistry Vitamin C is a 6-carbon hydroxy-lactone that is structurally related to glucose and has a molecular mass of 176.12 Da. Vitamin C refers to both ascorbic acid and dehydroascorbic acid. Ascorbic acid is readily oxidised to L-dehydroascorbic acid, in which the 3,4-dihydroxy groups are replaced by 3,4- diketone functions, and L-dehydroascorbic acid can be reduced back to ascorbic acid. Vitamin C in solution can be oxidised and donate electrons to oxidants, including oxygen and metal ions, to give an equilibrium mixture of ascorbic and dehydroascorbic acids. 2.2. Functions of vitamin C Vitamin C has a number of biochemical and physiological functions in the body which are largely dependent on its ability to provide reducing equivalents in various biochemical reactions (Burri and Jacob, 1997; Tsao, 1997). 2.2.1. Vitamin C as cosubstrate of enzymatic reactions Vitamin C is an enzyme cofactor for biochemical reactions catalysed by monooxygenases, dioxygenases and mixed function oxygenases. Vitamin C acts as an electron donor with a redox potential that reduces the active centre metal ion of mono- and dioxygenases and maintains metal ions in a reduced state for optimal activity of the enzyme (Burri and Jacob, 1997; Tsao, 1997). Vitamin C plays an important role in the biosynthesis of collagen, which represents about one quarter of the total body protein and constitutes the principal protein of skin, bones, teeth, and connective tissues. Procollagen-proline dioxygenase (proline hydroxylase) and procollagen-lysine 5-dioxygenase (lysine hydroxylase), two enzymes involved in procollagen biosynthesis, require vitamin C for maximal activity (Phillips and Yeowell, 1997). Vitamin C deficiency impairs collagen synthesis. Vitamin C is essential for the synthesis of carnitine (Hulse et al., 1978), as cofactor of two dioxygenases involved in carnitine biosynthesis (Burri and Jacob, 1997; Vaz and Wanders, 2002). Vitamin C is also a cofactor for catecholamine biosynthesis, in particular the conversion of dopamine to noradrenaline catalysed by dopamine β-monooxygenase (Burri and Jacob, 1997). Vitamin C is involved in the metabolism of cholesterol to bile acids via the enzyme cholesterol 7α-monooxygenase, and in steroid metabolism in the adrenal glands (Burri and Jacob, 1997; Tsao, 1997). In vitamin C deficiency, the metabolism of cholesterol to bile acids is slowed down in guinea pigs, resulting in an accumulation of cholesterol in the liver, hypercholesterolaemia and formation of cholesterol gall stones (Ginter et al., 1982). EFSA Journal 2013;11(11):3418 8
Dietary Reference Values for vitamin C

Hydroxylation of aromatic drugs and carcinogens by hepatic cytochrome P450 is enhanced by
reducing agents such as vitamin C (Tsao, 1997).

The activities of several other enzymes are also known to be dependent on vitamin C, including the
mono- and dioxygenases involved in peptide amidations that are necessary for maximal activity of the
hormones oxytocin, vasopressin, cholecystokinin and α-melanocyte-stimulating hormone (Cameron
and Pauling, 1973), and the hydroxylation of phenylalanine in tyrosine formation (Burri and Jacob,
1997; Tsao, 1997).

2.2.2.   Vitamin C as a reducing and antioxidant agent
Besides its ability to provide reducing equivalents for a variety of biochemical reactions, vitamin C
functions physiologically as a water-soluble antioxidant acting as a free radical scavenger (Sadler et
al., 1999; IOM, 2000). Vitamin C readily scavenges reactive oxygen species and reactive nitrogen
species, as well as singlet oxygen and hypochlorite. The one- and two-electron oxidation products are
easily regenerated by glutathione and NADH or NADPH (IOM, 2000).

Vitamin C is part of the antioxidant defence system, which is a complex network including
endogenous and dietary antioxidants, antioxidant enzymes, and repair mechanisms, with mutual
interactions and synergetic effects among the various components. L-ascorbic acid is able to
regenerate urate, glutathione, and beta-carotene from their respective one-electron oxidation products
(Edge and Truscott, 1997; Phillips and Yeowell, 1997) and α-tocopherol (vitamin E) from the
α-tocopheroxyl radical produced via scavenging of lipid radicals (Bowry et al., 1995; Packer, 1997).

Vitamin C is considered to be involved in the maintenance of endothelial function possibly through its
antioxidant effects (IOM, 2000). The reducing capacity of vitamin C has also been implicated in
enhancing gastrointestinal absorption of dietary non-haem iron (Hallberg, 1981; Bendich and Cohen,
1990; Burri and Jacob, 1997).

2.2.3.   Health consequences of vitamin C deficiency and excess

2.2.3.1. Deficiency
A continuous lack of vitamin C in the diet causes the disease scurvy, which occurs in adults at a
plasma ascorbate concentration below 10 µmol/L and a body pool less than 300 mg (Baker EM et al.,
1971; Levine, 1986; Weber et al., 1996; Burri and Jacob, 1997). Scurvy is characterised by symptoms
related to connective tissue defects that result from a weakening of collagenous structures. In infants,
there may be important effects on bone tissue with impaired bone growth and ossification (Shenkin,
2008). In adults, scurvy is associated with tooth loss, joint pain, bone and connective tissue disorders,
and poor wound healing with multiple clinical features including petechiae, bruising, and inflamed and
bleeding gums. Depression, hypochondria, and mood changes are frequently associated with scurvy
and may be related to deficient dopamine hydroxylation. Scurvy can be prevented with a vitamin C
intake of 10 mg/day (Baker EM et al., 1971; Levine, 1986; Weber et al., 1996; Burri and Jacob, 1997).

Early or prescorbutic symptoms also include fatigue, lethargy, anaemia, aching joints, and muscle
weakness (Lukaski, 2004). It has been suggested that fatigue and lethargy may be related in part to
insufficient carnitine biosynthesis, and consequently deficient transport of activated long chain fatty
acids into the mitochondria for energy generation (Davies et al., 1987; Jacob and Pianalto, 1997) (see
Section 2.4.3.2.).

2.2.3.2. Excess
EFSA did not set any Tolerable Upper Intake Level (UL) for vitamin C. The limited available data
from studies in animals and humans were considered to suggest a low acute toxicity of vitamin C
(Johnston, 1999; EFSA, 2004). Relationships between vitamin C intakes and adverse gastrointestinal
effects or renal effects in relation to urinary excretion of oxalate were assessed, and reversible acute
gastrointestinal intolerance or diarrhoea was regarded as the most clearly defined adverse effect at

EFSA Journal 2013;11(11):3418                                                                           9
Dietary Reference Values for vitamin C

high intakes (3-4 g/day). However, data on a dose-response relationship for adults (including older
adults) or for children were considered to be insufficient (EFSA, 2004). Despite the extensive use of
high doses of vitamin C in supplements, there were only a limited number of controlled studies that
specifically investigated adverse effects.

It has been suggested that vitamin C may also exert pro-oxidant effects by reducing ferric to ferrous
ion, and that this might stimulate uptake of iron from the gut as iron is absorbed in the reduced state
(Wollenberg and Rummel, 1987). In addition, an increase in free iron concentration through
vitamin C’s ability to release ferrous ions from ferritin (Halliwell and Gutteridge, 1989) may promote
the generation of free radicals through the Fenton reaction (Prousek, 2007). Whether excess vitamin C
intake leads to these mechanisms in vivo is uncertain (Carr A and Frei B, 1999).

2.3.     Physiology and metabolism of vitamin C
The schematic relationship between vitamin C intake, vitamin C accumulation in the body and
vitamin C elimination is shown in Figure 1. The four parts of this figure will be described in the
following sub-sections.

Figure 1: Schematic view of vitamin C kinetics in the body with the relationship between vitamin C
intake, plasma concentration, body stores and urinary excretion in healthy male adults (adapted from
Kallner et al. (1979); Graumlich et al. (1997)).

2.3.1.   Intestinal absorption
Vitamin C is absorbed in the small intestine via a sodium-dependent active transport mechanism
(Tsao, 1997; Rumsey and Levine, 1998). The efficiency of intestinal absorption of vitamin C is 80-
90 % at dietary intakes of 30-180 mg/day (SCF, 1993). Because the transporter is saturable, absorption
efficiency gradually decreases at higher intakes (Kallner et al., 1979; Hornig and Moser, 1981;
Blanchard et al., 1997; EFSA, 2004).

EFSA Journal 2013;11(11):3418                                                                        10
Dietary Reference Values for vitamin C

Two depletion-repletion studies (Baker et al., 1969; Baker EM et al., 1971) using a radio-labelled
vitamin C dose were each undertaken in six healthy men of unknown age and smoking status. After
the depletion phase (0-2.5 mg/day vitamin C), total vitamin C intake of the completers was increased
to 4 to 66.5 mg/day (n = 4 completers) (Baker et al., 1969), or 6.5 to 130.5 mg/day (n = 5 completers)
(Baker et al., 1971). Ingested radioactivity was excreted in urine and faeces except for less than 2 % of
radioactivity which was expired as carbon dioxide. Faecal excreta accounted for not more than 2 % of
the radioactivity excreted, thus absorption was about 98 % of intake.

In another study (Kallner et al., 1977), seven healthy non-smoking men of unknown age followed a
diet low in vitamin C for nine days, were then orally supplemented with 90 mg (n = 5) or 180 mg
(n = 2) of vitamin C daily for two weeks before oral administration of 30 mg (n = 5) or 60 mg (n = 2)
of radio-labelled vitamin C. The vitamin C intake was then increased to four daily doses of 1 000 mg
and the cumulative excretion of radioactivity in the urine was measured over a period of ten days. The
average absorption was estimated to amount to 80-90 % of the labelled doses (30 mg or 60 mg).

Hornig et al. (1980) consecutively administered two daily doses of 1, 2, 3 and 4 g of vitamin C to a
non-smoking man of unknown age, followed by 5 g/day of vitamin C for ten days. The mean daily
urinary excretion of ascorbate was used to estimate the absorption of vitamin C, which decreased from
75 % (1 g) to about 44 % (2 g), 39 % (3 g), 28 % (4 g) and 21 % (5 g) of the ingested dose.

Using data collected over three years on healthy men (n = 50) and women (n = 25) (no age given)
receiving single oral doses of vitamin C (Kübler and Gehler, 1970), i.e. 1.5 g (n = 16), 3 g (n = 29),
6 g (n = 11), or 12 g (n = 19), and for which serum ascorbate and, for some subjects (n = 25), urinary
ascorbate concentrations were measured, vitamin C absorption was calculated using a pharmacokinetic
model (Kübler, 1970) based on the data measured in plasma and urine. Mean absorption decreased
from about 50 % for an intake of 1.5 g to about 16 % for a vitamin C intake of 12 g.

In a depletion-repletion study using a pharmacokinetic model, seven healthy men aged 20-26 years
with unknown smoking status followed a diet containing 60 mg vitamin C/day for three weeks,
followed by a diet with less than 5 mg/day for the entire study (Graumlich et al., 1997). The depletion
phase of unknown duration was followed by a repletion phase using oral doses of 15, 30, 50, 100, 200,
500, and 1 250 mg twice daily. Each dose was applied for several days with the aim of reaching a new
steady state. At that time, a one-day absorption test was performed, which involved oral administration
of half of the dose given so far followed by intravenous administration of the other half of the dose.
Using a multi-compartment model, the mean fractional absorption derived from oral versus
intravenous vitamin C administration was reported to be 86 % for 15 mg/day, 85 % for 30 mg/day,
84 % for 50 mg/day, 81 % for 100 mg/day, 78 % for 200 mg/day, 75 % for 500 mg/day, and 62 % for
1 250 mg/day.

The Panel notes that data on vitamin C absorption have mainly been collected in men, that absorption
is about 80 % for an intake of 100 mg/day and about 75 % for an intake of 1 g/day, and that the
efficiency of absorption decreases with increasing doses.

2.3.2.      Transport in blood and variability of plasma concentrations
In plasma, vitamin C is transported as the free anion ascorbate5, and no specific binding protein has
been identified.

When the daily vitamin C intake increases, plasma ascorbate concentration increases according to a
sigmoidal profile (Sauberlich, 1975; Irwin and Hutchins, 1976; Kallner et al., 1979; Basu and Schorah,
1982; Polidori et al., 2004; Levine et al., 2011). In depleted subjects with low plasma ascorbate, when
vitamin C intake is increased, plasma ascorbate concentration is characterised by a steep rise up to a
value of about 50 µmol/L which is reached for a vitamin C intake between 60 and 100 mg/day (Basu

5
    In this Opinion, plasma ascorbate concentration is expressed in µmol/L. Published values expressed in another unit
    (e.g. mg/100 mL) have thus been converted to µmol/L.

EFSA Journal 2013;11(11):3418                                                                                      11
Dietary Reference Values for vitamin C and Schorah, 1982; Levine et al., 1996; Levine et al., 2001). When vitamin C intake is increased above 100 mg/day, there is a progressive flattening of the curve until it reaches a plateau at about 70-80 µmol/L. These high plasma concentrations can only be maintained by chronic ingestion of doses of vitamin C above 200 mg/day (Figure 1). According to depletion-repletion studies undertaken in 15 healthy non-smoking women aged 19- 27 years (Levine et al., 2001) and in seven healthy non-smoking men aged 20-26 years (Levine et al., 1996) receiving in the repletion phase increasing doses of vitamin C (30, 60, 100, 200, 400, 1 000, 2 500 mg/day, half of the dose ingested twice daily), women reach the plateau of plasma ascorbate concentration at a lower vitamin C intake than men, but the value of the plasma concentration at the plateau is similar in women and men (Levine et al., 2011). Depletion and repletion profiles of vitamin C were determined in four groups of healthy non-smoking non-institutionalised men (aged 21- 28 (n = 15) or 66-74 years (n = 15)) and women (aged 20-29 (n = 14) or 65-72 years (n = 14)) (Blanchard, 1991b). Plasma ascorbate concentrations were determined upon entry into the study, once each week during a five-week period of dietary restriction of vitamin C (< 10 mg/day) and twice each week during a 2.5 to 3-week period of supplementation with 500 mg/day. Mean baseline, depleted and repleted plasma ascorbate concentrations did not differ between young and elderly subjects. Depleted plasma ascorbate concentrations did not differ between males and females, whereas mean repleted plasma ascorbate concentrations were significantly higher in women (about 95 and 102 µmol/L in young and elderly women, respectively) than in men (about 80 and 83 µmol/L in young and elderly men, respectively). An observational study in 28 pregnant adolescents (n = 28) and 74 pregnant women showed that mean plasma ascorbate concentrations significantly decreased in the course of pregnancy, from about 80 µmol/L at < 14 weeks of gestation (58 samples) to about 70 µmol/L at 39-42 weeks of gestation (six samples) (Morse et al., 1975). This decrease may be related to haemodilution and active transfer to the fetus, as suggested from an in vitro study (Choi and Rose, 1989). A decrease in plasma ascorbate concentration was also observed in a Scottish population of pregnant women (n = 1 007), from about 64 µmol/L (median: 12 weeks of pregnancy) to 37 µmol/L at delivery (Scaife et al., 2006). In smokers, plasma/serum ascorbate concentration is usually lower compared to non-smokers. An observational study showed that the risk of having a plasma ascorbate concentration below 11 µmol/L was significantly higher in male or female smokers compared to non-smokers (Hampl et al., 2004). Plasma ascorbate concentrations increased in subjects who quit smoking compared to smokers of at least 15 cigarettes/day for one year (Lykkesfeldt et al., 1996). A lower plasma/serum ascorbate concentration is observed in smokers even after adjustment for differences in vitamin C intakes. An observational study showed that plasma ascorbate concentrations in tobacco chewers (n = 11) and cigarette smokers (n = 23) were significantly lower than in non-smokers (n = 10), while vitamin C intake was not statistically different between groups (Giraud et al., 1995). Data collected from 459 men aged 20-60 years, including 146 non-smokers, 125 former smokers, and 188 current smokers (< 20 cigarettes/day, n = 104; ≥ 20 cigarettes/day, n = 84) showed that vitamin C intake was lower in smokers of ≥ 20 cigarettes/day compared to the other groups, and that plasma ascorbate concentration was significantly different between groups (even after adjustment for confounders including vitamin intake), being higher in non-smokers, lower in smokers of ≥ 20 cigarettes/day, but not significantly different between ex-smokers and smokers of < 20 cigarettes/day (Marangon et al., 1998). The Panel notes that when daily vitamin C intake increases, plasma ascorbate concentration increases according to a sigmoidal profile in healthy adult men. This is characterised by a steep rise of plasma ascorbate up to a concentration of about 50 µmol/L reached for an intake between 60 and 100 mg/day, and by a progressive flattening of the curve until it reaches a plateau at about 70-80 µmol/L for higher vitamin C intakes. The Panel also notes that women reach the plateau of plasma ascorbate concentration at a lower vitamin C intake than men, but that the value of the plasma concentration at the plateau is similar in women and men, that plasma ascorbate concentration decreases during pregnancy, and that it is lower in smokers compared to non-smokers. EFSA Journal 2013;11(11):3418 12
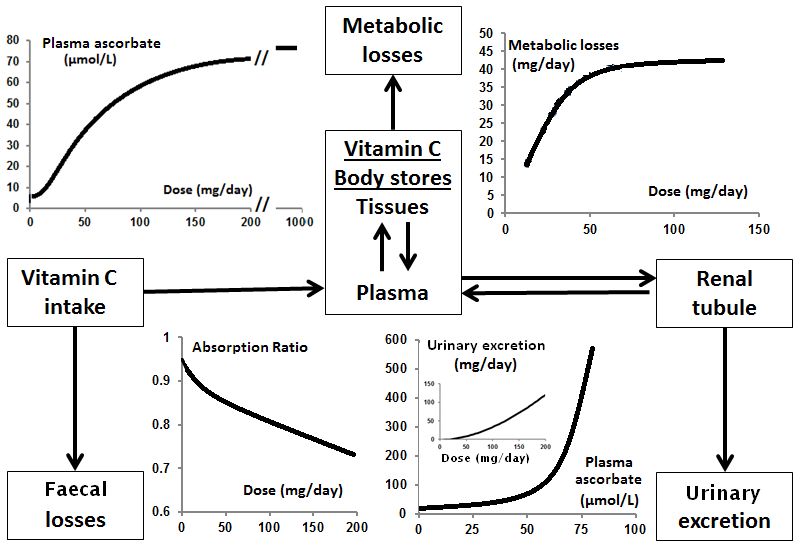
Dietary Reference Values for vitamin C

2.3.3.   Distribution to tissues and metabolism
Vitamin C is distributed to all tissues. Vitamin C is efficiently transported into the cell in its reduced
(ascorbate) and oxidised (dehydroascorbate) forms by active and facilitative transport systems,
respectively (Tsao, 1997; Jacob, 1999; Linster and Van Schaftingen, 2007). The cellular transport of
ascorbate is mediated by two active sodium-dependent cotransporters, SVCT1 and SVCT2, which
show distinct tissue distribution and vary by cell type. Dehydroascorbate is transported by glucose
transporters, particularly GLUT1, GLUT3 and GLUT4, and the transport is therefore not directly
energetically driven, but dehydroascorbate is readily converted in the cell to ascorbate and this
reductive step drives its intracellular uptake.

Per 100 g of wet tissue, higher concentrations are found in the pituitary glands (40-50 mg), the adrenal
glands (30-40 mg), the eye lens (25-31 mg) and the brain (13-15 mg) than in the plasma (0.4-1.0 mg),
saliva (0.07-0.09 mg), kidney (5-15 mg) and skeletal muscle tissue (up to 4 mg) (Hornig, 1975; Carr et
al., 2013).

In an intervention study (Carr et al., 2013), 36 non-smoking men were randomly assigned to receive
for six weeks either 0.5 or 2 kiwifruit/day. A significant correlation between the ascorbate
concentration in skeletal muscle (vastus lateralis) measured by biopsies and fasting plasma ascorbate
concentration was observed. In addition, mean muscle ascorbate concentration was significantly
higher in the second plasma ascorbate quintile (21-36 µmol/L) compared to the first one (4-
20 µmol/L), and in the fourth quintile (48-58 µmol/L) compared to the third one (37-47 µmol/L), but
not significantly different between the second and third quintiles, nor between the fourth and the fifth
(59-82 µmol/L) quintiles. The Panel notes that there was no additional increase in muscle ascorbate
concentration in non-smoking men at a plasma ascorbate concentration above around 50 µmol/L.

Accumulation of vitamin C into neutrophils and lymphocytes is mediated by both low affinity and
high affinity transport processes. At steady state, the relationship between vitamin C intake and
ascorbate concentration in circulating cells (neutrophils, monocytes, platelets, lymphocytes) parallels
that between vitamin C intake and ascorbate concentration in plasma in adult men and women (Basu
and Schorah, 1982; Levine et al., 1996; Levine et al., 2001). Curves of intracellular ascorbate
concentrations as a function of vitamin C doses in healthy non-smoking men (Levine et al., 1996) and
women (Levine et al., 2001) showed that plateaus were reached at doses of about 100-400 mg/day in
neutrophils (about 1.3 mmol/L), monocytes (about 3 mmol/L), platelets (about 3.5 mmol/L in women)
and lymphocytes (about 3.5-4 mmol/L).

In mammals, the degradation of ascorbate proceeds via dehydroascorbate which is an unstable
molecule, and involves spontaneous and possibly enzyme-catalysed reactions (Linster and Van
Schaftingen, 2007). In the body, vitamin C is readily oxidised to dehydroascorbate, which can be
reduced back to ascorbate or irreversibly hydrolysed to diketogulonic acid and then metabolised to
oxalate, threonic acid, xylose, xylonic acid and lyxonic acid (Basu and Dickerson, 1996). In human
subjects injected with labelled ascorbate, an average of 44 % of the total radioactivity excreted in urine
was recovered as oxalate, other urinary metabolites including 2,3-diketo-l-gulonate and
dehydroascorbate (Hellman and Burns, 1958), and little, if any, radioactivity was recovered as carbon
dioxide. Oxidation to carbon dioxide occurs at high doses of intake, partly because of the catabolism
of unabsorbed vitamin C by the intestinal microflora (Kallner et al., 1985). Ascorbate may also
undergo limited conjugation with sulphate to form ascorbate-sulphate, which is excreted in the urine
(Baker EM, 3rd et al., 1971).

2.3.4.   Body stores and metabolic losses
Depending on intake, the total body pool of vitamin C in adult men varies from less than 0.3 g to
around 1.5-2.0 g as derived from pharmacokinetic models (Kallner et al., 1979; Sauberlich, 1990). As
for plasma and circulating cells, there is a non-linear relationship between daily vitamin C intake and
body stores of vitamin C. A usual intake of vitamin C below 10 mg/day is associated at steady state
with a body pool of less than 300 mg and scurvy (see Section 2.2.3.1.). When usual vitamin C intake is

EFSA Journal 2013;11(11):3418                                                                          13
Dietary Reference Values for vitamin C

increased from 10 mg/day to 60-100 mg/day, the body pool rises at steady state to 1.0-1.5 g (Baker
EM et al., 1971; Kallner, 1987). An increase in vitamin C intake to above 200 mg/day induces a
progressive increase in body stores that plateau at values of about 1.5-2.0 g (Kallner et al., 1979 ;
Kallner, 1987). Measurement of the vitamin C body pool is complex, since the body has a wide range
of inter-connected ascorbate pools, each with complex kinetic properties (Fairweather-Tait, 2011;
EURRECA, online).

In the two depletion-repletion studies by Baker et al. using 14C-labelled ascorbic acid in men (see
Section 2.3.1.), the depletion phase lasted for days 1-99 (Baker et al., 1969), or between day 14 and
day 97 to 110 according to subject after a control phase of 13 days (Baker et al., 1971), and was
followed by the repletion phase and, in one of the studies (Baker et al., 1971), by a phase of ad libitum
diet plus supplementation of either 350 or 600 mg vitamin C/day. Individual daily metabolic losses
were calculated from the slope of the urinary excretion curve of radioactivity during the depletion
period following a period of adaptation to controlled levels of vitamin C intakes. Daily metabolic
losses varied from 2.6 to 4.1 % (average: 3.2 ± 1.0 %, n = 5 completers) (Baker EM et al., 1971) and
from 2.2 to 2.7 % ((Baker et al., 1969) reported in Baker EM et al. (1971), n = 4 completers). Pooling
the individual data from these nine subjects, the average daily metabolic losses were 2.9 ± 0.6 %. The
Panel notes that this would correspond to metabolic losses of 43.5 ± 9 mg/day for a saturated body
pool of 1.5 g.

Metabolic losses were also investigated in 15 healthy non-smoking men (20-45 years) who received,
during a period of three weeks, a diet devoid of vitamin C and capsules of vitamin C (1 x 30 mg/day
for n = 4, 2 x 30 mg/day for n = 4, 2 x 45 mg/day for n = 3, 4 x 45 mg/day for n = 4), in order to
achieve a steady state condition before oral administration of a single dose of 14C-labelled ascorbic
acid (Kallner et al., 1979). A high vitamin C dosage period was then followed for one week in order to
wash-out the radioactivity. The time course of radioactivity was measured in plasma and urine, and
pharmacokinetic parameters were calculated. Mean plasma steady state concentrations reported for
14 subjects were about 14-66 µmol/L. Total turnover of vitamin C reflected the absorbed amount of
vitamin C, and corresponded to the sum of renal losses of unmetabolised ascorbic acid and metabolic
losses. The curve of metabolic losses as a function of total turnover of vitamin C showed saturation of
metabolic losses at about 40 to 50 mg/day, for a total vitamin C turnover above 60 mg/day. The curve
of plasma ascorbate concentration as a function of total vitamin C turnover showed that a total
vitamin C turnover of about 60 mg/day corresponded to a plasma concentration of about 45-
50 µmol/L.

In a depletion-repletion study in seven young men with unknown smoking status using a
pharmacokinetic model (see Section 2.3.1.), maximum metabolic losses of 42 mg/day were calculated
using parameters from the multi-compartment model (Graumlich et al., 1997).

In smokers, higher metabolic losses are observed as a result of increased oxidative stress (IOM, 2000).
Kallner et al. (1981) compared data from 17 healthy men (aged 21-69 years) who had been chronic
smokers for many years and smoked more than 20 cigarettes per day to data previously collected in
non-smoking men (Kallner et al., 1979). Smokers followed the same protocol as the non-smokers,
including the oral administration of capsules of vitamin C (1 x 30 mg/day for n = 4, 2 x 30 mg/day for
n = 5, 2 x 45 mg/day for n = 3, 4 x 45 mg/day for n = 5). No attempts were made to estimate the
smoking intensity from analyses of body fluids, but standardisation of smoking was attempted by
requesting at least one cigarette before the daily blood sampling and continued smoking during the
administration of the labelled ascorbate. Mean plasma steady state concentrations were about
14-89 µmol/L in smokers. The curves of the steady state plasma concentration of unlabelled ascorbate
as a function of total turnover showed that higher total turnovers are required in smokers to achieve
plasma concentrations comparable to those in non-smokers. Metabolic losses varied from 50.2 to
114.0 mg/day in smokers, except for one subject at 29.6 mg/day, whereas it varied from 13.7 to
47.6 mg/day in non-smokers. The curve of metabolic losses as a function of plasma steady state
concentration in smokers and non-smokers showed that smokers had higher metabolic losses than non-

EFSA Journal 2013;11(11):3418                                                                          14
Dietary Reference Values for vitamin C

smokers at a corresponding plasma ascorbate concentration. Similarly, the curve of metabolic losses as
a function of total turnover of vitamin C was above that obtained in non-smokers.

The Panel notes that in healthy non-smoking men aged 20-45 years, maximum metabolic losses of
vitamin C were estimated to be about 40-50 mg/day, which corresponds to a plasma ascorbate
concentration of about 45-50 µmol/L. The Panel also notes that no data on metabolic losses are
available for women, and that smokers have higher metabolic losses compared to non-smokers at
similar vitamin C intakes.

2.3.5.   Elimination

2.3.5.1. Faeces
Unabsorbed vitamin C can be found in the faeces (see Section 2.3.1.), but there is no indication that
faeces constitute an important route of excretion for absorbed vitamin C.

2.3.5.2. Urine
Unchanged ascorbate and its metabolites are mainly excreted in the urine. There is an increasing renal
elimination of ascorbate with an increase in plasma ascorbate concentration and/or vitamin C intake.
This results in an inverse relationship between the elimination half-life and the dosage because of
saturation of renal tubular reabsorption (Baker EM et al., 1971; Kallner et al., 1979; Blanchard et al.,
1997; Graumlich et al., 1997; Fukuwatari and Shibata, 2008; Uchida et al., 2011; Carr et al., 2012).

In 19 healthy adults (Friedman et al., 1940), the curve of the relationship between urinary ascorbate
and plasma ascorbate concentration showed that urinary ascorbate excretion increases for a plasma
ascorbate concentration above about 45-55 µmol/L.

In 15 healthy non-smoking men (Kallner et al., 1979) (see Section 2.3.4.), the curve of renal turnover
as a function of steady state plasma ascorbate showed that the renal absorptive capacity was exceeded
at plasma concentrations above about 45-50 µmol/L, with a progressive steep increase in renal
excretion. Although the exact amount of ingested dietary ascorbic acid was unknown, analysis of
urines for labelled ascorbic acid showed that even at low doses appreciable amounts of unmetabolised
ascorbic acid (about 10 % of total urinary radioactivity as radio-labelled ascorbic acid) were excreted
and this was increased to 60-80 % for higher doses. When smoking men (Kallner et al., 1981) were
compared to non-smoking men (Kallner et al., 1979) (see Section 2.3.4.), the curves of renal turnover
as a function of steady state plasma ascorbate concentration in smokers and non-smokers were similar.

In a depletion-repletion study in seven young men (Graumlich et al., 1997) (see Section 2.3.1.), the
curve of urinary ascorbate excretion as a function of plasma ascorbate concentration showed a
progressive increase above a plasma ascorbate concentration of about 50-60 µmol/L, up to about
600 mg ascorbate excretion for the highest single oral dose of 1 250 mg (i.e. at a plasma ascorbate
concentration of about 80 µmol/L). There was no measurable ascorbate in urine after oral vitamin C
doses of 15 or 30 mg. However, all subjects excreted ascorbate in the urine for oral doses of 100 mg or
above.

In a study conducted in 60 non-smoking men aged 18–30 years consuming sequentially half, one, two
and three Gold kiwifruit per day for four to six weeks each, correlation of plasma ascorbate with
urinary ascorbate also showed a marked increase in urinary output at plasma ascorbate concentrations
above 50-60 μmol/L (Carr et al., 2012).

According to a depletion-repletion study (Levine et al., 1996) (see Section 2.3.2.) undertaken in seven
healthy non-smoking men, less than 0.4 mg/day of ascorbate appeared in urine of all volunteers after
single oral vitamin C doses of 15 and 30 mg, six of seven subjects had less than 0.4 mg/day of
ascorbate in urine after a single dose of 50 mg, but a single oral dose of 100 mg induced a urinary
ascorbate excretion of about 25 mg. The curve of urinary excretion as a function of dose showed a

EFSA Journal 2013;11(11):3418                                                                         15
Dietary Reference Values for vitamin C

progressive increase up to about 600 mg ascorbate excretion for the highest single oral dose of
1 250 mg.

A depletion-repletion study in 15 healthy non-smoking women (Levine et al., 2001) (see Section
2.3.2.) showed that the relationship between vitamin C intake and urinary excretion followed the same
profile as in men.

The Panel notes that urine is the main route of elimination of ascorbate in adults, and that at an intake
of 100 mg/day approximately 25 % of the ingested dose of vitamin C is excreted in urine. The Panel
also notes that ascorbate is excreted in urine for low plasma ascorbate concentrations, and that urinary
ascorbate excretion increases sharply for plasma ascorbate concentrations above 45-60 µmol/L.

2.3.5.3. Breast milk
Lactating women secrete vitamin C via breast milk. Vitamin C concentration in human milk reflects
maternal vitamin C intake more than the infant’s requirement (WHO/FAO, 2004).

Appendix 4 reports data from seven studies in Europe and the US on the mean vitamin C
concentration of human milk from healthy lactating mothers not taking vitamin C supplements. Mean
vitamin C concentration in human milk ranged from 35 to 90 mg/L. Mean maternal vitamin C intake
reported in six studies ranged from < 80 mg/day to about 150 mg/day; mean plasma concentrations,
reported in five studies, ranged from 30 to 84 µmol/L. Smoking status was reported in three studies.

Vitamin C intakes and serum ascorbate concentration were investigated in smoking (n = 16, three of
them receiving vitamin C supplements) and non-smoking (n = 41, unsupplemented) women during
their third trimester of pregnancy, and vitamin C concentration in their milk was also investigated.
While total daily vitamin C intake and serum ascorbate concentration were not statistically different
between the two groups, women smoking during lactation showed significantly lower vitamin C
concentrations in both transition and mature milk as compared to non-smoking women (Ortega et al.,
1998a).

The Panel notes that mean vitamin C concentration of human milk from healthy mothers not taking
vitamin C supplements is in the range of 35-90 mg/L.

2.4.     Biomarkers

2.4.1.   Biomarkers of intake
Vitamin C intake can be calculated from food consumption and the vitamin C content of foodstuffs
available from food composition tables (Deharveng et al., 1999). Plasma ascorbate concentration is not
a reliable indicator of vitamin C intake since the relationship between vitamin C intake and plasma
concentration is sigmoidal, i.e. it is approximately linear for low vitamin C intakes but progressively
reaches a plateau for plasma values above 50 µmol/L (see Section 2.3.2.).

A systematic review and meta-analysis (Dehghan et al., 2007) investigated the relationship between
dietary vitamin C intakes, measured by Food Frequency Questionnaire (FFQ), dietary recalls
(DR)/diary or weight record method (WR), and plasma ascorbate concentrations, from cross-sectional
or validation studies published between 1960 or 1988 (according to the database considered) and
2006. Studies were excluded from the review if the dietary intake was not measured quantitatively or
if the correlation between dietary intake and plasma concentration was not reported. A total of
26 studies undertaken on 26 631 non-pregnant, non-lactating adults aged 18-65 years including
smokers (18 740 subjects with DR/diary methods, 6 774 with FFQ and 1 117 with WR) were
considered, some of which investigated several dietary assessment methods. Mean vitamin C intakes
ranged between 37 and 327.5 mg/day. Overall, there was a positive linear correlation between plasma
ascorbate concentration and vitamin C intake either measured by FFQ (crude r = 0.35 for both sexes,
0.39 for females, and 0.46 for males, 18 studies), or by DR/diary (crude r = 0.46 for both sexes, 0.44

EFSA Journal 2013;11(11):3418                                                                          16
You can also read