Keeping Girls in the Game: Factors that Influence Sport Participation - ERIC
←
→
Page content transcription
If your browser does not render page correctly, please read the page content below
Keeping Girls in
the Game:
Factors that Influence
Sport Participation

                         A Women’s Sports Foundation Research Report, March 2020
Our Mission

We are the
ally, advocate
and catalyst
for tomorrow’s
leaders. We exist
to enable girls and
women to reach
their potential in
sports and life.
Letter from the CEO

Founded by Billie Jean King in 1974, the Women’s Sports Foundation is committed to ensuring that
all girls and women have equal access to sports and physical activity and the tremendous life-long
benefits they provide. While much progress has been made, there remain glaring disparities in sport
participation across gender, race/ethnicity, geography, and socioeconomic status, leaving far too
many girls on the sidelines. We know we can and must do better.

Keeping Girls in the Game: Factors that Influence Sports Participation, generously supported by
Dick’s Sporting Goods, provides new insight on how and why girls enter sports, why some girls
drop out and why others persist. The report is a window into girls’ lives, painting a picture of how
they experience sport, including their attitudes, motivations concerns and interests. The study also
includes a survey of parents to explore their perceptions around issues related to access, benefits,
and impediments to their children’s involvement in sports. As primary influencers and gatekeepers of
their children’s participation, these findings can lead to strategies that meet the needs of girls and
their families more holistically.

We are continuously building a deeper understanding of how to help girls thrive in sport. With these
new insights, the research can help parents, coaches, program leaders, and those working at the
sport league levels to not only recruit and retain girls in sport, but also find effective ways to address
disparities and forge new pathways for greater engagement.

The research also makes clear that all girls benefit from multiple champions for sport in their daily
lives. Parents in particular can play a powerful role in supporting their daughters’ love of sport,
while also helping to break down the barriers they face. At the community level, we should continue
celebrating and supporting the champion organizations that are increasing access and opportunity
and ensuring that girls not only try sport, but also find joy, confidence, strength, and the sense of
belonging that keeps them playing during their growing years and throughout their lifetimes.

The Women’s Sports Foundation is proud to be at the forefront of research and practice, and we look
forward to working with other leaders in the field to bring these new research findings into practice.

Dr. Deborah Antoine, CEO, Women’s Sports Foundation

Women’s Sports Foundation                                                   Keeping Girls in the Game: Factors that
WomensSportsFoundation.org                       1                          Influence Sport Participation
Acknowledgments

Women’s Sports Foundation Acknowledgments                         We are grateful to Nicole Melton, Ph.D., Associate
                                                                  Professor, Sport Management, University of
First, the Women’s Sports Foundation is indebted to the           Massachusetts, the primary author of the
study authors, Nicole Zarrett, Ph.D.; Phillip Veliz, Ph.D.;       recommendations, for her thoughtful and thorough
and Don Sabo, Ph.D. We are fortunate to be able to call           development of a set of action steps that can lead to
upon scholars who possess the intellect and skills to ably        increases in participation and retention of girls in sport.
carry out the vision for this report.
                                                                  The Women’s Sports Foundation thanks its National
We are enormously grateful to the panel of scholars,              Partners Chevrolet, espnW and ESPN, Gatorade, and
health policy experts, youth sport leaders, and sport             NBC Sports Group for their year-round support and
administrators who reviewed the findings, made                    commitment to help strengthen and expand opportunities
important contributions to the text, and challenged us to         for all girls and all women through all sports.
make the report findings clear and meaningful.

Matt Breslin, Executive Director, Winners Lacrosse
                                                                  Authors’ Acknowledgments
Huayra Gomez-Garcia, Events Senior Manager, Disabled
                                                                  We are grateful to the Women’s Sports Foundation and
Sports USA
                                                                  its CEO, Dr. Deborah Antoine, for making this report
Risa Isard, Associate Director, Thought Leadership,               a reality. Deep thanks to Karen Issokson-Silver, MPH,
KaBOOM                                                            WSF Vice‑President for Research and Evaluation, and
                                                                  Dr. Marjorie Snyder, WSF Senior Director of Research
Deborah Slaner Larkin, Former CEO, Women’s Sports                 & Programs, whose vision and project management
Foundation, and former member President’s Council on              skills illuminated every step of this project. Thanks also
Physical Fitness and Sports                                       to Deana Monahan for her editorial and graphic skills.
Nicole Lavoi, Director, The Tucker Center for Research on         Finally, many thanks to all the girls, boys, and parents who
Girls & Women in Sport, University of Minnesota                   participated in the research, sharing their perceptions
                                                                  and beliefs about youth sports participation so that
Jennifer Brown Lerner, Deputy Director, Aspen Institute           we could tell a compelling story about how youth, and
Sports & Society Program                                          especially girls enter, stay in or dropout of sports.
Jamison Merrill, Director, Monitoring & Evaluation, Up2Us         Many thanks to YouGov, who conducted the youth and
Megan Morgan, Executive Director, Girls in the Game               parent surveys and analyzed the results, the findings
                                                                  from which are integrated into this report. YouGov is a
Wayne B. Moss, Executive Director, National Council of            leading international full-service research and consulting
Youth Sports (NCYS)                                               company and a pioneer in the use of technology to collect
                                                                  higher-quality, in-depth data for the world’s leading
Theresa Roden, Founder & Executive Director, i-tri
                                                                  businesses and institutions so that they can better serve
Vivian Santora, President & CEO, PowerPlay NYC                    the people that sustain them. With offices throughout the
                                                                  U.S., the U.K., Europe, the Middle East, and Asia, YouGov
Jamie Schmill, Director of Research & Impact, Laureus
                                                                  leverages its online sampling, research expertise, and
Sport for Good USA
                                                                  consulting experience to provide clients with sophisticated
Penn Sheppard, Director of Learning, Girls Inc.                   market strategy, market analytics, and survey and
                                                                  forecasting services. www.yougov.com.
Chris Voelz, Executive Director, Collegiate Women Sports
Awards; Founder and CEO, Athletics Plus Consulting                This report was made possible through a partnership
                                                                  between the Women’s Sports Foundation® and The DICK’S
Aimee Watters, Executive Director, Dick’s Sporting
                                                                  Sporting Goods Foundation®.
Goods Foundation

                Women’s Sports Foundation                                              Keeping Girls in the Game: Factors that
                WomensSportsFoundation.org                    2                        Influence Sport Participation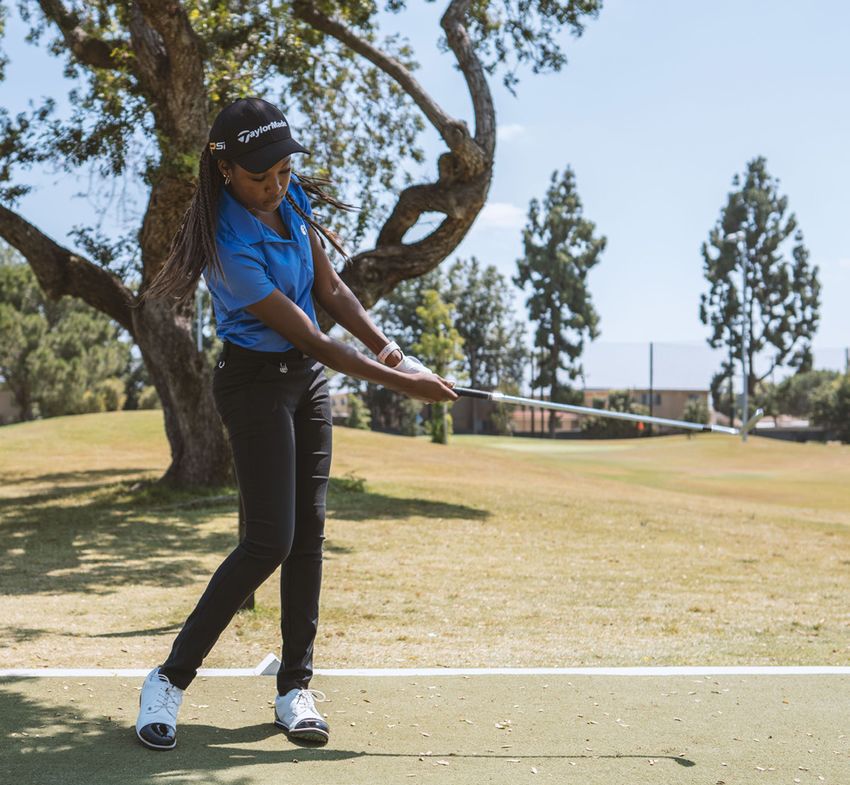
About The DICK’S Sporting Goods Foundation                            About the Women’s Sports Foundation
DICK’S Sporting Goods and The DICK’S Sporting Goods                   The Women’s Sports Foundation exists to enable girls
Foundation believe that participation in sports makes                 and women to reach their potential in sports and life.
people better. Since 2014, DICK’S and The DICK’S                      We are an ally, an advocate, and a catalyst. Founded
Foundation have pledged more than $100 million                        by Billie Jean King in 1974, we strengthen and expand
to support youth sports teams and leagues in need.                    participation and leadership opportunities through
Through our Sports Matter initiative we strive to increase            research, advocacy, community programming, and
awareness for underfunded youth athletics nationwide                  a wide variety of collaborative partnerships. The
and provide much-needed support through equipment,                    Women’s Sports Foundation has positively shaped the
uniform and monetary donations. For more information on               lives of millions of youth, high school and collegiate
Sports Matter, visit SportsMatter.org.                                student-athletes, elite athletes, and coaches. We’re
                                                                      building a future where every girl and woman can
                                                                      #KeepPlaying and unlock the lifelong benefits of sport
                                                                      participation. All girls. All women. All sports. To learn
                                                                      more about the Women’s Sports Foundation, please visit
                                                                      www.WomensSportsFoundation.org

This report may be downloaded from WomensSportsFoundation.org. This report may be reproduced and distributed only
in its entirety. Any material taken from this report and published or transmitted in any form, electronic or mechanical, must
be properly attributed to Keeping Girls in the Game: Factors that Influence Sport Participation, published by the Women’s
Sports Foundation.

Preferred Citation: Zarrett, N., Veliz, P.T., & Sabo, D. (2020). Keeping Girls in the Game: Factors that Influence Sport
Participation. New York, NY: Women’s Sports Foundation.

© 2020, Women’s Sports Foundation, All Rights Reserved.

                Women’s Sports Foundation                                                  Keeping Girls in the Game: Factors that
                WomensSportsFoundation.org                       3                         Influence Sport Participation
Table of Contents

Executive Summary...........................................................................................................................................................................5

       Key Findings ................................................................................................................................................................................... 5

Introduction ......................................................................................................................................................................................9

Methodology.................................................................................................................................................................................... 10

Youth Participation by Gender, Race/Ethnicity, Household Income, and Urbanicity....................................................................13

Youth Motivation and Social-Emotional (Intrapersonal) Factors ..................................................................................................19

       Enjoyment and Value.....................................................................................................................................................................19

       Self-Confidence, Mastery, Performance.................................................................................................................................... 20

       Friendship and Belonging............................................................................................................................................................ 22

       Body Image/Self-Consciousness................................................................................................................................................ 23

Social Influences ............................................................................................................................................................................. 27

       Parent Socialization and Support............................................................................................................................................... 27

              Parents Beliefs and Values....................................................................................................................................................... 27

              Providing Role Models..............................................................................................................................................................28

              Parents’ Tangible Supports......................................................................................................................................................30

      Peer Support................................................................................................................................................................................. 30

The Sports Setting (Culture of Sport and Quality of Experiences)................................................................................................34

      Female Role Models in the Sport Setting.................................................................................................................................... 34

      Competent (and Likable) Coaching ........................................................................................................................................... 34

              Mastery-Based (Fun, Skill Development) Strategies.............................................................................................................35

              The Culture of Competitiveness and Performance-Based Strategies.................................................................................35

      Safety............................................................................................................................................................................................ 37

Conclusions...................................................................................................................................................................................... 41

Limitations and Future Directions...................................................................................................................................................42

Policy and Practice Recommendations...........................................................................................................................................43

Appendix: Survey of Girls and Their Parents..................................................................................................................................48

References........................................................................................................................................................................................61

                         Women’s Sports Foundation                                                                                           Keeping Girls in the Game: Factors that
                         WomensSportsFoundation.org                                                4                                         Influence Sport Participation
Executive Summary

Keeping Girls in the Game: Factors that Influence Sport                  sports (36.4% girls vs. 45.6% boys) compared to boys,
Participation is one of the first studies of its kind to                 and sport drop-out rates within the sample were
systematically examine social processes influencing youth                significantly higher among girls than boys (36% girls
entry, retention, and drop out from sports. To gain a                    vs. 30% boys). African American youth and youth from
greater understanding of these disparities in participation              low-income households were least likely to be current
and drop out and identify areas to intervene, the                        players and most likely to have never played sports
current report explores how key characteristics of youth                 compared to others, and these observed disparities
(intrapersonal), their social influences (e.g., interpersonal            were especially prominent for the girls within
parent and peer factors), and experiences within the sport               low‑income homes and/or African American families.
setting may vary by gender, age, race/ethnicity, family                  Likewise, sport drop-out rates were higher among
socioeconomic background, and region.                                    youth from low-income households ($0-$49,999;
                                                                         39.9%) compared to families of higher income
To accomplish this objective, the Women’s Sports
                                                                         ($100,000 or higher; 29%).
Foundation (WSF) commissioned a national survey about
the participation and experiences of youth in sports                2.   Parents play multiple roles in supporting or hindering
to identify critical factors related to youth entrance                   their girls’ participation in sport. Improving parents’
into sport and those associated with dropping out of                     engagement and support in their girls’ sports
sports. The survey was administered to a nationally                      participation can help reduce girls’ higher rates
representative sample of boys and girls (N=3,041)                        of dropout in sport. Parents support children’s
between the ages of 7-17 and their parents (N=3,041) to                  participation in sport through imparting/relaying
inquire about child‑related, sport-related, and systemic                 key beliefs and attitudes about sport to their youth,
factors expected to influence youth access, experiences,                 including that they are capable and belong in sport,
and motivations for initial participation (entrance) and                 providing exposure to role models that resonate with
sustained/continued participation in sport. Based on                     youth, and through direct provision of their children’s
their sport participation status at the time of the survey,              sports experiences, including emotional supports
children were categorized into one of three groups:                      (e.g., attending games, practicing with their child)
Currently Playing Organized Sport(s) (n=1,207; 43%;                      and tangible supports (e.g., buying equipment,
539 girls, 668 boys), Dropped Out of Sport (n=626; 17%;                  providing transportation). For boys, parent support
312 girls, 314 boys) and Never Played (n=1,208; 40%;                     does not vary much between current players and
666 girls, 542 boys). Although “dropped out” can be                      dropouts. However, for girls, parents of current
defined as ending participation in a specific sport (i.e.,               athletes tend to provide greater supports across the
sport-specific attrition, where youth exit one sport but                 majority of ways parents can be involved in their
opt into participation in another sport), for the current                child’s sports involvement, with particularly higher
report we are most interested in complete exit from sports               involvement in providing transportation, attending
and, thus, define “dropped out” as those who played                      games, buying equipment, providing food for games,
a sport in the past but no longer engage in any type                     paying for opportunities to play throughout the year,
of sport (i.e., sport-general attrition). This assessment                and taking their daughters to watch sporting events,
offers important insights on critical personal, social, and              compared to parents of girls who have dropped out.
sport-level supports needed to recruit and retain youth in
                                                                    3.   Gender stereotypes in sport prevail. Despite the
sport, and effective ways to address disparities observed
                                                                         powerful influence that parents and peers can
in participation and rates of drop out by gender, race/
                                                                         play in supporting youth sports participation,
ethnicity, family income, and location/urbanicity.
                                                                         gendered stereotypes about sports that inhibit girls’
                                                                         participation are still prominent. Alarmingly, a third
Key Findings                                                             of parents (32.2%) endorsed the belief that boys are
                                                                         better at sports than girls, and this does not vary
1.   Disparities persist. Disparities in participation and               by youth sport status. Parents of youth who have
     in dropout by gender, race/ethnicity, household                     never played sports were also more likely than other
     income, and urbanicity persist. Aligned with national               parents to endorse that girls are not as competitive
     participation statistics, girls in the study sample                 as boys and that sports are more important to boys
     were more likely to have never played (43.1% girls                  than girls. Getting teased by peers, including being
     vs. 34.5% boys) and less likely to be currently playing             made fun of or made to feel uncomfortable while

                Women’s Sports Foundation                                                Keeping Girls in the Game: Factors that
                WomensSportsFoundation.org                      5                        Influence Sport Participation
sport organizations. Two-thirds of current players and
                                                                          two-thirds of youth who have dropped out of sport
                                                                          in the current study have or had a male coach, and
                                                                          male assistant coaches were equally as prominent as
                                                                          male head coaches. Disparities in parents’ provision
                                                                          of role modeling opportunities was also evident.
                                                                          Overall, parents provided minimal encouragement to
                                                                          their child to follow sports figures in the media (only
                                                                          15% of parents of current players and 12% of those
                                                                          who dropped out), with parents of boys, as well as
                                                                          Hispanic and Black parents, more likely to provide
                                                                          this support. Likewise, only a third of parents of
                                                                          current players (and 26% of those who dropped out)
                                                                          reported they take their children to watch sporting
                                                                          events, and this was disproportionately a resource
                                                                          provided to youth from middle- to higher-income
                                                                          households, especially boys.

                                                                     5.   Celebrate being strong: Sport can help build positive
                                                                          body image. The majority of parents (across youth
Bridge the Gap                                                            status) endorsed that sports promote positive body
                                                                          image, with parents of current players especially
                                                                          likely to endorse this belief and current players
     they play sport, was also a prominent issue identified
                                                                          benefiting from sport in this way. Current players
     by youth who dropped out of sport. However, even
                                                                          were much more likely than those who dropped
     among current players, almost one-third reported
                                                                          out or those who have never played to say they feel
     experiencing being made fun of while playing sports.
                                                                          confident about their bodies and that their bodies are
     Although both boys and girls equally reported being
                                                                          getting healthier. They were also more likely to report
     teased, boys were more likely to experience this
                                                                          feeling they are the right height and size, and most
     during the younger childhood years, whereas girls
                                                                          likely to perceive themselves as really coordinated.
     were increasingly more likely to experience this
                                                                          Ironically, poor body image can inhibit youth from
     through the adolescent years during a peak time
                                                                          participating in sport, with dropouts and those who
     when we observe girls dropping out of sport.
                                                                          have never played more likely to report feeling
     The lack of support and teasing girls endure from                    awkward about their bodies and not liking the way
     their peers can result in heightened awareness of                    their bodies look. These differences were equivalent
     appearance and self-consciousness while playing                      for boys and girls and were greatest among older
     sport. In the current study, girls who have dropped                  youth. Moreover, when asked what they like about
     out of sport were significantly more likely to report                playing sports, current players were more likely than
     being self-conscious about playing sports (e.g., they                dropouts to report “being strong” (i.e., celebrating
     don’t like the way they look in the uniforms) and were               the capabilities of their bodies) as something they
     twice as likely to say they don’t like playing sports                enjoy, while “losing or maintaining weight or to
     because they don’t like to get sweaty. Performance                   look better,” a more appearance-based focus,
     worries, such as not playing well, messing up                        was more of a factor for sport dropouts, especially
     during a game/competition, and losing, were also                     older girls. Although poor body image appears to
     all significantly more prevalent concerns among                      affect both boys’ and girls’ participation equally,
     girls who dropped out of sport than among current                    appearance-related motivations for participation
     female athletes.                                                     may be particularly detrimental to youth’s continued
                                                                          participation, especially for females.
4.   “If you can see it, you can be it.” The provision of role
     models is particularly important for girls and other            6.   Coaches shape the sport experience. Coaches play
     underrepresented youth in sport, acting as a powerful                a central role in getting and keeping youth involved
     force to help youth see individuals like themselves in               in sports. Similarly, for both boys and girls, current
     and around the game, that directly understand the                    players reported liking their coach more than
     unique experiences and challenges that they face in                  sport dropouts do, and dropouts were more likely
     sport, and that they can aspire to become. Despite                   to have liked their coach only “a little” or “not at
     the importance of role models for girls and other                    all.” Parent evaluations of the coach also reflected
     underrepresented youth in sport, there continues to                  these differences, with parents of current players
     be a shortage of females on the coaching staffs as                   more likely to report that their child’s coach is
     well as in other prominent administrative roles within               excellent, and parents of sport dropouts more likely

                 Women’s Sports Foundation                                                Keeping Girls in the Game: Factors that
                 WomensSportsFoundation.org                      6                        Influence Sport Participation
to rate the coach less positively. Several coaching                Cost also was provided as a cause for dropping out
     qualities differentiated current players’ coaches                  among working-class families, but only for girls who
     from the coaches of those who dropped out of sport.                dropped out. For urban parents, a lack of access
     Interestingly, in the current study, we found coaches              to programming and difficulty getting their child to
     of current players are slightly more competitive in                practice were identified as key barriers. Likewise,
     nature than coaches of sport dropouts, with playing                youth from low-income households who never played
     time more commonly determined by youth effort                      sports identified the cost of sports, inability to get
     and skill than just equally distributed across players.            to practice (i.e., transportation), and safety, as the
     Coaches of current players were also more likely to                key deterrents to participation, with cost of sport
     have an equal focus on both winning and having fun                 disproportionately of greater concern to African
     (not just having fun). Additionally, current players               American and Hispanic families. These findings not
     were more likely than dropouts to have a coach                     only support previous research that has shown money
     that sets team and individual goals. Together, these               is a primary driver of entrance into sport but also
     qualities may help impart/reinforce to players that                emphasize the need to address the cost of sport to
     their playing matters, that their efforts are paying               support retention in sport (prevent dropout). These
     off, and that the coach cares about their growth as                efforts may be particularly fruitful for supporting
     athletes (i.e., takes it seriously).                               the continued participation of African American
                                                                        and Hispanic girls, and girls from low-income and
7.   Some girls live for the competition, and some girls
                                                                        working-class families for which cultural assumptions
     are in it for the fun. The desire for competition among
                                                                        intersect with race/ethnicity and social class to
     current players increased with age, especially for
                                                                        magnify these existing environmental barriers that
     girls, so that “competing” was identified as a critical
                                                                        these girls face in accessing sports.
     component of enjoyment for older current players
     for both genders. However, for some youth, “too               9.   Maintaining a love of sport (overcoming competing
     much” competitiveness (or a sole focus on winning                  interests) is key to continued participation. Current
     without a focus on fun and skill development) may                  athletes reported a love for their sport, with
     undermine youth motivations to participate in sport,               significantly more teen girls endorsing this love of
     with “too competitive an environment” making the                   sports compared to boys (72% girls vs. 54.8% boys).
     top 10 reported reasons for dropping out or never                  Maintaining a love of sport is critical, especially in the
     playing sport for both boys and girls. Likewise, being             face of multiple competing interests. Sport dropouts
     a top player on the team (i.e., a major contributor)               reported a loss of interest in sport and preference
     for current players was defined similarly for boys                 for other activities, especially increased interest in
     and girls and included some competitive goals such                 one’s social life as they get older, as primary reasons
     as being excited about making the winning play                     for no longer participating in sport. Fostering youths’
     and being better than one’s teammates. Youth who                   continued love of sport through building confidence,
     dropped out of sports were significantly less excited              a sense of mastery, and connection to one’s
     than current players about these goals, and this was
     especially true for girls who dropped out. Rather,
     the social experience of “being someone the team
     can rely on” was the only goal that girl dropouts
     were equally as excited about as boy dropouts.
     Multiple types of sport options need to be available,
     accessible, equally advertised and equally valued
     as competitive options in order to meet the needs
     of youth who have other motivations for playing.
     Additionally, developing strategies (e.g., marketing,
     information sessions, etc.) to help parents navigate
     these differing sport programs and identify the best
     match for their own child also would help support
     these efforts.

8.   Cost, transportation, and lack of access keep youth
     out. Some of the social inequalities observed in sport
     result simply from the costs that participation can
     incur. Among families with low household income
     and Hispanic families, cost of participating was
     identified as a primary barrier for why their child
     dropped out of sport, especially for Hispanic girls.
                                                                   WSF Founder Billie Jean King

                Women’s Sports Foundation                                                Keeping Girls in the Game: Factors that
                WomensSportsFoundation.org                     7                         Influence Sport Participation
teammates is critical. Additionally, building the sport experiencing greater amounts of teasing and bullying
experience to include community outreach, character from peers while participating in sport. Together these
education, academic supports, and other positive social factors espouse messages to girls that they do not
social experiences can help meet youths’ varied belong in sport and can lead to performance worries/
developmental needs. anxiety and heightened awareness of appearance and
self-consciousness when playing sports that put girls at
10. There is a need to educate parents about the
greater risk of dropping out.
academic benefits of participation. Sports
participation has been consistently shown to The report indicates a number of strategies that
support all aspects of academic achievement, can be implemented to reduce the disproportionate
including positive academic self-concepts, a positive drop‑out rates among girls in sports. For girls and
attitude towards schoolwork, improved academic other underrepresented youth in sport, having multiple
performance and higher grades, and higher champions in their daily lives can be particularly
educational aspirations and attainment. However, beneficial, helping to counter the cultural and social
despite substantial evidence of the positive impact barriers that they face in playing sport (e.g., teasing,
of sports participation on academics, the demands exclusion, inequality, feeling less valued). Parent
of academics ranked among the top five barriers education and intervention to improve parental
to sports participation for both youth who never engagement and support in their girls’ sports
played and those who have dropped out of sport, participation is needed to significantly reduce girls’
with 30% of youth and their parents reporting a higher rates of dropout in sport. There also needs to be
need to focus more on studying and grades as a increased resources allocated towards encouraging
primary reason to dropping out of sports, and well women to coach and widely accessibility training
over half of sport dropouts and three-quarters programs and clinics for coaches that address effective
of their parents indicating that sports can get in coaching strategies for recruitment and retention of girls.
the way of academics. Academic demands were Additionally, tailoring the sport setting in various ways to
disproportionately an issue for older youth and an nurture youth’s varied development needs will help foster
especially prominent deterrent for Hispanic youth and a continued love for sport. This may entail ensuring access
teen girls’ participation. The more deliberate coupling to multiple types of sport options that map on to youth
of sport experiences with academic supports, motivations for playing. These efforts will help us reach
especially as youth get older, can further bolster the our ultimate goal of developing inclusive and safe sport
academic benefits youth gain for their participation settings for all youth.
and help impart/reinforce to youth and their parents
that sports is complimentary/supportive of youth
academic achievement (not an antithesis to it).
Findings from this report provide important insights into
the gender, race/ethnicity, and socio-economic disparities
found in sports participation and dropout, and identify
critical areas to intervene. First and foremost, more
work needs to be done to improve access and inclusion
in sport: an alarming 40% of girls and one-third of boys
reported having never played sport in our sample, and
over one-third dropped out of sport. The cost of sport not
only remains a primary determinant of youth entrance
into sport, but also plays a major role in determining
who can stay in sport, disproportionately affecting girls’
participation, especially girls of color.
Along with systemic issues concerning access, several
social influences were also associated with these
disparities, functioning to either support or deter girls’
(and other under represented youth’s) participation in
sport. In particular, gendered cultural norms remain a
major barrier for girls’ participation in sport, influencing
all aspects of girls’ experiences in sport. Parents’
socialization behaviors and stereotyped beliefs favor
boys in sports, there is still a lack of female presence on
the coaching staff and in other prominent administrative
roles within sport organizations, and teen girls reported
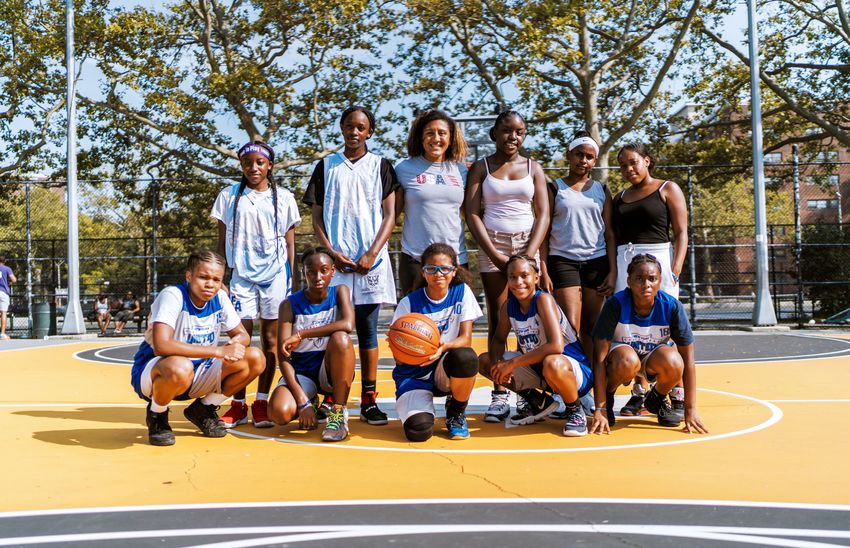
Girls in the Game
Women’s Sports Foundation Keeping Girls in the Game: Factors that
WomensSportsFoundation.org 8 Influence Sport ParticipationIntroduction
Keeping Girls in the Game: Factors that Influence Sport
Participation is one of the first studies of its kind to
systematically examine processes influencing youth
entry, retention, and exit from sports. Unwavering
evidence indicates that sports can be an important
context to support the health and well-being of youth:
Quality sports programming has been associated with
physical and mental health, healthy lifestyle habits,
motor/physical literacy, psychosocial well-being, and
achievement (i.e., cognitive and academic benefits).
Despite the developmental benefits of participation,
national survey data (2017 National Survey of Children’s
Health (NSCH) data query) indicates that only 58% of
youth ages 6-17 participate in team sports or have
played sports after school or during the weekends in the
past year. Participation rates are notably lower among
girls and underserved populations, including racial
and ethnic minorities and youth from lower-income
households (USDHHS, 2019). Low participation rates and
disparities in participation by gender, race/ethnicity, and
socioeconomic status have recently been identified as a Southern California Golf Association Junior
national issue. In response, a presidential executive order
was issued on the President’s Council on Sports, Fitness & a later average age but tend to drop out earlier than
Nutrition in 2018 to develop a national strategy on youth their counterparts, leaving an even narrower window of
sports to increase youth engagement in communities with participation opportunities.
below-average sports participation and limited access to
The current report set out to identify key factors
athletic facilities or recreational areas.
and best practices for keeping youth in sport as well
However, increasing sports participation among today’s as preventable/modifiable factors that increase
youth will require that we extend beyond just a focus on youth chances of dropping out of sport. We took a
what it takes to make sports more available and recruit developmental ecological systems approach that
youth into sport, to one that also considers best practices considers the interplay between the multiple levels of
for how to retain youth in sport. The consistent high rates influence on youth participation. This involved an in‑depth
of youth dropping out of sport after initial involvement has exploration of the ways in which key characteristics
been a long-term concern, with, on average, over 30% of youth (intrapersonal), their social influences (e.g.,
of youth exiting sport each year (Balish et al., 2014; Sabo interpersonal parent and peer factors), and experiences
& Veliz, 2014). Gender disparities in dropout also exist within the sport setting interact with one another to
so that not only do girls’ participation rates lag behind differentiate current players from those who have never
those of boys at all ages (Craggs et al., 2011; Dumith et al., played and from those who have dropped out of sport.
2012), but also attrition rates in sport is two to three times Given disparities observed in both participation rates
greater for girls than for boys (Telama & Yang, 2000). and rates of dropout, it is likely that these factors may
Further variations exist in dropout by age, race/ethnicity, differentially influence participation depending on the
and family socioeconomic background. The first major socio-demographic characteristics of youth and their
declines in sports participation are observed around ages families. Thus, the current report set out to examine how
12 to 13 for girls (Cooky, 2009; Shakib & Dunbar, 2002) these factors may differ for boys and girls, as well as for
but tend to occur somewhat later (and at less steep a youth at different ages and from different socioeconomic
decline) for boys. These declines impact African American backgrounds, race/ethnicities, and regions.
and Hispanic girls (Cockburn & Clarke, 2002) and youth
from low-income households (Sabo & Veliz, 2014) most
greatly, who have been found to not only enter sport at
Women’s Sports Foundation Keeping Girls in the Game: Factors that
WomensSportsFoundation.org 9 Influence Sport ParticipationMethodology
To accomplish this objective, the Women’s Sports 666 girls; 542 boys). Among youth who played more
Foundation (WSF) commissioned a national survey about than one organized sport, the survey software would
the participation and experiences of youth in sports to randomly select one sport for youth and their parents
identify critical factors related to youth entrance into to report on. Although “dropped out/exited sport” can
sport and those associated with exiting sports. The survey be defined as ending participation in a specific sport
was administered to boys and girls between the ages of (i.e., sport‑specific attrition, where youth exit one sport
7-17 and their parents/guardians to inquire about child- but opt into participation in another sport), for the current
related, sport-related, and systemic factors expected to report we were most interested in complete dropout from
influence youth access, experiences and motivations for sports and thus, define “dropouts” as those who played a
initial participation (entrance) and sustained/continued sport in the past but no longer engage in any type of sport
participation in organized sport. Organized sport was (i.e., sport‑general attrition).
defined as participation in a sport/athletic activity that
Among current players basketball, baseball/softball,
had a coach/instructor and regularly scheduled practices
and soccer were the three most popular sports overall
(or training) and competitions (e.g., interscholastic
for both boys and girls (played by nearly one-third of
sports, out-of-school community or school programming,
current players) (see Figure 1). Sport dropouts and those
recreational organizations, travel team/clubs). A
who have never played were significantly more likely
nationally representative sample of youth (N=3,041) and
to report enjoying tech activities (spending time online)
their parents (N=3,041) participated in the survey. If a
than current players. Kids who never played sports more
family had more than one child that fell within the study’s
often reported enjoying other activities like playing
age range, then one child in the family was randomly
outside, reading and art/drawing as well (see Figure 2
selected by the survey software to be in the study. Based
on following page). However, it should be noted that
on their sport participation status at the time of the survey,
children who play sports were equally as involved in other
children were categorized into one of three groups:
organized activities (e.g., religious education, school
Currently Playing Organized Sport(s) (n=1,207; 40%;
clubs, music lessons, community service clubs, etc.) as
539 girls; 668 boys), Dropped Out/Exited Sport (n=626;
sports dropouts and those who never played (see Figure 3
20%; 312 girls; 314 boys) and Never Played (n=1,208; 40%;
on page 12).
Figure 1. Most Popular Sports, Overall and by Gender
Current Participants Boys Girls
(n=1,207) (n=668) (n=539)
Basketball 31% Basketball 36% Basketball 25%
Baseball/Softball 28% Baseball/Softball 35% Soccer 24%
Soccer 28% Soccer 32% Dance 23%
Swimming/Diving 19% Football 25% Baseball/Softball 20%
Football 15% Swimming/Diving 18% Volleyball 20%
Dance 12% Martial Arts 12% Swimming/Diving 20%
Track/Cross Country 12% Track/Cross Country 12% Gymnastics 14%
Volleyball 11% Tennis 11% Track/Cross Country 12%
Tennis 11% Golf 8% Tennis 10%
Martial Arts 10% Weightlifting 6% Cheerleading 8%
0 5 10 15 20 25 30 35 0 5 10 15 20 25 30 35 40 0 5 10 15 20 25
Women’s Sports Foundation Keeping Girls in the Game: Factors that
WomensSportsFoundation.org 10 Influence Sport ParticipationFigure 2. Children’s Top 5 Favorite Things to Do
69%
Organized Sports/Athletics 25%
11%
66%
Hang Out with My Friends 63%
57%
56%
Watch TV/Movies/Videos 64%
66%
52%
Play Video/Computer Games 56%
55%
43%
Play Outside 41%
51%
35%
Spend Time Online 41%
39%
30%
Read 34%
40%
27%
Informal/Pick-up Sports/Athletics 17%
13%
15%
Music Lessons 18%
20%
15% Older kids are more likely to
Dance 18%
24% say they like to hang out with
14% friends, but the trends hold
School Clubs 15%
14% across age and gender – kids
Art/Drawing Lessons
13%
28%
who play sports are more
31% likely to have stronger social
12%
Religious Education 11% connections.
15%
11%
Acting/Singing/Performing Arts 19%
18%
10%
After-school Academic Activities 9%
10%
10%
Girl/Boy Scouts 13%
10%
9%
Community Service Activities 11%
11%
7%
Cheer 6%
6%
0 10 20 30 40 50 60 70 80
Current Participants Dropouts Never Played
Women’s Sports Foundation Keeping Girls in the Game: Factors that
WomensSportsFoundation.org 11 Influence Sport ParticipationFigure 3. Activities Children Currently Participate In
100%
Organized Sports/Athletics 15%
5%
30%
Religious Education 28%
24%
28%
Music Lessons 25%
21%
28%
School Clubs 25%
16%
26%
Community Service Activities 22%
15%
19%
After-school Academic Activities 20%
14%
15%
Acting/Singing/Performing Arts 19%
13%
14%
Art/Drawing Lessons 15%
16%
14%
Dance 14%
16%
16%
Girl/Boy Scouts 12%
10%
0 20 40 60 80 100
Current Participants Dropouts Never Played
Women’s Sports Foundation Keeping Girls in the Game: Factors that
WomensSportsFoundation.org 12 Influence Sport ParticipationYouth Participation by Gender, Race/Ethnicity, Household
Income, and Urbanicity
Aligned with national participation rates, girls in the study Figure 5. Participation in Sports and
sample were significantly more likely to have never played
Race/Ethnicity, by Gender
(43.1% girls vs. 34.5% boys) and less likely to be currently
playing (36.4% girls vs. 45.6% boys) compared to boys.
Income, ethnicity, and urbanicity have an additional
Current 44.1%
impact on whether children play organized sports. 42.6%
Participants
African American youth and youth from low-income
(Boys) 47.3%
households were significantly least likely to be current 41.8%
players and most likely to have never played sports Current 35.3%
compared to the other groups studied. These observed Participants 28.3%
disparities were especially prominent for girls within (Girls) 37.9%
low-income homes and/or African American families (see 40.4%
Figures 4 and 5). Living in a suburban location appears 19.0%
to give an advantage to youth (both boys and girls) for Dropouts 14.8%
participating in sport. Although “a lack of programs”
(Boys) 20.8%
23.1%
was a deterrent only reported by a small percentage of
18.6%
Dropouts 17.1%
(Girls) 22.3%
Figure 4. Participation in Sports and 17.6%
Household Income, by Gender Never 36.9%
Participated 42.6%
(Boys) 31.9%
35.1%
Current 30.8%
Participants 47.9% Never 46.1%
(Boys) Participated 54.5%
55.4% 39.9%
(Girls) 41.9%
Current 24.6%
Participants 34.8% 0 10 20 30 40 50 60
(Girls) 46.9%
Hispanic Black White Other
Dropouts 18.9%
(Boys) 20.2%
20.5%
17.9% the sample who never played sports (1 out of every 10
Dropouts parents) and equivalently experienced by parents across
(Girls) 20.4%
22.9% sociodemographics, the cost of sports, safety, and lack of
access were primary factors driving gender, race/ethnic,
Never 50.3% and income-based disparities. For youth from low-income
Participated 31.9% households (HHIFigure 6. Top Reasons Parents Say Their Children Have Never Played Sports
Not Interested in Sports 43%
Prefers to Participate in Other Types of Activities 34%
Not Athletic 23%
Wanted to Focus More on Studying and Grades 23%
The Cost of Participating Was Too High 23%
Does Not Think Sports or Physical Activity is Fun 19%
I Worry about Their Safety 15%
Does Not Like the Competitiveness of Organized Sports 14%
Got More Interested in Their School or Community 13%
Would Have a Problem Traveling to Practices 13%
0 10 20 30 40 50
Figure 7. Top Reasons Children Say They Have Never Played Sports
I’m Not Interested in Sports 42%
I Have Another Activity I Like Better than Sports 28%
I Don’t Think It Is Fun 23%
I Needed to Focus on Studying and Grades 21%
It Costs Too Much 20%
My Parent(s) Worry About My Safety 14%
I Worry About My Safety 14%
I’m Very Interested in My Social Life 13%
I Do Not Like to Compete (Too Competitive an Environment) 12%
I Wouldn’t Be Able to Get to Practice 12%
0 10 20 30 40 50
Women’s Sports Foundation Keeping Girls in the Game: Factors that
WomensSportsFoundation.org 14 Influence Sport ParticipationFigure 8. Entry and Exit Among Dropouts
Past Participants Boys Girls
12 12 12
10 11.1 10 11.2 10 11.0
5.1 5.1 5.2
8 8 8
6 6 6
6.0 6.1 5.8
4 4 4
2 2 2
0 0 0
Age of Entry Age of Exit Age of Entry Age of Exit Age of Entry Age of Exit
Window of Opportunity Window of Opportunity Window of Opportunity
Figure 10. Window of Participation, by
Figure 9. Window of Participation, by Gender
Household Income
6 6
5 5 5.6
5.1 5.1 5.2 5.0
4 4 4.5
3 3
2 2
1 1
0 0
Total Boys Girls $49,999 $50,000– $100,000
or less $99,999 or more
Figure 11. Window of Participation and
Household Income, by Gender
6
5 5.4 5.8
5.0 5.0
4 4.7 4.3
3
2
1
0
Boys Girls
$49,999 or less $50,000–$99,999
$100,000 or more
Women’s Sports Foundation Keeping Girls in the Game: Factors that
WomensSportsFoundation.org 15 Influence Sport ParticipationFigure 12. Entry and Exit, by Household Income
$49,999 or less $50,000–$99,999 $100,000 or more
12 12 12
10 10.8 10 11.1 10 11.2
4.5 5.0 5.6
8 8 8
6 6 6
6.3 6.1 5.6
4 4 4
2 2 2
0 0 0
Age of Entry Age of Exit Window of Opportunity
Figure 13. Window of Participation, by Figure 14. Window of Participation and
Race/Ethnicity Race/Ethnicity, by Gender
6 6
5 5 5.8 5.7 5.9
5.3 5.0 5.1 5.2 5.0 5.2 5.0
4 4 4.3
3 3
3.8
2 2
1 1
0 0
Hispanic Black White Other Boys Girls
Hispanic Black White Other
Figure 15. Entry and Exit, by Race/Ethnicity
White Children Hispanic Children Black Children
12 12 12
12.0
10
5.1 11.0 10
5.3 10.8 10
5.0
8 8 8
6 6 6 7.0
4
5.9 4 5.6 4
2 2 2
0 0 0
Age of Entry Age of Exit Window of Opportunity
Women’s Sports Foundation Keeping Girls in the Game: Factors that
WomensSportsFoundation.org 16 Influence Sport Participationgirls to practice). Cost of sport was also disproportionately Some of these social inequalities result simply from the
of greater concern to families of color than white families. costs that participation can incur. Participation can
include program fees, equipment purchases, league
Also aligned with national participation statistics, when
donations and raffles, transportation costs, uniform
considering all youth in the sample who ever participated
purchases, consultant fees, medical bills (e.g., sport
in sports, the sport drop-out rates within the sample
physicals), and special school taxes. School-based sports
were significantly higher among girls (36.1%) than boys
are no longer immune to these participation costs (Eyler
(30.4%), and among youth from low-income households
et al., 2018), with communities that have fewer assets to
($0‑$49,999; 39.9%) compared to families of higher
expend on school-based sport programs incurring the
income ($100,000 or higher; 29%). On average, youth
highest costs for participation (Eyler et al., 2018; Sabo
started playing sports at about 6 years old, played for
& Veliz, 2014). Likewise, families with more disposable
just over five years, and exited at age 11. Although little
income find it easier to support a child’s athletic
variation in this pattern was seen by gender, there were
involvement than low-income families do. As pay-for-
some differences by race/ethnicity and income (see
play sport opportunities grow increasingly more popular
Figures 8-15 on following pages).
and as the expense of school- and community-based
African American children tended to enter sports later sports also increases, disparities in access to sports for
but also remain in sports later.1 In contrast, children lower-income and middle-income families have only
from lower-income households also entered sports increased in recent years (Eyler et al., 2018; Sabo & Veliz,
later but exited sports earlier, resulting in significantly 2014). Moreover, communities, school, and parents have
less time spent in sports (Over a one-year disparity in been shown to devote more resources and invest more
this window of opportunity compared to high-income in supporting boys’ participation (Amorose & Anderson-
households). This income disparity among youth who Butcher 2015; Keathley et al., 2013; McCallister et al.,
drop out was greater for girls (1.5 years) than it was for 2003). Thus, the increased costs for participation in public
boys (0.7 year). Moreover, when parents of dropouts schools and community programs disproportionately
(and children who dropped out) were asked what were affects girls’ participation in sports, as parents who have
the primary factors for why their child stopped playing limited finances prioritize their sons’ participation over
sport, cost of participating was identified as a primary their daughters’ (Kipp & Weiss, 2013; Zarrett et al., 2019).
barrier for Hispanic families, especially Hispanic girls
Other disparities result from larger social-cultural and
(see Figures 16 and 17 on following page). As expected,
institutional forces that can influence youth options and
families with low household income also reported cost
access to sport as well as their interest, motivation, and
as a reason for both girls and boys who dropped out of
the type of socialization and support they receive from
sport. However, interestingly, cost was also provided as
parents, coaches, friends, and other important people in
a cause for dropping out among working-class families,
their lives (see Zarrett et al., 2019 for review). For example,
but only for girls who dropped out. These findings not
gendered societal expectations and stereotypes about
only support previous research that has shown cost is a
femininity, along with other cultural and religious norms,
primary driver of entrance into sport (Sports & Fitness
espouse messages of sport as masculine. In turn, these
Industry Association (SFIA) data for the Aspen Institute,
gendered cultural messages result in girls receiving less
2013), but also emphasizes the need to address the cost
tangible and emotional support for participation, girls’
of sport to support retention in sport (prevent dropout).
increased likelihood of experiencing teasing and bullying
These efforts may be particularly fruitful for supporting
from peers for playing sport, and girls’ own feelings
the continued participation of African American and
that they do not belong in sport. Barriers to initial and
Hispanic girls, and girls from low-income and working-
continued participation are even greater for girls of color,
class families. Interestingly, for urban parents and for
immigrant girls, and girls residing in urban regions, as
minority youth, a lack of access to programming and
cultural assumptions intersect with race/ethnicity and
difficulty getting their child to practice were identified as
social class to magnify the existing environmental barriers
key barriers for both boys and girls who have dropped
that these girls face in accessing sports (Cooky, 2009;
out of sport. These findings suggest that many parents in
Sabo & Veliz, 2008). To gain a greater understanding of
urban areas were having to go to great lengths to provide
these disparities in participation and drop-out rates and
transportation for their child to participate in distant
identify areas to intervene, the current report explores
programs which can be difficult to sustain. Differences
how key characteristics of youth (intrapersonal), their
in participation and drop‑out rates by these youth and
social influences (e.g., interpersonal parent and peer
family sociodemographic characteristics are indicative of
factors), and experiences within the sport setting may
various systemic issues concerning access.
vary by gender, age, race/ethnicity, family socioeconomic
background, and region.
1 African American boys tend to have the smallest
participation window. This may capture the consequences
of entering sports later, when sports have increased in
competitiveness and other youth have already developed a
more advanced skill set specific to the sport.
Women’s Sports Foundation Keeping Girls in the Game: Factors that
WomensSportsFoundation.org 17 Influence Sport ParticipationFigure 16. Top Reasons Parents Say Their Children Stopped Playing Sports
No Longer Interested in Sports 35%
It Was No Longer Fun 20%
Found Another Activity They Liked Better Than Sports 19%
The Cost of Participating Was Too High 14%
Found Another Sport They Liked Better 12%
Wanted to Focus More on Studying and Grades 12%
Got More Interested in Their Social Life 10%
There Are No Programs in School or Community 10%
They Were Not A Good Enough Player 8%
Was Not Confident 8%
0 5 10 15 20 25 30 35
Figure 17. Top Reasons Children Say They Stopped Playing Sports
No Longer Interested in Sports 37%
It Was No Longer Fun 27%
I Found Another Activity I Liked Better Than Sports 18%
I Got More Interested in My Social Life 15%
I Wanted to Focus More on Studying and Grades 14%
I Was Not A Good Enough Player 14%
It Costs Too Much 11%
I Found Another Sport I Liked Better 10%
There Are No Programs in My School or Community 9%
Did Not Like to Compete (Too Competitive an Environment) 8%
0 5 10 15 20 25 30 35 40
Women’s Sports Foundation Keeping Girls in the Game: Factors that
WomensSportsFoundation.org 18 Influence Sport ParticipationYouth Motivation and Social-Emotional
(Intrapersonal) Factors
According to theory and previous research, intrapersonal Enjoyment and Value
motivation factors, such as how much youth find sport
to be “fun,” enjoy their participation, feel that they are In the current study, current players were significantly
good at it, and think their participation is valuable/ much more likely to have positive feelings towards their
important, all have substantial influence on youth choices sport (“love[d] it”). This love for the sport was steady
to continue or opt out of sport (Eccles & Harold, 1991). across ages for boys (approximately half of current
Likewise, feeling comfortable with oneself in sport, as players across ages), but increased for girls by age, so
well as feeling connected to teammates, a sense of that significantly more girls in the older age brackets
belonging to the group, and capable of making valuable reported a love of sports (72.1%) compared to boys
contributions to shared team goals fuels motivation and (54.8%). These gender differences suggest that the love of
engagement (Ames, 1992; Eccles & Harold, 1991; Nicholls, sport is particularly important for girls’ retention in sport.
1984; Ryan & Deci, 2000). These intrapersonal factors are For girls, who must overcome a multitude of gendered
influenced by youths’ preconceived notions and previous barriers to participation, only those with the greatest love
personal experiences in sport, as well as by the attitudes of the sport endure. Along with having a love for sport
and behaviors of important people in their lives and the (i.e., enjoyment), youth perceptions of the importance or
cultural environment (Eccles & Harold, 1991; Zarrett & value of sports in their lives also differentiated current
Eccles, 2009). players from youth who dropped out. Not only did current
players place significantly higher importance/value on
playing sports than youth who dropped out, but also their
parents placed greater value on sports participation (see
Figure 18). In contrast, both dropouts and those who never
Figure 18. Perspectives on Playing Sports: Percentage of Parents and Children Who Thought
Playing Sports Was Extremely or Very Important
Parents’ Perspectives on Children’s Perspectives on
Child Playing Sports Playing Sports
80
70 74%
72%
60 64% 62%
50
40
37%
30 33% 32% 33% 34%
31% 29%
27%
20
10
0
Importance Children Importance Parents Children’s Importance Importance Parents
Place on Playing Sports Place on Playing Sports of Playing Sports Place on Playing Sports
Current Participants Dropouts Never Played
Women’s Sports Foundation Keeping Girls in the Game: Factors that
WomensSportsFoundation.org 19 Influence Sport ParticipationYou can also read